copy the linklink copied!Indicator D5. Who are the teachers?
-
On average across OECD countries, women form less than half the teaching workforce at tertiary level, but the majority of teachers at primary and secondary levels. Within tertiary education, in most countries with available data, the share of female teachers is higher in short-cycle tertiary programmes than in bachelor’s, master’s and doctoral programmes.
-
In most OECD countries, the share of primary and secondary teachers within the wider population of 50-59 year-olds is larger than the share of primary and secondary teachers among 25-34 year-olds, which may raise concerns about future teacher shortages.
-
On average across OECD countries less than 15% of teachers are aged less than 30 years old, at all levels from primary to upper secondary.

1. Tertiary includes programmes outside tertiary level.
2. Public institutions only.
Countries are ranked in descending order of the share of female teachers in bachelor's, master's and doctoral programmes.
Source: OECD/UIS/Eurostat (2019), Education at a Glance Database, http://stats.oecd.org. See Source section for more information and Annex 3 for notes (https://doi.org/10.1787/f8d7880d-en).
Context
The demand for teachers depends on a range of factors, including average class size, required instruction time for students, the use of teaching assistants and other non-classroom staff in schools, enrolment rates at different levels of education, and the starting and ending age of compulsory education. With large proportions of teachers in several OECD countries set to reach retirement age in the next decade and projected increases in the size of the school-age population in some countries, governments will be under pressure to recruit and train new teachers. Given compelling evidence that the calibre of teachers is the most significant in-school determinant of student achievement, concerted efforts must be made to attract top talent to the teaching profession and provide high-quality training (OECD, 2015[1])
Teacher retention policies need to promote work environments that encourage effective teachers to continue teaching. In addition, as teaching at the pre-primary, primary and lower secondary levels remains largely dominated by women, the gender imbalance in the teaching profession and its possible effect on students’ learning warrant detailed study (OECD, 2017[2]).
Other findings
-
On average across OECD countries 70% of teachers are women, in all levels of education combined. The highest proportions of female teachers are concentrated in the earlier years of schooling, and the share shrinks at each successive level of education.
-
On average across OECD countries, the share of teachers over 50 years old at primary and secondary levels combined has increased by 3 percentage points over the decade. However, the teaching workforce has got younger in one-third of OECD countries.
Analysis
Gender profile of teachers
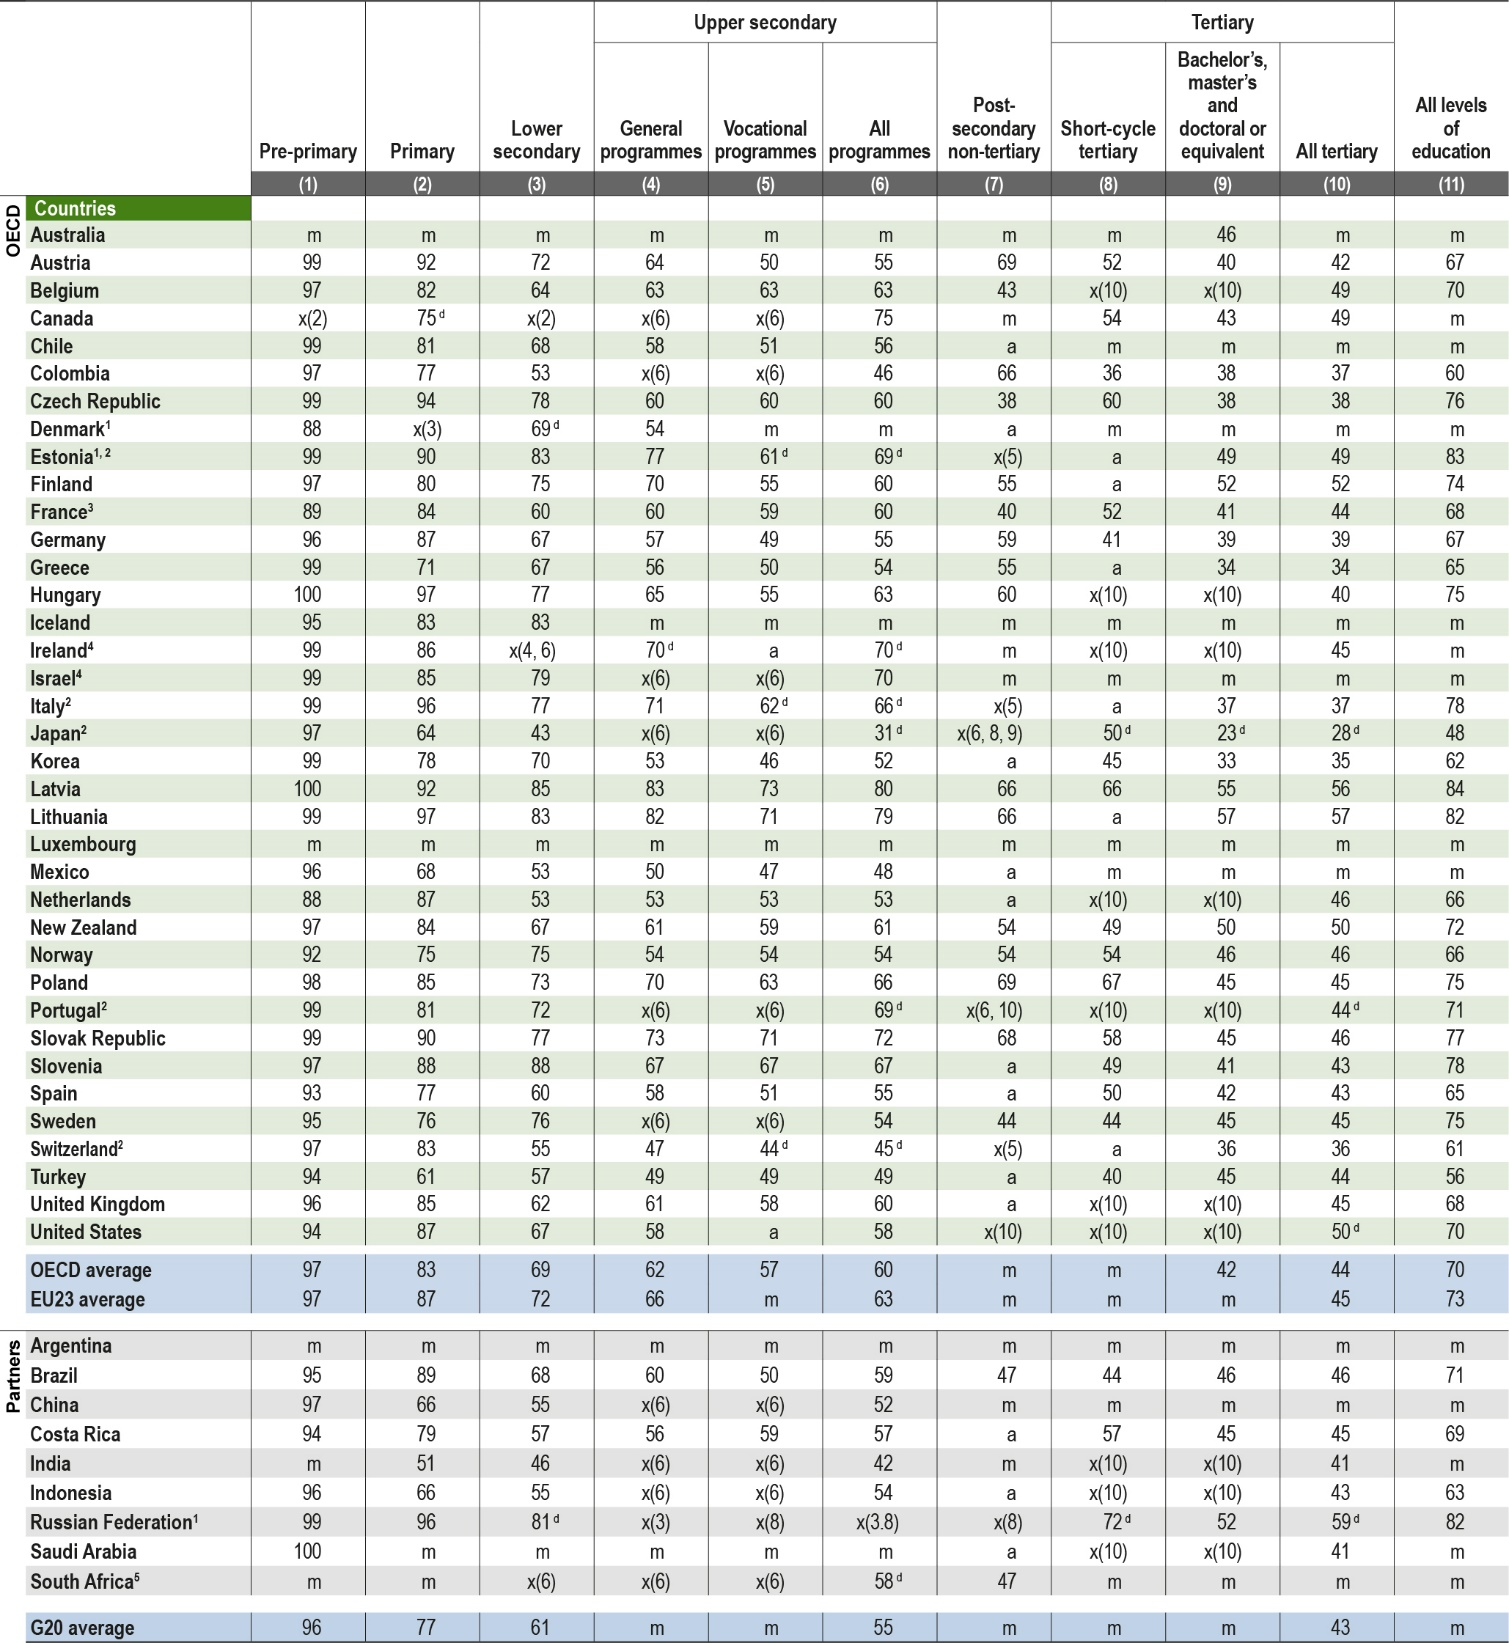
On average across OECD countries 70% of teachers are women in all levels of education combined. The greatest concentration of female teachers occurs in the earlier years of schooling, and the share shrinks at each successive level of education. While women represent 97% of the teaching staff at pre-primary level and 83% at primary level, they make up 60% at upper secondary and only 44% at tertiary level on average across OECD countries (Table D5.2).
Women make up over 85% of pre-primary teachers in all countries with available data, and over 60% of primary teachers in all OECD and partner countries except India (51%). In lower and upper secondary education, although female teachers continue to dominate, the proportion of male teachers is larger than at earlier levels. The share of female teachers ranges from 43% in Japan to 88% in Slovenia in lower secondary education. At the upper secondary level, it ranges from 31% in Japan (including part of post-secondary non-tertiary) to 80% in Latvia.
Why do so few men decide to teach at pre-primary, primary and secondary levels? One explanation may be cultural: social perceptions of links between gender and vocations may influence men and women’s career choices. This gender bias often arises very early, at home, when parents might base their aspirations for their children’s professions on gender stereotypes (Croft et al., 2014[3]; Kane and Mertz, 2012[4]; OECD, 2015[1]). Even within the teaching profession, there are gender imbalances in the different fields of study. At the lower secondary level, women make up a smaller share of teachers in science, mathematics and technology than in the overall teaching population (OECD, 2014[5]; OECD, 2017[2]). This may result from the social perception of science and technology as being a masculine domain, which may discourage women from pursuing tertiary studies in that field (Indicator B4 and (OECD, 2014[5])).
From an economic point of view, the choice of future jobs is also influenced by young people’s expectations for future earning potential. On average across OECD countries, male teachers earn less than their male tertiary-educated counterparts in other professions, while female teachers in primary and lower secondary education earn virtually the same as women with tertiary degrees in other fields (see Indicator D3 and (OECD, 2017[2])). These differences in relative salaries are likely to make the teaching profession more appealing to women than to men, compared to other professions.
The potential impact of this gender imbalance in the teaching profession on student achievement, student motivation and teacher retention is worthy of study, especially in countries where few men are attracted to the profession (Drudy, 2008[6]; OECD, 2005[7]; OECD, 2009[8]). While there is little evidence that a teacher’s gender has an effect on student performance (Antecol, Eren and Ozbeklik, 2012[9]; Holmlund and Sund, 2008[10]), aiming for a better balance between genders could nevertheless have positive effects on all students. In particular, male and female teachers can contribute to students developing positive gender identities and challenge stereotyped views (Hutchings et al., 2008[11]). There is also some evidence that female teachers’ attitudes towards some school subjects, such as mathematics, can influence their female students’ achievement (Beilock et al., 2010[12]; OECD, 2014[13]).
Gender profile of academic staff
At the tertiary level, the gender profile of teachers is reversed, with men making up the majority of academic staff across OECD countries. On average across OECD countries, women represent 44% of tertiary academic staff, ranging from 28% in Japan to 59% in the Russian Federation.
The gender profile of academic staff varies across programmes within tertiary education. Women are more strongly represented in short-cycle tertiary programmes than in bachelor’s, master’s and doctoral programmes. Specifically, women make up less than 50% of the teaching workforce at the bachelor’s, master’s and doctoral levels in over four-fifths of countries with available data and over 50% of the teaching workforce in short-cycle tertiary programmes in about two-thirds of them (Figure D5.1).
The most prevalent fields at short-cycle tertiary level are also those that are typically dominated by women. For example, in Latvia, where women make up over 60% of academic staff in short-cycle tertiary education, almost 60% of short-cycle tertiary programmes concern health and welfare, and services, which are fields where female students tend to be over-represented (see Indicator B4 and Education at a Glance Database). Short-cycle tertiary accounts for at most 20% of total tertiary enrolment in OECD countries, however, except in Australia, Canada, Chile, Korea, New Zealand, Turkey and the United States (see Indicator B1 and Education at a Glance Database). Although women may be over-represented in short-cycle tertiary education, they are still under-represented among overall tertiary academic staff (Box D5.1).
Women represent less than 50% of academic staff at bachelor’s, master’s and doctoral level in all OECD countries with available data except Finland (52%), Latvia (55%), Lithuania (57%) and New Zealand (50%). They represent less than 40% in one-third of countries with available data and only make up 23% of the academic staff in bachelor’s, master’s and doctoral programmes in Japan. Nonetheless, the representation of women in tertiary education has been growing since 2005 in most OECD countries with available data (see Education at a Glance Database).
Despite recent improvements, the gender imbalance in academia is still a challenge in most OECD countries, starting among doctoral students and continuing throughout academic careers (Winslow and Davis, 2016[14]). Specifically, women remain under-represented in the academic rank. Across European countries, women account for only one-third of researchers and one-quarter of top academic rank (European Commission, 2019[15]), compared to nearly half at doctoral level (see Indicator B7). Female researchers are more likely than men to work under contract arrangements that are considered “precarious employment” and considerable pay gaps remain in scientific research and development occupations (European Commission, 2019[15]). Women are similarly disadvantaged in other countries such as Australia (Winchester and Browning, 2015[16]) and the United States (Curtis, 2011[17]). The gender imbalance is even more striking in certain fields, including the science, technology, engineering and mathematics (STEM) fields.
Women’s career and progress in academia are more likely to be constrained by family obligations and the lack of formal policies or programmes to reduce the gender gap (Winslow and Davis, 2016[14]). Recent policy efforts across OECD countries have aimed to bring about structural change to increase women’s representation in academia. For example, the European Union has heavily invested in the Institutional Transformation for Effecting Gender Equality in Research (INTEGER) Project, in order to improve the career paths of female researchers in European higher education and research institutions (European Commission, 2016[18]). In the United States, the National Science Foundation has funded research and interventions aiming at increasing the representation of women in academic science and engineering, including the ADVANCE Institutional Transformation grant programme (Winslow and Davis, 2016[14]). In Australia, the Universities Australia Strategy for Women (2011-14) aimed at encouraging universities to include equity targets in their strategic planning and promote women in academia (Winchester and Browning, 2015[16]). Most recently, Australian universities have implemented gender quotas, with some opening academic positions in the faculty of engineering, computer and mathematical sciences to women only (Pyke and White[19]). Nonetheless, the continuing gender imbalance among academic staff in terms of participation, working conditions and pay warrants further investments and research to close the gap in the future.
Teachers’ age distribution
Teachers’ age distribution varies considerably across countries and levels of education, and can be affected by a variety of factors, such as the size and age distribution of the population, the duration of tertiary education, and teachers’ salaries and working conditions. Declining birth rates, for example, may drive down the demand for new teachers, and longer tertiary education can delay the entrance of teachers to the labour market. Competitive salaries, good working conditions and career development opportunities may attract young people to teaching in some countries and, in others, help to retain effective teachers.
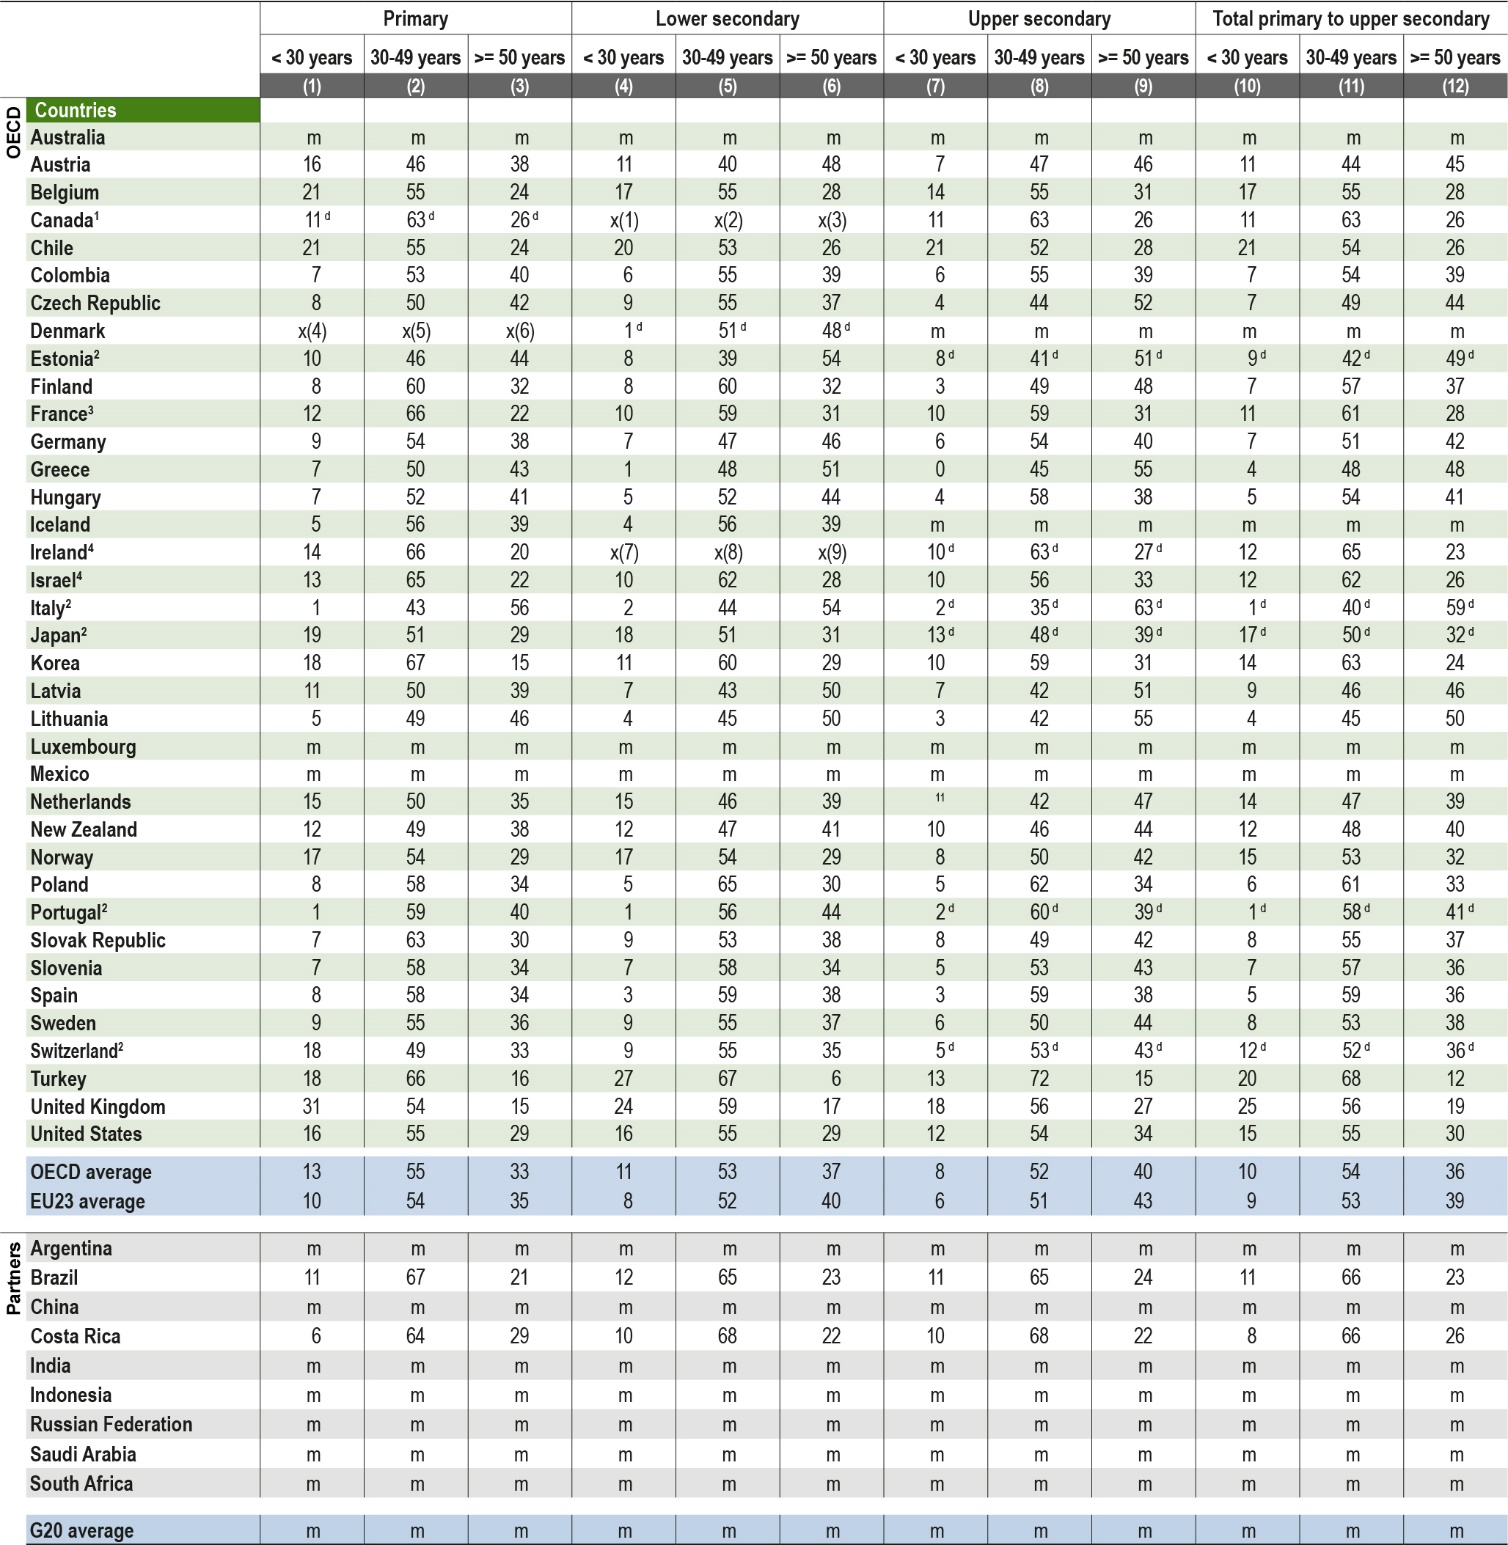
A large share of teachers are aged 50 and over. This share increases with the education level, from 33% in primary education to 37% in lower secondary and 40% in upper secondary education. This pattern is quite striking at the upper secondary level, where older teachers account for more than 30% of all teachers in more than two-thirds of countries with available data. There is, however, a high level of cross-country variation, with figures ranging from 15% in Turkey to 63% in Italy for upper secondary education. On average across OECD countries, more than half of primary, lower secondary and upper secondary teachers are aged between 30 and 49.
At tertiary level, most academic staff are over the age of 40 in all countries with available data. In fact, at least 35% of academic staff are over 50 in all countries, except in Brazil (32%), Colombia (32%), Costa Rica (33%), Germany (26%), Luxembourg (16%), the Netherlands (33%) and Turkey (19%). As for the share of tertiary academic staff below the age of 30, it varies from less than 1% in Greece, Italy and Slovenia to 24% in Germany (Education at a Glance Database).
1. Upper secondary includes programmes outside upper secondary level.
2. Public and government-dependent private institutions only.
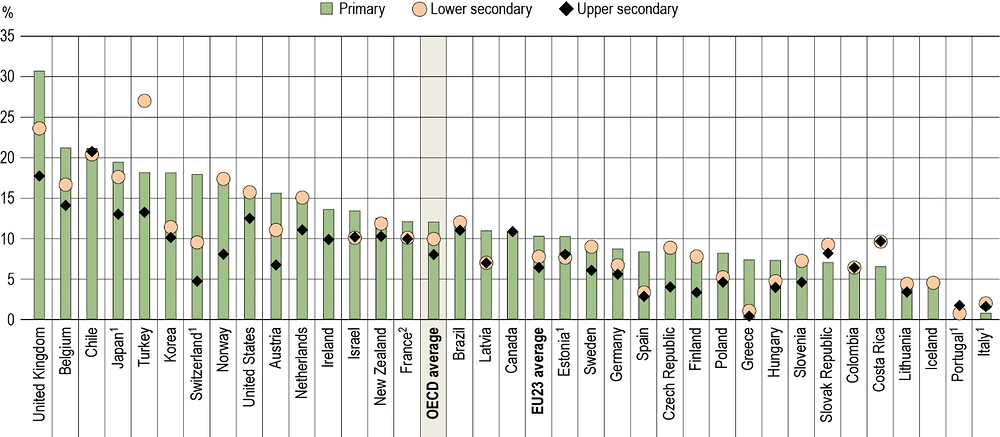
Countries are ranked in descending order of the share of teachers who are less than 30 years old in primary education.
Source: OECD/UIS/Eurostat (2019), Table D5.3. See Source section for more information and Annex 3 for notes (https://doi.org/10.1787/f8d7880d-en).
In contrast, young teachers – under the age of 30 – make up only a small proportion of the teaching population, at all levels of education: 13% in primary education, 11% in lower secondary and 8% in upper secondary on average across OECD countries. This pattern is particularly striking at the upper secondary level: young teachers make up less than 10% of the upper secondary teaching population in nearly two-third of countries with available data and account for less than 5% in about one-third of them. Overall, teachers aged under 30 form less than 25% of the teaching workforce at all levels of education and in all countries. The only exceptions are the United Kingdom (where they make up over 30% of the teaching workforce at primary level) and Turkey (where they make up 27% of the teaching force at the lower secondary level) (Table D5.1 and Figure D5.2).
The ageing of the teaching population has a number of implications for countries’ education systems. New teachers will be needed to replace the staff who will reach retirement over the next decade, particularly in countries where the school-age population is increasing (see Indicator B1). Governments may have to invest further in the teaching profession to increase its attractiveness. In addition to these recruitment and training needs, an ageing teaching workforce may also affect budgetary decisions. In most school systems, teachers’ salaries increase with years of teaching experience. Thus, the ageing of teachers increases school costs, which can in turn limit the resources available for other initiatives (see Indicator D3).
Trends in teachers’ ages between 2005 and 2017
Trend data show that on average across OECD countries with available data, the share of teachers aged 50 and older has increased by 5 percentage points over the past decade, for primary to upper secondary education combined. Greece, Hungary, Lithuania, Poland, Portugal and Slovenia saw an increase of at least 13 percentage points over this period (Education at a Glance Database), although in Poland the share of teachers aged 50 and older remains lower than the OECD average. In contrast, in Estonia, Italy, Latvia and Lithuania the share of older teachers is more than 10 percentage points higher than on average in other OECD countries and the teaching population is still ageing.
Around one-third of countries with available data – namely Chile, France, Germany, Ireland, Luxembourg, the United Kingdom and the United States – exhibit the opposite trend, and their teaching workforce has grown younger. This may be explained, in part, by efforts to implement teacher recruitment policies. For instance, the United Kingdom, which has seen the largest reduction in the share of older teachers, launched an ambitious recruitment campaign in the early 2000s, aiming at improving the status of the teaching profession. The campaign used slogans as “Use your head: teach” or “Turn your talent to teaching”, in order to appeal to youth who were considering teaching as an option but were put off by several barriers, including the financial burden of the training. In addition, the United Kingdom also provided financial support for teacher trainees (OECD, 2011[20]). Similarly, Chile implemented the National Teachers Policy in 2017, which sets a new salary scale and professional development system for teachers in publicly funded schools. It also introduced the “Teacher Vocation” scholarship, which covers tuition fees for students in universities
Share of teachers in the population
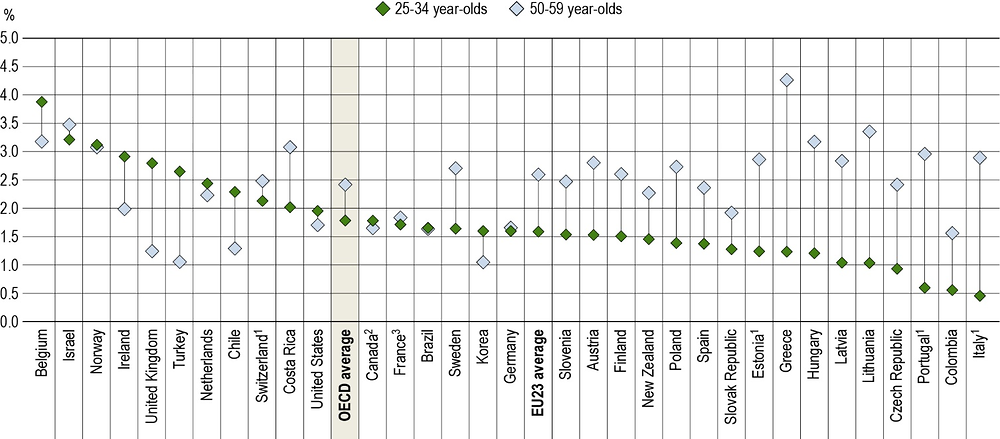
Examining the share of teachers in the wider population by age group can provide another way to analyse the evolution of the age distribution of the teaching workforce. In most OECD countries, primary and secondary teachers make up a larger share of the wider population aged 50-59 years old than they do among the population aged 25-34. The largest differences are in Greece, Italy, Lithuania and Portugal. Younger teachers make up a larger share of the population than older teachers in less than one-quarter of countries (Figure D5.3).
Breaking down the share of primary and secondary teachers in the population by age group also highlights rising concerns regarding possible future shortages. In Italy and Portugal, teachers represent only 0.6% or less of the population aged 25-34, while they make up close to 3% of the population among 50-59 year-olds. The proportions are similar across the two age groups in Brazil, Canada, France, Germany, Israel, the Netherlands, Norway, Switzerland and the United States (Figure D5.3).
In most OECD countries, new teachers will be needed to replace the staff who will reach retirement over the next decade. Governments may have to develop teacher-training programmes and increase incentives for students to join the teaching profession (see Indicator D6 in OECD (2014[21])). In parallel, fiscal constraints (particularly driven by pension obligations and healthcare costs for retirees) may put pressure on governments to reduce academic offerings, increase class sizes or integrate more self-paced online learning (Peterson, 2011[22]).
1. Upper secondary includes programmes outside upper secondary level.
2. Primary includes pre-primary education.
3. Public and government-dependent private institutions only.
Countries are ranked in descending order of the share of teachers among 25-34 year-olds.
Source: OECD/UIS/Eurostat (2019), Education at a Glance Database, http://stats.oecd.org. See Source section for more information and Annex 3 for notes (https://doi.org/10.1787/f8d7880d-en).
Definitions
There are two categories of instructional personnel:
-
Teachers’ aides and teaching/research assistants include non-professional personnel or students who support teachers in providing instruction to students.
-
Teaching staff refers to professional personnel directly involved in teaching to students. The classification includes classroom teachers, special-education teachers and other teachers who work with a whole class of students in a classroom, in small groups in a resource room, or in one-to-one teaching situations inside or outside a regular class. At the tertiary level, academic staff include personnel whose primary assignment is instruction or research. Teaching staff also include departmental chairs whose duties include some teaching, but exclude non-professional personnel who support teachers in providing instruction to students, such as teachers’ aides and other paraprofessional personnel.
Methodology
The share of teachers in the population corresponds to the proportion of teachers in a given age group (e.g.: 25-34 year-olds, 50-59 year-olds) among the total population of the same age group.
For more information, please see the OECD Handbook for Internationally Comparative Education Statistics 2018: Concepts, Standards, Definitions and Classifications (OECD, 2018[23]) and Annex 3 for country-specific notes (https://doi.org/10.1787/f8d7880d-en).
Source
Data refer to the academic year 2016/17 and are based on the UNESCO-UIS/OECD/EUROSTAT data collection on education statistics administered by the OECD in 2018 (for details, see Annex 3 at https://doi.org/10.1787/f8d7880d-en).
Note regarding data from Israel
The statistical data for Israel are supplied by and are under the responsibility of the relevant Israeli authorities. The use of such data by the OECD is without prejudice to the status of the Golan Heights, East Jerusalem and Israeli settlements in the West Bank under the terms of international law.
References
[9] Antecol, H., O. Eren and S. Ozbeklik (2012), “The effect of teacher gender on student achievement in primary school: Evidence from a randomized experiment”, IZA Discusssion Papers, No. 6453, http://ftp.iza.org/dp6453.pdf (accessed on 20 April 2018).
[12] Beilock, S. et al. (2010), “Female teachers’ math anxiety affects girls’ math achievement.”, Proceedings of the National Academy of Sciences of the United States of America, Vol. 107/5, pp. 1860-3, https://doi.org/10.1073/pnas.0910967107.
[3] Croft, A. et al. (2014), “The second shift reflected in the second generation”, Psychological Science, Vol. 25/7, pp. 1418-1428, https://doi.org/10.1177/0956797614533968.
[17] Curtis, J. (2011), Persistent Inequity: Gender and Academic Employment, American Association of University Professors, Washington, DC, https://www.aaup.org/NR/rdonlyres/08E023AB-E6D8-4DBD-99A0-24E5EB73A760/0/persistent_inequity.pdf.
[6] Drudy, S. (2008), “Gender balance/gender bias: the teaching profession and the impact of feminisation”, Gender and Education, Vol. 20/4, pp. 309-323, https://doi.org/10.1080/09540250802190156.
[15] European Commission (2019), She Figures 2018.
[18] European Commission (2016), INTEGER Report Summary, http://www.integer-tools-for-action.eu.
[10] Holmlund, H. and K. Sund (2008), “Is the gender gap in school performance affected by the sex of the teacher?”, Labour Economics, Vol. 15/1, pp. 37-53, https://doi.org/10.1016/j.labeco.2006.12.002.
[11] Hutchings, M. et al. (2008), “Nice and kind, smart and funny: What children like and want to emulate in their teachers”, Oxford Review of Education, Vol. 34/2, pp. 135-157, https://doi.org/10.1080/03054980701663959.
[4] Kane, J. and J. Mertz (2012), “Debunking myths about gender and mathematics performance”, Notices of the AMS, Vol. 59/1, https://doi.org/10.1090/noti790.
[23] OECD (2018), OECD Handbook for Internationally Comparative Education Statistics 2018: Concepts, Standards, Definitions and Classifications, OECD Publishing, Paris, https://doi.org/10.1787/9789264304444-en.
[2] OECD (2017), “Gender imbalances in the teaching profession”, Education Indicators in Focus, No. 49, OECD Publishing, Paris, https://doi.org/10.1787/54f0ef95-en.
[1] OECD (2015), “What lies behind gender inequality in education?”, PISA in Focus, No. 49, OECD Publishing, Paris, https://doi.org/10.1787/5js4xffhhc30-en.
[21] OECD (2014), Education at a Glance 2014 : OECD Indicators, OECD Publishing, https://doi.org/10.1787/eag-2014-en.
[5] OECD (2014), PISA 2012 Results: What Students Know and Can Do (Volume I, Revised edition, February 2014): Student Performance in Mathematics, Reading and Science, PISA, OECD Publishing, Paris, https://doi.org/10.1787/9789264208780-en.
[13] OECD (2014), TALIS 2013 Results: An International Perspective on Teaching and Learning, OECD Publishing, Paris, https://doi.org/10.1787/9789264196261-en.
[20] OECD (2011), Lessons from PISA for the United States, Strong Performers and Successful Reformers in Education, OECD Publishing, Paris, https://dx.doi.org/10.1787/9789264096660-en.
[8] OECD (2009), Creating Effective Teaching and Learning Environments: First Results from TALIS, OECD Publishing, Paris, https://doi.org/10.1787/9789264068780-en.
[7] OECD (2005), Teachers Matter: Attracting, Developing and Retaining Effective Teachers, OECD Publishing, Paris, https://doi.org/10.1787/9789264018044-en.
[22] Peterson, P. (2011), Saving schools : from Horace Mann to virtual learning, Belknap Press of Harvard University Press.
[19] Pyke, J. and K. White (n.d.), “Are gender quotas in academia a good idea?”, https://www.weforum.org/agenda/2018/09/gender-quotas-may-speed-up-equity-in-academia (accessed on 16 May 2019).
[16] Winchester, H. and L. Browning (2015), “Gender equality in academia: a critical reflection”, Journal of Higher Education Policy and Management, Vol. 37/3, pp. 269-281, https://doi.org/10.1080/1360080X.2015.1034427.
[14] Winslow, S. and S. Davis (2016), “Gender inequality across the academic life course”, Sociology Compass, Vol. 10/5, pp. 404-416, https://doi.org/10.1111/soc4.12372.
Table D5.1 Age distribution of teachers (2017)
Table D5.2 Gender distribution of teachers (2017)
Table D5.3 Gender distribution of teachers by age group (2017) and percentage of female teachers for all ages (2005 and 2017)
Cut-off date for the data: 19 July 2019. Any updates on data can be found on line at https://doi.org/10.1787/eag-data-en. More breakdowns can also be found at http://stats.oecd.org/, Education at a Glance Database.
StatLink: https://doi.org/10.1787/888933981267
|
Table D5.1. Age distribution of teachers (2017)
|
|---|
|
Percentage of teachers in public and private institutions, by level of education and age group, based on head counts
|
 |
|
1. Primary includes pre-primary education. |
|
2. Upper secondary includes programmes outside upper secondary level - see Annex 3 for further details. |
|
3. Public and government-dependent private institutions only. |
|
4. For Ireland, public institutions only. For Israel, private institutions are included for all levels except for pre-primary and upper secondary levels. |
|
Source: OECD/UIS/Eurostat (2019). See Source section for more information and Annex 3 for notes (https://doi.org/10.1787/f8d7880d-en). |
|
Please refer to the Reader's Guide for information concerning symbols for missing data and abbreviations. |
|
Table D5.2. Gender distribution of teachers (2017)
|
|---|
|
Percentage of female teachers in public and private institutions by level of education, based on head counts
|
 |
|
Note: The data in "All levels of education" do not include early childhood educational development (ISCED 01). |
|
1. Pre-primary includes early childhood education. |
|
2. Upper secondary includes programmes outside upper secondary level - see Annex 3 for further details. |
|
3. Public and government-dependent private institutions only for all levels except for tertiary. For tertiary education, public institutions only. |
|
4. For Ireland, public institutions only for all levels except pre-primary, where data include independent private institutions only. For Israel, private institutions are included for all levels except for pre-primary and upper secondary levels. |
|
5. Year of reference 2016 instead of 2017 |
|
Source: OECD/UIS/Eurostat (2019). See Source section for more information and Annex 3 for notes (https://doi.org/10.1787/f8d7880d-en). |
|
Please refer to the Reader's Guide for information concerning symbols for missing data and abbreviations. |
|
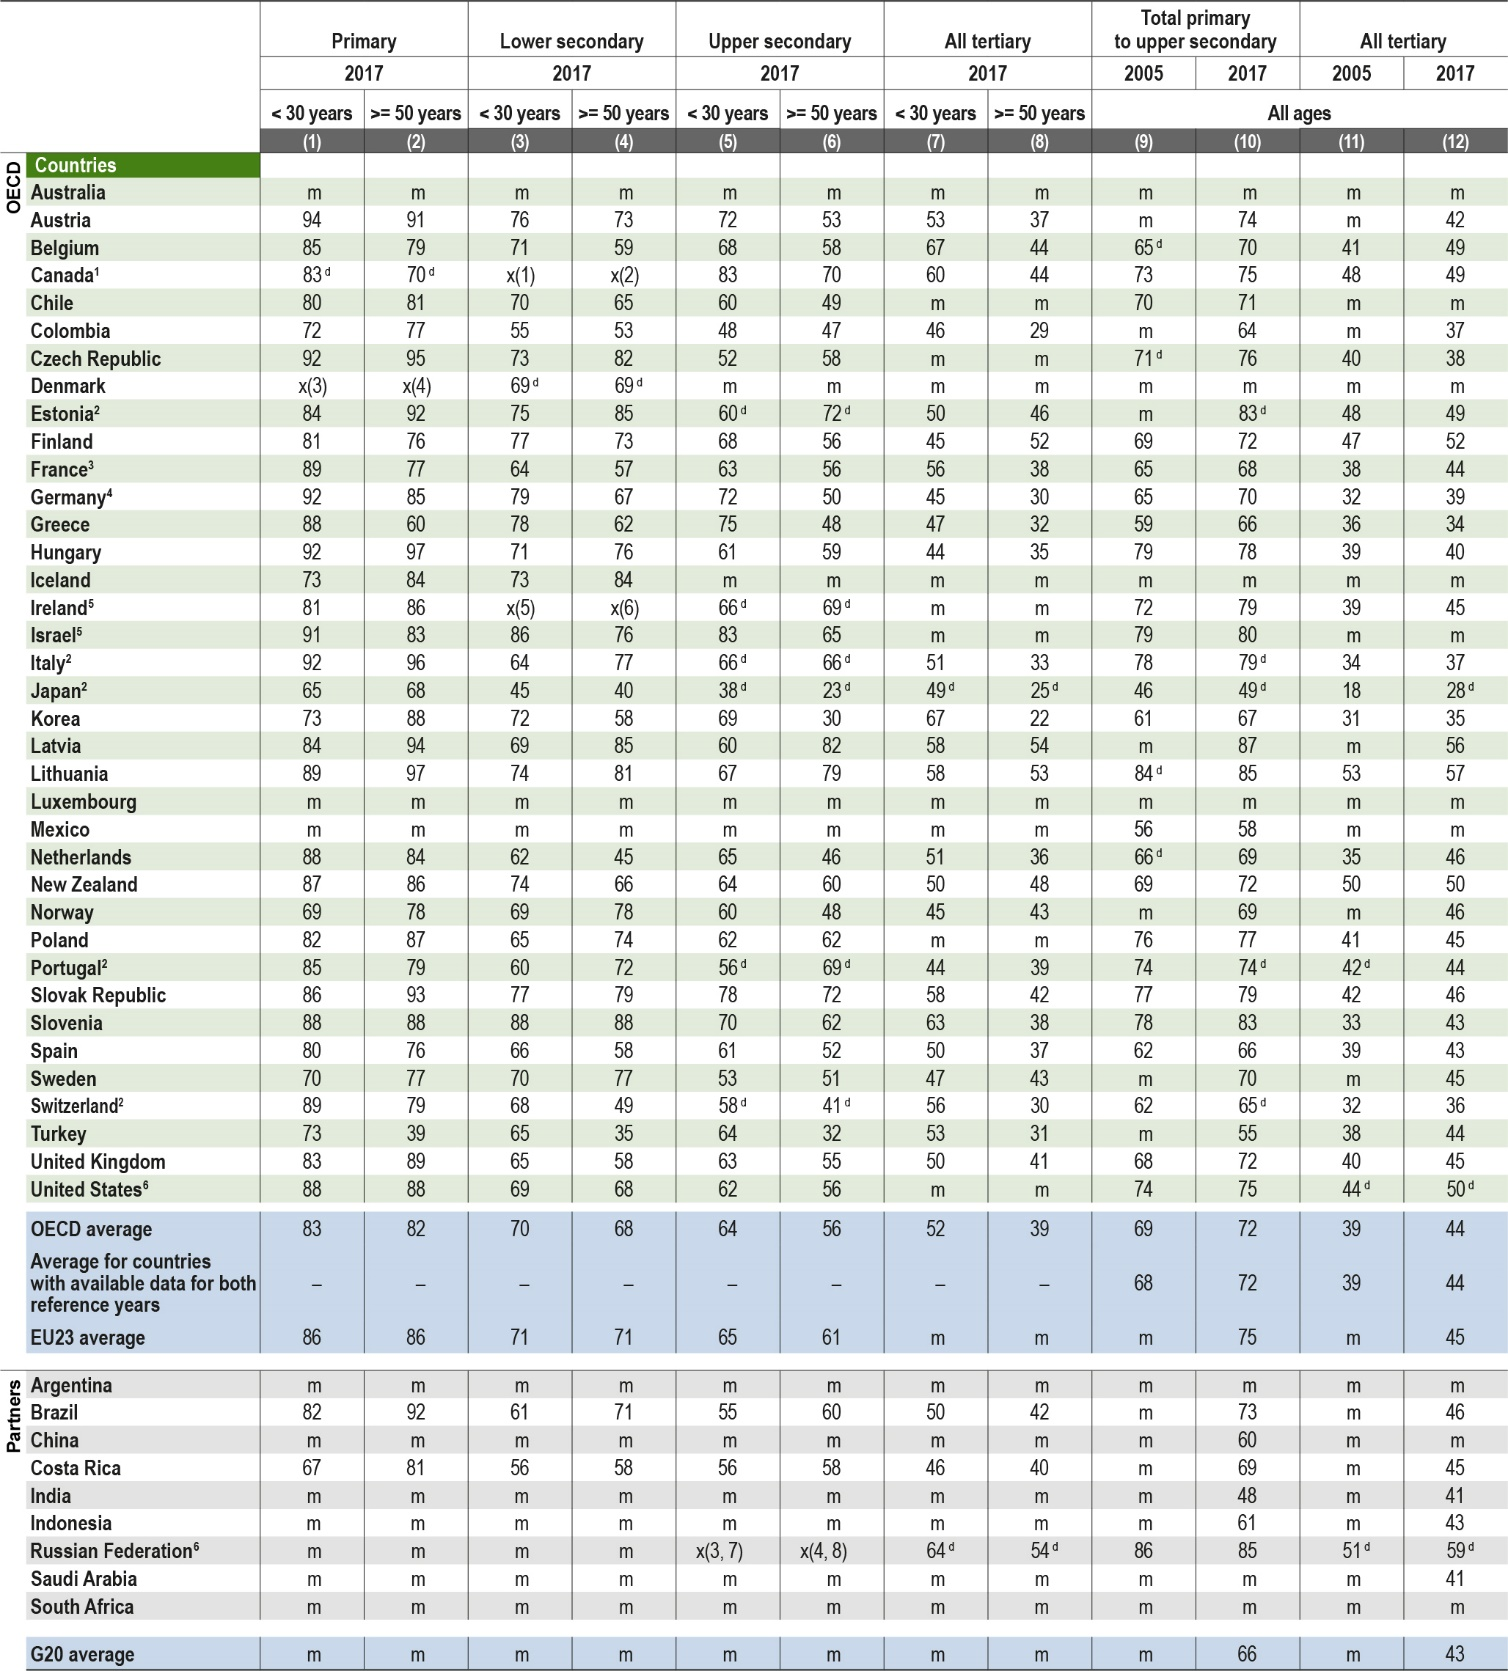
Table D5.3. Gender distribution of teachers by age group (2017) and percentage of female teachers for all ages (2005 and 2017)
|
|---|
|
Percentage of female teachers, by age group and level of education
|
 |
|
1. Primary includes pre-primary education. |
|
2. Upper secondary includes programmes outside upper secondary level - see Annex 3 for further details. |
|
3. Public and government-dependent private institutions only for all levels except for tertiary. For tertiary education, public institutions only. |
|
4. Year of reference 2006 instead of 2005. |
|
5. For Ireland, public institutions only. For Israel, private institutions are included for all levels except for pre-primary and upper secondary levels. |
|
6. Tertiary includes programmes outside tertiary level - see Annex 3 for further details. |
|
Source: OECD/UIS/Eurostat (2019). See Source section for more information and Annex 3 for notes (https://doi.org/10.1787/f8d7880d-en). |
|
Please refer to the Reader's Guide for information concerning symbols for missing data and abbreviations. |
Metadata, Legal and Rights
https://doi.org/10.1787/f8d7880d-en
© OECD 2019
The use of this work, whether digital or print, is governed by the Terms and Conditions to be found at http://www.oecd.org/termsandconditions.