1. Environmental performance: trends and recent developments
During Greece’s long recession, emissions of greenhouse gases and most other air pollutants declined faster than GDP. As the economy recovers, it is a challenge to improve well-being, income and employment while reducing poverty and keeping environmental pressures low. Agriculture, transport, tourism and fisheries are putting pressures on biodiversity. This chapter provides a snapshot of key environmental trends in Greece over the past decade. It presents the main economic and social developments and reviews progress in reducing the energy and carbon intensity of the economy, in making the transition to a resource-efficient economy and in managing the natural asset base. It also summarises key policy developments in areas including energy and climate, air, water and waste.
After a long, deep recession, the Greek economy started to recover in 2017. Following extensive fiscal and structural reforms, the country faces difficult challenges in improving well-being, income and employment and reducing poverty. Between 2009 and 2017, some environmental pressures, including emissions of greenhouse gases (GHGs), and sulphur and nitrogen oxides (SOX and NOX), declined faster than gross domestic product (GDP). Since 2013, however, energy consumption, municipal waste generation and pesticide use have grown more quickly than economic activity.
Greece has made significant progress in shifting the energy mix from oil and coal to natural gas and renewables. However, it ranks among the ten most carbon-intensive economies in the OECD due to its strong reliance on fossil fuels. Agriculture, transport, tourism and fisheries are putting pressures on the country’s considerable biological wealth.
1.1.1. Economic performance and structure of the economy
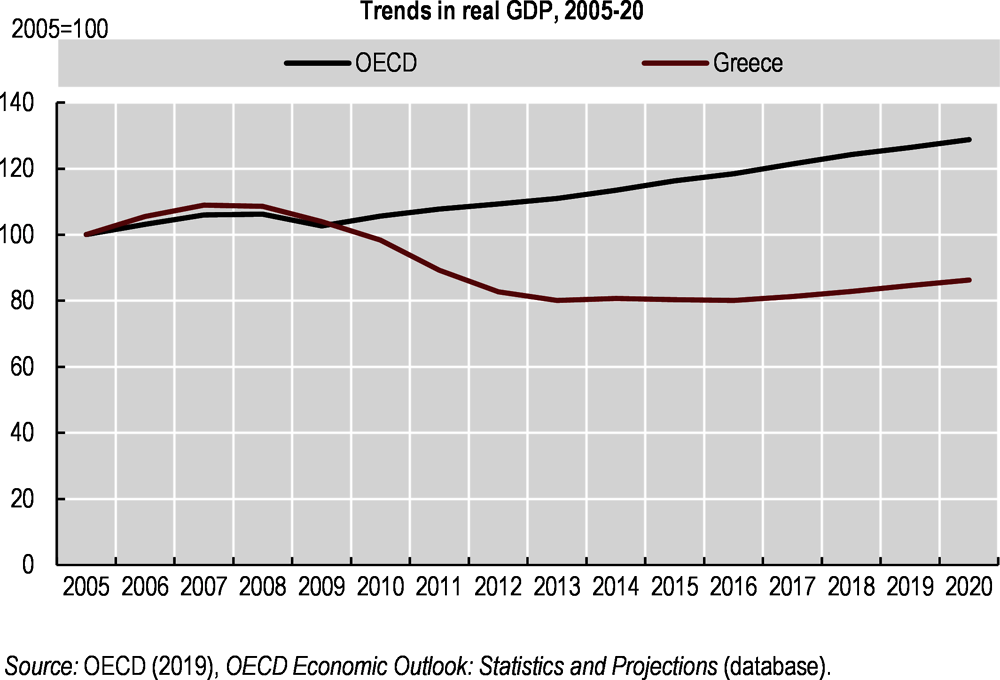
After a deep recession over 2008-16, during which real GDP fell by 26%, the economy has started to recover (Figure 1.1) (OECD, 2018a). GDP growth strengthened at 1.4% in 2017 and 1.9% in 2018 and is projected to remain around 2% until 2021 (OECD, 2019a). Employment and real wage gains will support consumption, while improving financing conditions and confidence will boost business investment. Growth is being supported by rising goods exports and tourism despite sluggish external demand. The pace of reforms has accelerated and broadened in recent years, with major fiscal adjustments reversing imbalances in public finances and the current account. In 2017, Greece returned to the international debt market after a three-year hiatus, signalling investors’ increasing confidence in its prospects and improved fiscal credibility.
Despite this progress, after three bailout plans1 by the European Commission, the European Central Bank and the International Monetary Fund, the public debt, at more than 180% of GDP, is still among the world’s highest (OECD, 2018a). Slow progress in attracting new foreign direct investment is also a concern, as is the scale of banks’ non-performing loans. Poverty rose sharply during the crisis, especially among families with children, the young and the unemployed. Although labour market reforms have boosted employment, 19.3% of the active population was unemployed in 2018, the highest rate in the OECD.
Greece has a small, service-based economy. In 2017, services (mostly trade, transport, accommodation and food, and real estate activities) contributed 79% of total value added, well above the OECD average of 73%. Tourism is a vital driver of the Greek economy. In 2018, it directly accounted for 12% of GDP, while its direct and indirect contribution was estimated at between 26% and 31% of GDP (INSETE, 2019). Agriculture is also more important than in most other OECD countries, accounting for 4% of value added and 12% of employment. The share of industry2 in value added rose from 11% to 15% over 2010-17, driven by increasing contributions from food product manufacturing and basic metals. Meanwhile, construction’s share fell by half, to 2%. The economy is becoming more open, although exports, at 36% of GDP in 2018, remained below the EU average of 46%. Goods, especially oil products,3 account for an increasing share of total exports. Within service exports, the share of tourism (52% in 2017) has exceeded that of transport (32%, mainly shipping) since the mid-2010s.
1.1.2. Population, well-being and environmental quality of life
After a decade of steady growth, population has been decreasing since 2010 due to a reduced fertility rate and, until 2015, negative net migration (Eurostat, 2018). Greece is the main entry point to Europe for refugees and migrants travelling on the eastern Mediterranean route (OECD, 2019b). Illegal border crossings soared from an annual average of 45 000 over 2008-14 to 885 000 in 2015, subsequently dropping to 42 000 in 2017. The old-age dependency ratio4 is expected to continue to rise from an already high rate of 33% in 2016 to 71% in 2050, though the public ageing cost is expected to decline as a result of pension reforms (EC, 2018a).
Although a majority of people live in cities of more than 50 000, the share of population in rural regions is higher than the OECD average (Basic statistics). The Athens and Thessaloniki metropolitan areas account for 43% of the population and 56% of GDP (OECD, 2018b). While the crisis affected all regions, disparity among them has significantly widened in the past decade.
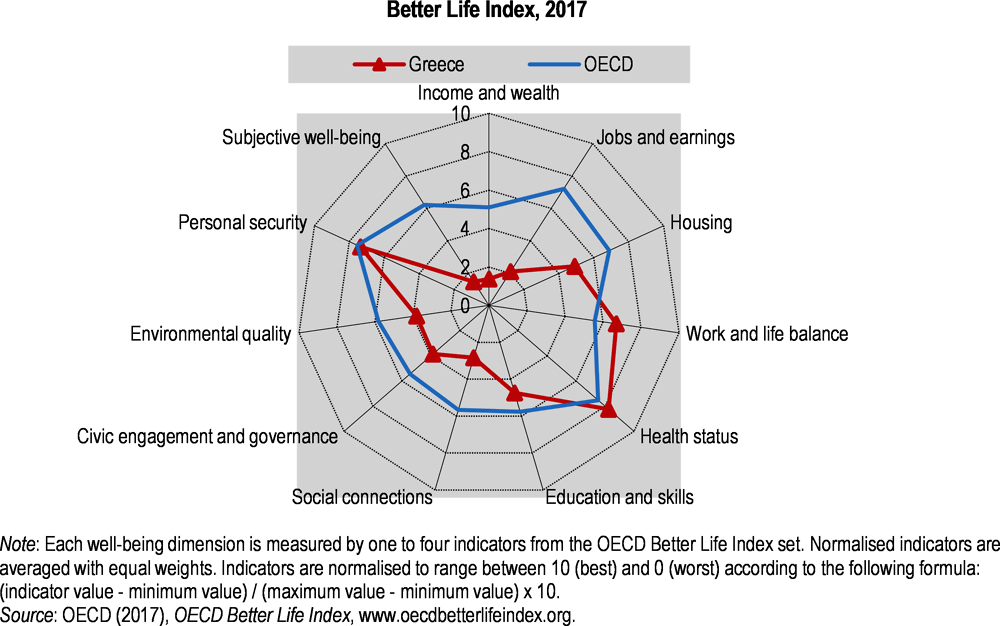
Greece ranks below the OECD average in most dimensions of the OECD’s Better Life Index (Figure 1.2). It compares favourably only in health status and work-life balance. The legacy of the crisis weighs especially on subjective well-being, income and jobs.
1.2.1. Energy supply and demand
Key policy developments
In a welcome move, the government that was elected in 2019 announced a lignite phase-out by 2028. As required by EU rules, Greece released a National Energy and Climate Plan (NECP) and a Long-term Strategy to 2050 in 2019, in line with the Paris Agreement (MoEE, 2019; MoEE, 2020) (Chapter 4). The NECP outlines an evolution scenario for the energy system and proposes policies and measures for achieving the national energy and climate targets for 2030 and enabling the transition to a climate-neutral economy by 2050. By 2030, the plan aims to i) reduce total GHG emissions, excluding those from land use, land use change and forestry (LULUCF), by 56% from 2005 levels (42% from 1990 levels); ii) reduce GHG emissions not covered by the EU Emissions Trading System (EU ETS) by 36% from 2005 levels, more than twice the reduction required for Greece by EU legislation (16%);5 iii) raise the share of renewables in gross final energy consumption to at least 35%; and iii) limit final energy consumption to 16.5 million tonnes of oil equivalent (Mtoe). Other objectives include increasing energy security, strengthening the competitiveness of the economy, protecting vulnerable consumers and making the domestic energy market more competitive. The NECP also integrates the 2020-30 targets set in the new National Emission Ceilings (NEC) Directive (Section 1.2.3).
The NECP expects promotion of renewables in electricity generation and improvement of the conventional power system (decommissioning of all lignite power plants, expansion of the gas-fired power plant fleet, interconnection of certain islands with the mainland grid) to contribute the most to GHG emission reduction (Chapter 4). On the other hand, it predicts low emission reductions in the transport sector, suggesting a need to better integrate climate targets in transport policy.
Energy supply and electricity generation
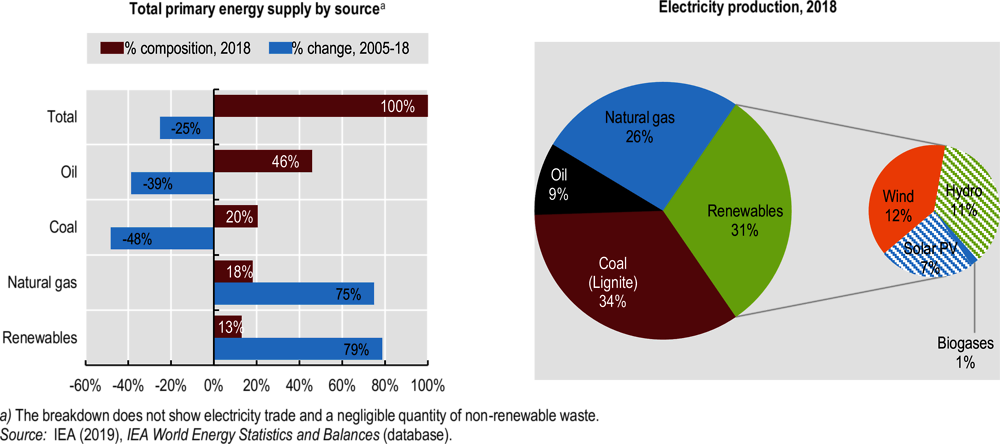
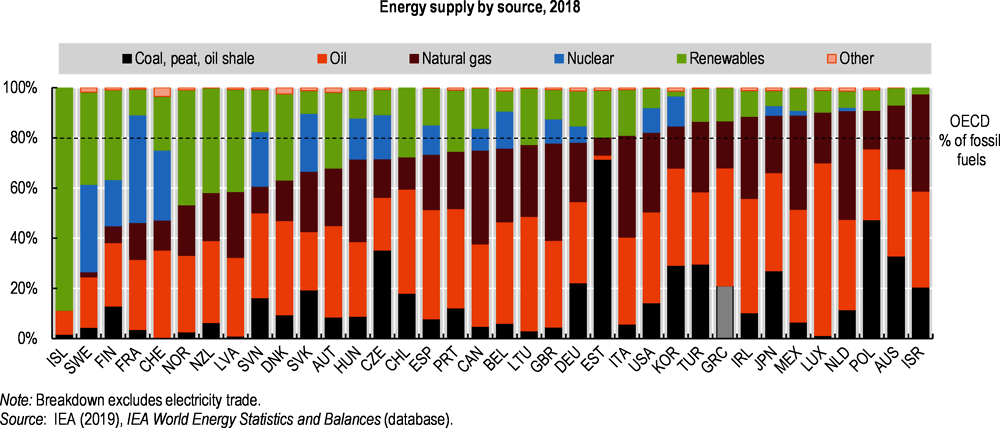
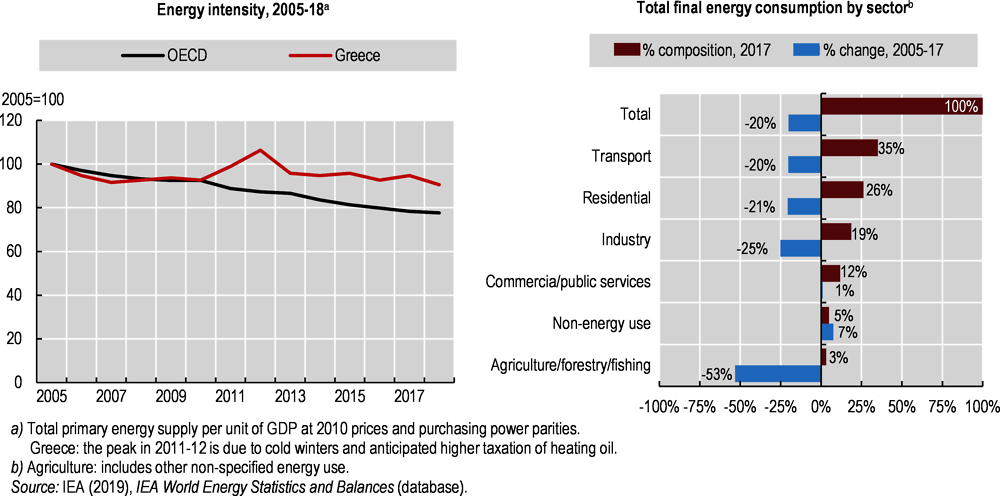
Total primary energy supply (TPES) dropped significantly during the economic crisis and has remained stable since 2013. Oil is the dominant fuel, accounting for half of TPES, while domestic coal is the major electricity generation source (Figure 1.3). Greece does not use nuclear energy and is not considering this option. Over the past decade there has been a clear shift from oil and coal to natural gas and renewables. However, Greece remains among the top ten OECD countries with the highest shares of fossil fuel in the energy mix (Figure 1.4). In 2018, energy intensity (expressed as TPES per unit of GDP) was below the OECD average but on a par with the EU average. It has decreased more slowly than in most other OECD countries (Figure 1.5).
Renewable energy sources
The 2010 National Renewable Energy Action Plan (NREAP) aims to reach a 20% share of renewables in gross final energy consumption by 2020, above the objective of 18% imposed by the relevant EU directive (2009/28/EC). The NREAP sets targets by sector: 40% in gross final electricity consumption, 20% in heating and cooling and 10% in transport final consumption. The NECP envisages raising these shares to more than 60% for electricity, over 40% for heating and cooling and 19% for transport by 2030 (MoEE, 2019).
With a share of 18% in 2018, Greece achieved the 2020 target of the Renewable Energy Directive. While the country has already exceeded the 2020 target on heating and cooling, the NECP projects that it will not meet the 2020 NREAP objectives on electricity and transport.
Since 2005, renewables (mainly wind and solar photovoltaics) have increased by 79% in the energy supply and by 153% in electricity production, thanks to generous feed-in tariffs and decreasing technology costs (Chapter 4). In 2018, the shares of renewables in TPES (13%) and electricity generation (31%) were above the OECD averages of 10% and 26%. Greece was one of the OECD countries with the highest shares of solar PV in electricity generation. Integrating additional variable renewables while ensuring system reliability will require strengthening the internal transmission network, including interconnecting many islands with the main network, investing in flexible generation, enhancing regional interconnections, exploring the potential of energy storage and implementing demand-response programmes (IEA, 2017).
Energy consumption
The third National Energy Efficiency Action Plan (2014) aims at achieving final energy consumption of 18.4 Mtoe in 2020 (a 12% reduction from 2005), in line with the Energy Efficiency Directive (2012/27/EU).
Transport accounts for the highest share of final energy consumption, followed by the residential sector and industry (Figure 1.5). Between 2005 and 2017, energy consumption decreased by 20%, driven by the decline in economic activity and, to a lesser extent, by progress in energy efficiency (EC, 2017a). Despite an increase in consumption since 2013, Greece is on track to reach its 2020 target (Chapter 4).
Transport
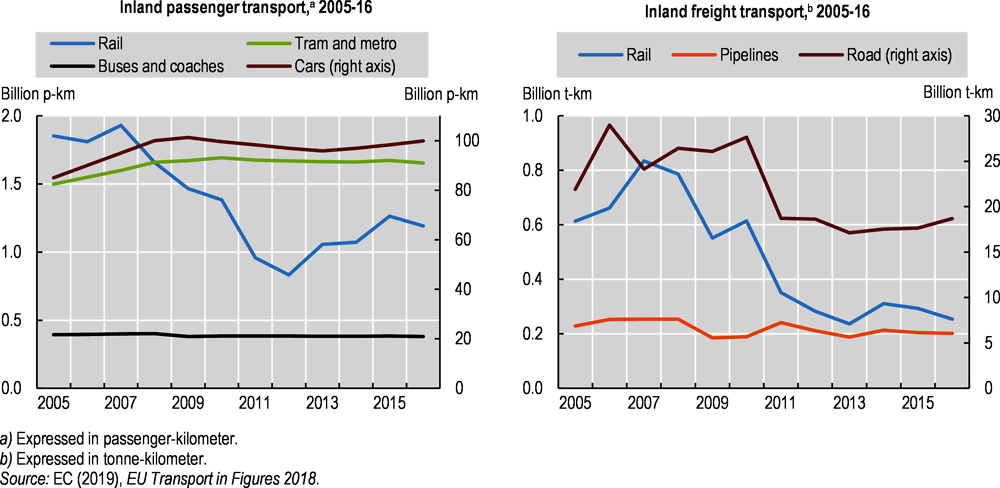
Transport is the second highest GHG emitter. Road transport accounts for a larger share of energy consumed (30%) than the OECD Europe average (26%), reflecting its predominant share (Figure 1.6). Inland transport activity, freight in particular, fell significantly over 2009-13 but has since started to grow again (EC, 2018b). Rail transport recorded the sharpest drop, although passenger rail transport bounced back in 2013. By 2016, car passenger transport had nearly recovered to its pre-crisis level.
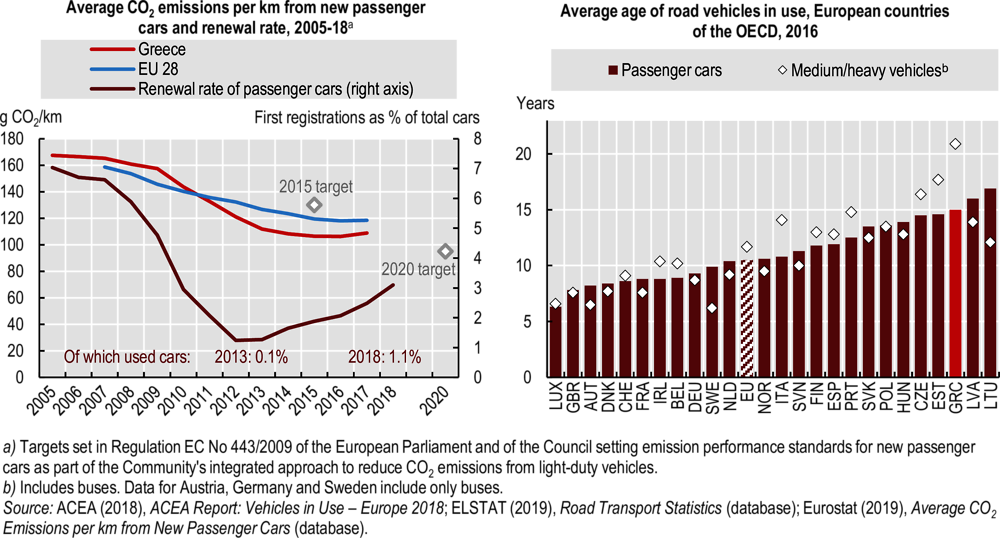
Although Greece’s car ownership rate is slightly below the EU average, its motorisation rate is higher than in a majority of OECD countries. This is because Greece has many low-efficiency trucks6 mostly operated on own account (National Bank of Greece, 2017). The number of passenger cars in use slowed due to the recession, lower demand for new cars and incentives for scrapping old vehicles, but began growing again in 2016. The decline in the passenger car renewal rate and growing share of used cars among vehicles put into circulation contributed to the ageing of the car fleet, one of the oldest in Europe (Figure 1.7).
Unlike in the majority of OECD countries, diesel accounts for less than half of road fuel consumption. Greece has relatively few alternative fuel vehicles (mostly running on liquefied petroleum gas), so petrol cars remain largely dominant. However, vehicle and fuel taxation, combined with removal of a ban on diesel cars in Athens and Thessaloniki, has supported sales of diesel passenger cars (Chapter 3). Average carbon dioxide (CO2) emissions of new cars fell to 108.8 g/km in 2017, one of the lowest levels in the EU, although it is widely recognised that actual emissions are higher (Figure 1.7).
Ensuring environmental sustainability is one of five high-level objectives7 of the 2019 National Transport Plan (NTP), which identifies infrastructural, operational and institutional measures to be implemented to 2037 (MIT, 2019). The plan proposes actions to improve road freight transport efficiency and spur integration with rail, renew the vehicle fleet and develop electric charging infrastructure, improve intermodality between intercity public transport and urban transport, develop sustainable urban mobility plans and promote soft transport modes. However, the NTP notes that measures such as a scrappage programme for heavy-duty vehicles, fiscal incentives for greening the vehicle fleet and electro-mobility development are challenging and require further discussions.
Planned infrastructure is expected to more than double passenger rail transport and increase rail freight transport by 75% between 2017 and 2037, though from a very low level. At the same time, road transport is projected to grow significantly, resulting in few changes in the modal split. While the NTP sets targets for increasing the transit freight traffic volume (e.g. a sevenfold increase in transit cargo volume in Thessaloniki), there is no target on modal split or on GHGs and other air pollutant emissions. Still, the NTP expects a 17% reduction in environmental external costs of transport, compared to the baseline scenario, by 2037.
1.2.2. Climate change mitigation and adaptation
Emission profile and progress towards targets
Total GHG emissions peaked in 2005 and have since declined by 30% (Chapter 4). In 2017, the main sources of emissions were the energy industry, which accounted for 42% of total emissions, and transport at 18%. The decline in economic activity and related energy demand during the recession and the increase in renewables use have led to emission reductions (IEA, 2017). However, Greece ranks among the ten most carbon-intensive economies in the OECD due to its high reliance on coal and diesel for electricity generation (especially on the non-interconnected islands).
Greece surpassed its Kyoto target for the first commitment period of limiting the increase of GHG emissions (excluding LULUCF) to 25%, achieving a 17% rise over 2008-12 from 1990 levels (Chapter 4) Emissions not covered by the EU ETS decreased by 28% between 2005 and 2018, putting Greece on track to meet its targets of reducing related emissions by 4% by 2020 and by 16% by 2030. In 2017, EU ETS installations represented slightly more than half the country’s GHG emissions. EU ETS-covered emissions decreased by 36% between 2005 and 2018.
The NECP raises Greece’s climate ambition for 2030: GHG emissions are expected to decline by 56% below 2005 levels (or 42% below 1990 levels) compared with 41% below 2005 levels under most recent projections with existing measures. However, ambitious additional measures will need to be implemented to progress towards net zero emissions by mid-century, as outlined in the Long-term Strategy to 2050.
Climate change outlook and adaptation policy
It is expected that by the end of the 21st century, precipitation levels will have fallen by between 5% and 19% countrywide, depending on the scenario, while air temperature will have increased by between 3.0ºC and 4.5ºC (Bank of Greece, 2011). Around 1 000 km of the country’s 18 400 km of coastline is highly vulnerable to climate change, with average sea level expected to rise by between 0.2 m and 2 m, compounded by extreme wave events and local factors (tectonics, geomorphology, etc.). About 58% of the total Aegean coastline is highly vulnerable to the projected impact (MoEE, 2018a). Water scarcity is of particular concern. Agriculture is the sector expected to be most severely affected by climate change, while the impact on tourism and coastal systems is likely to have major consequences on household income and the economy as a whole (MoEE, 2016[18]).
Under an inaction scenario, it is estimated that GDP would drop by an annual 2% by 2050 and 6% by 2100, and the total cumulative cost for the economy over the period to 2100, expressed as GDP loss relative to base year GDP, would amount to EUR 701 billion (at 2008 prices). A drastic reduction in Greece’s GHG emissions as part of a global effort to contain the average global temperature rise to no more than 2º C would reduce the cost by 40% while an adaptation scenario would cut it by 20%.
The 2016 National Adaptation Strategy defines the goals, principles and priorities of adaptation and lists potential adaptation measures for sectors that are likely to be significantly affected by climate change: biodiversity and ecosystems, agriculture and food security, forestry, fisheries, aquaculture, water resources, coastal areas, tourism, energy, human health, the built environment, transport, cultural heritage, industry, mining and insurance. The strategy is being translated into regional adaptation action plans that will set priorities based on regional vulnerability (Chapter 4).
1.2.3. Atmospheric emissions and air quality
Greece’s air management policy is shaped by the 2013 Clean Air Programme for Europe. The country fell behind in developing its national air pollution control programme8 to ensure that it met the reduction commitments for 2020 and 2030 set in the NEC Directive. Greece established a transitional national plan giving some power plants more time to comply with the Industrial Emissions Directive (2010/75/EU).
Air emissions
Since 2009, emissions of major air pollutants have decreased faster than economic activity except in the case of ammonia (NH3) (Figure 1.8). The reduction in energy consumption, abatement measures such as flue gas desulphurisation, changes in the electricity mix (increased use of gas and renewables, decommissioning of old coal power plants), reduction of fuels’ sulphur content and the scrapping of old vehicles have been the main drivers of this decline. However, levels of emission intensity per unit of GDP remain high, mainly due to oil-based transport. Passenger cars are the main mobile source of emissions of non-methane volatile organic compounds (NMVOCs), while heavy duty vehicles and ships dominate NOX and PM2.5 emissions from transport (Box 1.1).

In 2010, air emissions were below the ceilings imposed by the NEC Directive except in the case of NOX. According to national projections, Greece is on track to meet its 2020 and 2030 emission reduction commitments.
Maritime shipping is an important contributor to air pollution in Europe, particularly in port cities. While current regulations of the International Maritime Organization and the EU will cut SO2 emissions from international shipping up to 2030, without further controls they will grow again after 2030 and NOX emissions will exceed those from land-based sources in the EU.
Designating the Mediterranean Sea as an Emission Control Area (with stricter controls on emissions from ships, as in the Baltic and North seas) could cut emissions of SO2 from international shipping by 80% and of NOX by 20% by 2030, compared to the situation with current legislation.
The main emission control measures include reduction of the sulphur content of marine fuels, combustion process optimisation, exhaust gas cleaning and catalytic reduction systems. Connecting ships at berth to onshore power supply (cold ironing) can also help reduce NOX and PM emissions. In 2018, the port of Killini was the first cold ironing pilot in the eastern Mediterranean. An EU-funded project called ELEMED (for ELectrification of the Eastern MEDiterranean), involves two ports in Greece (Killini and Piraeus) and one each in Cyprus (Limassol) and Slovenia (Koper). It paves the way for wider implementation in Greece and elsewhere in the region.
Source: Cofala et al. (2018) ; www.elemedproject.eu.
Air quality
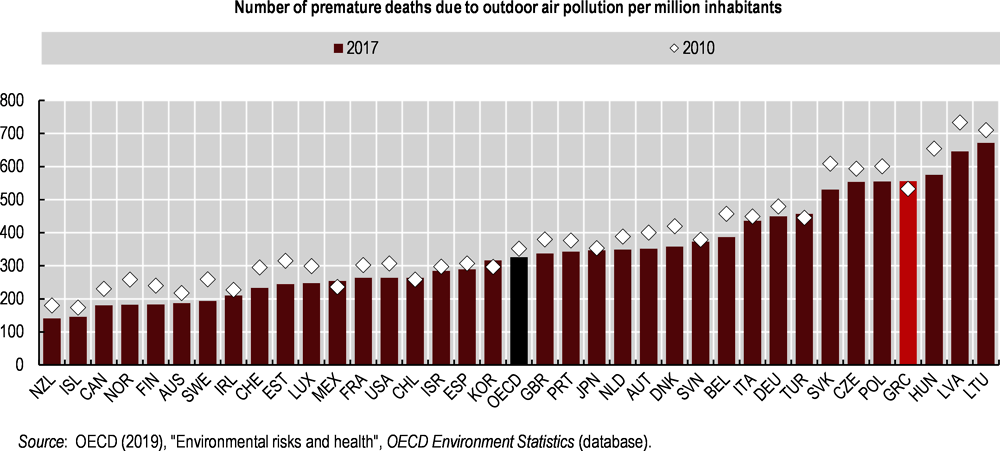
The Greek population is severely affected by air pollution. Athens and Thessaloniki are among the top 20% of most polluted metropolitan areas in OECD countries. Since the beginning of the decade, despite decreasing mean exposure to small particulates, the number of premature deaths attributable to ambient air pollution by PM2.5 and ozone have remained broadly constant, aside from weather-related variations (Figure 1.9). Using the value of a statistical life techniques, the welfare cost of the estimated 7 000 premature deaths was estimated at 6.7% of GDP in 2017, nearly twice the OECD average. Natural sources, such as Saharan dust, are a significant factor for particulate pollution, especially in southern Greece. Improving the air quality monitoring system would help in increasing the accuracy of exposure estimates and designing appropriate measures to reduce the health impact of air pollution (Klein et al., 2019).
In the past decade, concentrations of the main air pollutants have decreased with reduced economic and transport activity, scrapping of old vehicles and increased use of natural gas. However, higher heating oil prices have pushed households to switch from oil to wood for heating, causing severe winter episodes of PM pollution (Athanasopoulou, 2017[20]).
Progress in reducing urban air pollution has stalled since fuel consumption started to grow again in 2013. Concentrations of NO2, PM10, PM2.5 and benzene have stabilised or increased at some monitoring stations (MoEE, 2018b). In 2017, exceedances of EU air quality standards were recorded for NO2, PM10, benzene and benzo[a]pyrene (EEA, 2019a). The European Commission has opened infringement procedures against Greece for not complying with limit values for PM10 and NO2 and for failure to put in place adequate air quality monitoring in Thessaloniki.
Like other Mediterranean countries, Greece regularly records high levels of ozone concentrations, which are exacerbated in Athens by topography (basin surrounded by mountains) and meteorological conditions (temperature inversions, low wind speed, high temperature). In 2017, the EU target value of ozone concentrations was not met in many Greek locations.
1.3.1. Material productivity and waste
Key policy developments
Low resource productivity and recovery rates, high waste generation and fines paid for not respecting EU waste legislation make the case for a shift to a circular economy. In 2018, the government Economic Policy Council approved a National Circular Economy Strategy and two-year action plan, later extended to 2023. The long-term (2030) goals include moving up the waste hierarchy; promoting industrial symbiosis and business clusters; supporting consumption patterns of reusing and repairing rather than buying new products; enhancing partnerships across industry, academia and civil society; raising awareness; and monitoring progress through indicators. Short-term actions focus on making regulatory and legislative reforms (e.g. developing end-of-life criteria for specific waste streams, recycled materials and by-products; enabling food donations; promoting green public procurement; setting standards for reuse of construction waste and treated wastewater), mapping financing options (EU funds and tax incentives), enhancing knowledge and establishing a governance body to oversee implementation. The country also established a multi-stakeholder forum to promote circular economy business models and innovations.
The 2015 National Waste Management Plan (NWMP) and accompanying Waste Prevention Plan, along with 13 Regional Waste Management Plans and the 2016 National Hazardous Waste Management Plan, complement the framework to promote a circular economy. In addition, the 2017 Law on Recycling aligned existing legislation with circular economy principles.
The NWMP has set aims for 2020 of significantly reducing per capita waste generation, reaching 50% of municipal waste being prepared for reuse/recycling, using energy recovery as a supplementary treatment option when other recovery options are exhausted and limiting landfilling to less than 30% of municipal waste generated.
Material productivity
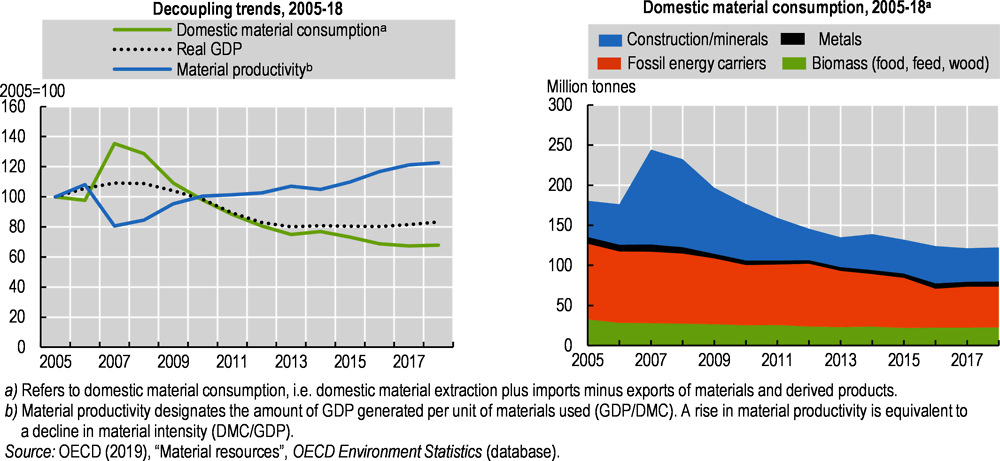
During the crisis, domestic material consumption (DMC)9 decreased faster than GDP as construction and coal extraction declined (Figure 1.10).
Material productivity improved as a result, though not enough to reach the OECD average. Per capita DMC, especially consumption of biomass and non-metallic minerals, is below the OECD Europe average, while consumption of fossil energy material remains high.
Waste management
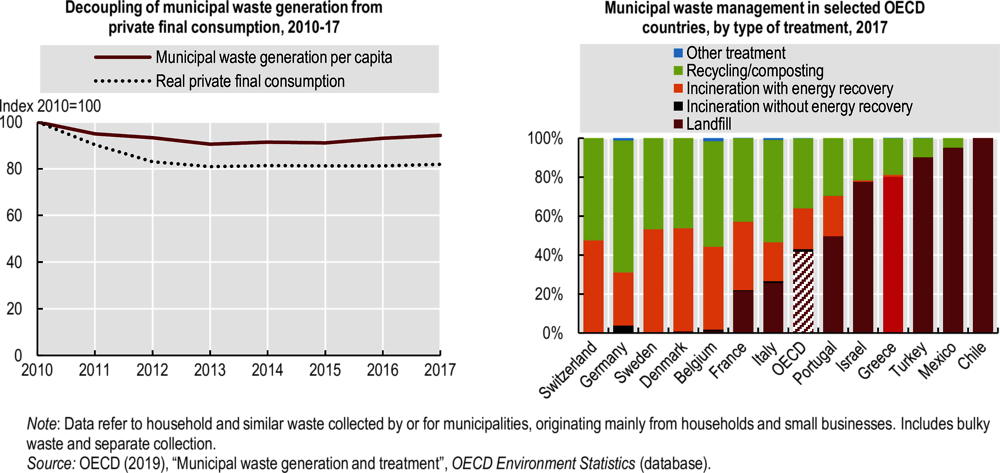
The latest State of the Environment report identifies waste management as the most challenging environmental area (NCESD, 2018). It is the main environmental field for EU infringement cases against Greece (Chapter 2). In 2017, municipal waste generation amounted to 512 kg per capita, above the OECD Europe average and relatively high given Greece’s low income levels, probably because of tourism. Since 2013, municipal waste generation has increased faster than private consumption. In 2017, 80% of the amount generated was sent to landfill, nearly twice the OECD average (Figure 1.11).
Greece is at risk of missing the 2020 target of 50% preparation for reuse/recycling of municipal waste set out in the Waste Framework Directive10 (EC, 2018c). It missed the Landfill Directive targets11 for reducing municipal biodegradable waste disposal and is unlikely to reach the NWMP target of recycling 40% of biowaste by 2020. Poor performance is due to lack of infrastructure for source separation of recyclables, notably biowaste, along with low public awareness, lack of financial incentives and the absence of relevant economic instruments.
Greece has made progress in expanding extended producer responsibility systems, which cover packaging waste; waste oils, tyres, batteries and accumulators; waste electrical and electronic equipment (WEEE), end-of-life vehicles; and construction and demolition waste. Despite decreasing collection rates and rising informal recycling during the recession, these systems have generally met their recycling and recovery targets, with the exception of packaging glass and some types of WEEE (HRA, 2019; Scheinberg, 2016). However, achieving more ambitious goals will be challenging. Such systems could be made more effective by improving monitoring and enforcement, clarifying roles between producer responsibility organisations and municipalities, supporting the latter’s efforts to fulfil their obligations, raising awareness and integrating informal recycling into the formal system.
Cheap landfilling and illegal disposal have discouraged recycling (EC, 2019). A 2012 landfill tax law was not implemented. It was replaced by a 2019 law providing for a landfill tax as part of a pricing policy based on regional and local waste management authorities’ performance in recovering and diverting waste from landfill. As this law applies from 2020, there is as yet no information on its outcomes. Waste collection charges are generally based on property size. There is thus room to develop “pay as you throw” systems as part of instruments to encourage people to reduce and sort waste. In a welcome step, Greece introduced a tax on single-use plastic bags in 2018 (EUR 0.4, rising to EUR 0.9 in 2019), which reduced their use by 85% in one year.
Greece has made important strides in closing illegal landfills. However, the remaining ones12 will be difficult to close unless new facilities are built. There are also gaps in implementing legal obligations regarding hazardous waste management. The reasons include data quality issues on generation and treatment, lack of infrastructure, the need to deal with historical waste and weak enforcement (BiPRO, 2017). Between 2014 and 2019, Greece paid EUR 85 million in fines for non-compliance with EU waste legislation.
1.3.2. Agricultural inputs
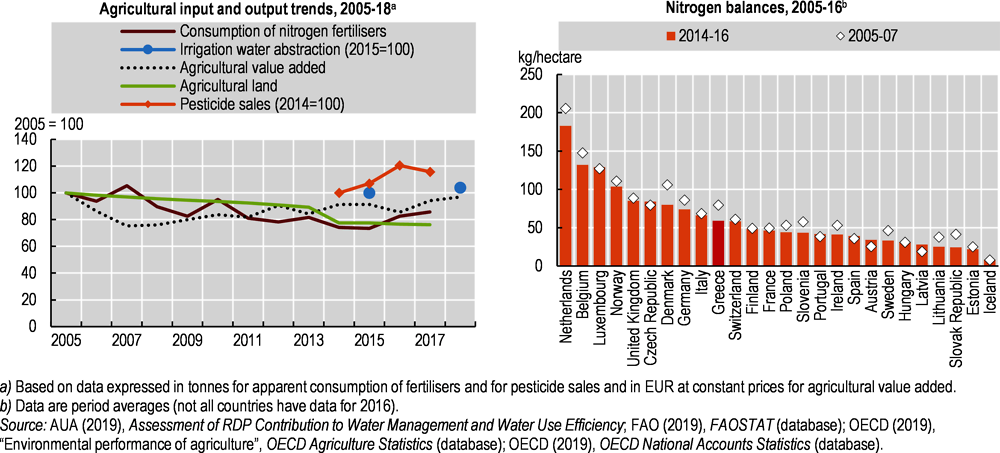
Over the past decade, nutrient surpluses have declined (Figure 1.12). However, fertiliser and pesticide use and agricultural water abstraction have increased in recent years while agricultural area has been reduced.
In 2013, Greece adopted a National Action Plan on Sustainable Use of Pesticides with measurable risk reduction targets (EC, 2017b). Most professional users have since been certified. The 2015 target of a 10% reduction in non-compliance with maximum pesticide residue limits was not achieved, partly due to more active substances being detected. The target of reducing acute poisoning incidents by 5% was achieved, but that of increasing the use of low-drift nozzles by 5% could not be monitored, as only 19% of pesticide application equipment had been inspected by early 201813 (Bourodimos et al., 2018). More than half of professional users dispose of empty pesticide packages in common waste bins, a further 12% do so without rinsing them, 19% burn or bury containers and less than 10% participate in collection/recycling programmes (MRDF, 2016).
Organic farming increased from 7% of the agricultural area in 2005 to 9% in 2018, above the 2017 OECD average of 7% (Chapter 5). Despite significant EU support, the share has grown less rapidly than in most countries.
1.4.1. Physical context and land use
Greece is located in southeastern Europe and shares borders with Albania, North Macedonia, Bulgaria and Turkey. Its topographic diversity, including mountains, a lengthy coastline and thousands of islands, contributes to its considerable biological wealth (Chapter 5). Agricultural land accounts for half the land area and is almost evenly divided between arable land and permanent crops, and permanent pasture (Basic statistics). Forests cover 32% and inland waters, including wetlands, represent 2%. The remainder is built-up areas and other land.
Although Greece’s artificial land coverage is below the EU average, the country has registered a shift from pasture and agricultural land to urban areas since 1990, resulting in habitat loss, degradation and fragmentation (Chapter 5). Construction of tourist facilities and secondary residences, in some cases without proper planning or building permits in coastal areas, has been a strong driver of continued urbanisation (Government of Greece, 2018). The motorway network has doubled over the past decade, exacerbating landscape fragmentation.
1.4.2. Biodiversity and ecosystems
Greece is of great importance to European and Mediterranean biodiversity, being home to abundant flora and fauna, including many endemic plant and animal species, and a wide variety of ecosystems (Chapter 5).
Habitat conservation status under the EU Habitats Directive has improved. Nearly two-thirds of habitats have favourable status. However, most coastal habitats are rated as unfavourable/inadequate and more than half of species as unfavourable. One in three freshwater fish species and one in four mammal and amphibian species are at risk of extinction.
The main causes of biodiversity loss in Greece are natural system modifications, including urbanisation and habitat fragmentation, pollution, invasive alien species, climate change and fires. Key pressures come from agriculture, fisheries, transport and tourism (especially coastal).
Progress has been made in expanding protected areas, which cover 32% of the terrestrial area and 20%14 of the territorial sea. Greece has thus largely achieved the 2020 Aichi target 11. Few protected areas have management plans.
1.4.3. Water resource management
As in other environmental areas, water policy is shaped by EU obligations. In 2017, Greece adopted its second round of River Basin Management Plans (RBMPs) under the Water Framework Directive (WFD) after a two-year delay (EC, 2019). In 2019, it adopted an action plan to protect waters against pollution caused by nitrates from agricultural sources for the 30 defined vulnerable areas.
Water resources
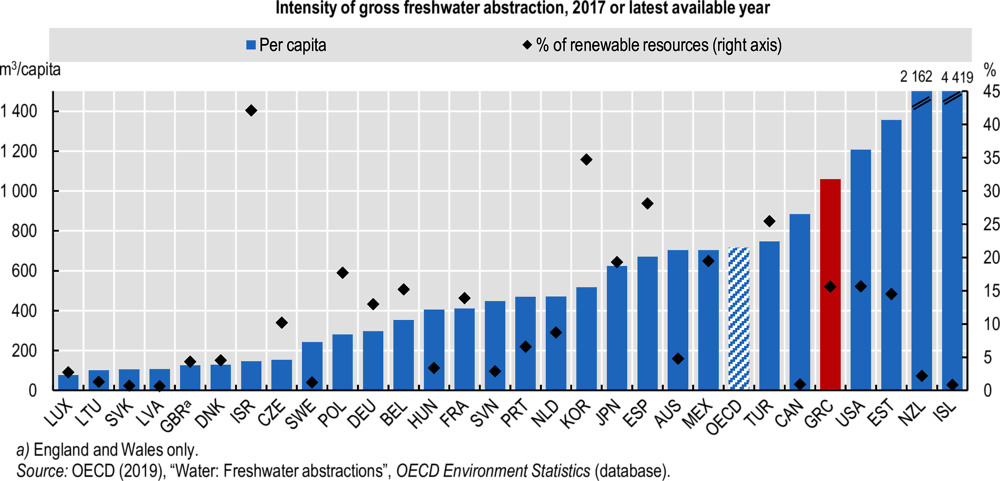
As Greece is more generously endowed with freshwater resources than other Mediterranean countries, freshwater resources are under only moderate stress at the national level despite high abstraction levels. However, spatial and seasonal distribution of water resources and use varies widely. Climate change is expected to increase pressure on water availability especially in in the regions of Attica, Central Macedonia, Thessaly, East Macedonia-Thrace and the South Aegean islands (MoEE, 2016).
Greece has one of the highest rates of water abstraction per capita in the OECD (Figure 1.13). Agriculture accounts for 80% of water abstraction, putting pressure on aquifers. Agricultural water use, mainly for irrigation, benefits from partial cost recovery and reduced electricity prices (Section 3.3.2), which encourage inefficient use of the resource (National Bank of Greece, 2015). Public water supply accounts for 17% of water abstraction. Owing to leakage in the distribution system, Greek consumers are among the largest consumers of drinking water in Europe. Greece has increasingly relied on desalination to reduce islands’ dependence on water delivered by tankers. Desalination capacity represents about 0.1% of the country’s renewable water resources (IRENA, 2015).
Water quality
The second RBMPs show that slightly more than 60% of surface water bodies have good or better ecological status, 30% did not achieve good status and the status of 9% is unknown. Coastal waters and rivers seem to have better status than lakes and transitional waters, whose status is mostly unknown. About 89% of surface water bodies (by number of water bodies) have good chemical status, while 2% fail to achieve good status. Groundwater quality is relatively high: 85% of groundwater bodies achieve good chemical status, with lower rates in Attica (67%), Eastern Peloponnese (74%) and the Aegean islands (76%), while 84% have good quantitative status, with lower rates in Thessaly (70%) and the Aegean islands (76%).
Greece established a national monitoring network for qualitative and quantitative water status, compliant with the WFD, in 2012 and a national water abstraction register in 2014. However, due to changes in monitoring methods, comparison of water status between the first and second RBMPs is not possible.
The first RBMPs identified diffuse pollution and agricultural abstraction as the main pressures on water (EC, 2018d). In addition to pollution by nutrients and pesticides, groundwater is threatened by salinisation caused by intensive groundwater pumping in coastal areas, leading to seawater intrusion. The RBMPs identified a range of measures to address pressures from agriculture, including regulatory changes and information improvement. However, it is unclear if these measures are sufficient. Water saving measures mostly focus on improving irrigation efficiency, but such technical approaches have been found ineffective in some instances (OECD, 2017). Under the Rural Development Programme, investment in irrigation infrastructure helped slightly reduce water abstraction per hectare of cultivated area between 2015 and 2018, though the volume abstracted for irrigation increased (AUA, 2019). Overall, the net effect of agri-environmental measures on water savings and quality would require a more detailed assessment.
Greece has high compliance rates with Drinking Water Directive requirements. Most bathing waters are of excellent quality (EEA, 2019b).
Public water supply, sanitation and sewage treatment
The majority of the population is connected to public water supply but service performance has room for improvement, particularly with regard to distribution leakage, which might create health hazards. The European Commission projects that nearly 6% of the Greek population could potentially suffer from health problems due to unsafe drinking water by 2050, a drop from about 7% in 2015 (EC, 2018e).
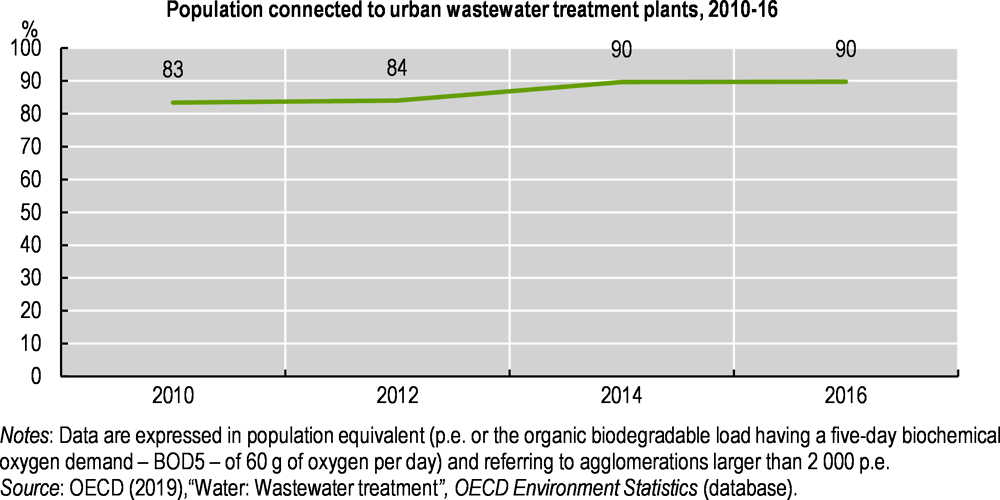
Greece has made progress in wastewater treatment in large agglomerations (Figure 1.14). However, a significant share of wastewater (10% of the generated load) is dealt with by individual systems which should be replaced by collecting systems and treatment plants where population density is high enough (EC, 2017c). Investment of around EUR 1.6 billion is needed to ensure that wastewater in agglomerations is properly collected and treated (EC, 2019).
Air quality
Swiftly adopt and implement the national air pollution control programme to comply with standards for protection of human health; further promote replacement of inefficient oil and biomass heating systems.
Further improve the air quality monitoring system and develop knowledge of the drivers of air pollution and its impact on health.
Waste and circular economy
Close and remediate the remaining illegal landfills without further delay.
Build treatment facilities for the main hazardous waste streams.
Improve the quality of waste statistics and the oversight of extended producer responsibility systems.
Extend separate collection of waste, including biowaste, by establishing minimum service standards. Expand the use of “pay as you throw” systems as part of instruments to encourage people to reduce waste. Ensure effective implementation of the new waste pricing policy.
Strengthen the institutional and policy framework to speed up the transition towards a circular economy by all economic sectors.
Swiftly establish a system for collection and safe disposal of empty pesticide containers and promote farmer education about pesticide risks. Develop an extended producer responsibility system for agricultural plastics.
Water management
Continue to improve water monitoring to build consistent time series of data on water abstraction and quality.
Complete the infrastructure for the collection and treatment of urban wastewater in line with the EU requirements.
Implement the action plan to protect water against pollution caused by nitrates from agricultural sources in all vulnerable areas.
Further assess the impact of agri-environmental measures on water and biodiversity to improve their design in Greece’s Strategic Plan under the Common Agricultural Policy 2021-27.
References
Athanasopoulou, E. (2017), “Changes in domestic heating fuel use in Greece: effects on atmospheric chemistry and radiation”, Atmospheric Chemistry and Physics, Vol. 17, pp. 10597-618, https://doi.org/10.5194/acp-17-10597-2017.
AUA (2019), Assessment of RDP contribution to water management and water use efficiency, Agricultural University of Athens, https://ead.gr/wp-content/uploads/2019/07/WATER_study_presentation-1.pdf.
Bank of Greece (2011), The Environmental, Economic and Social Impacts of Climate Change in Greece, Bank of Greece, Athens, www.bankofgreece.gr/BogEkdoseis/ClimateChange_FullReport_bm.pdf.
BiPRO (2017), Support to selected Member States in improving hazardous waste management based on assessment of Member States’ performance, BiPRO GmbH for European Commission, Brussels, http://ec.europa.eu/environment/waste/studies/pdf/20180227_Haz_Waste_Final_RepV5_clear.pdf.
Bourodimos, G. et al. (2018), “Inspection system for in use pesticide application equipment in Greece: First three years of application”, paper for the seventh European Workshop on Standardised Procedure for the Inspection of Sprayers (SPISE7), Athens, 26-28 September, https://ojs.openagrar.de/index.php/BerichteJKI/article/view/10333.
Cofala, J. et al. (2018), “The potential for cost-effective air emission reductions from international shipping through designation of further Emission Control Areas in EU waters with focus on the Mediterranean Sea”, IIASA Research Report, Laxenburg, Austria, http://pure.iiasa.ac.at/id/eprint/15729/1/RR-18-002.pdf.
EC (2019), The Environmental Implementation Review 2019: Country Report Greece, European Commission, Brussels, http://ec.europa.eu/environment/eir/pdf/report_el_en.pdf.
EC (2018a), The 2018 Ageing Report: Economic and Budgetary Projections for the EU Member States (2016-2070), European Commission, Directorate-General for Economic and Financial Affairs, Luxembourg, https://doi.org/10.2765/615631.
EC (2018b), EU Transport in figures 2018: Statistical pocketbook, European Commission, Luxembourg, https://publications.europa.eu/en/publication-detail/-/publication/52f721ed-c6b8-11e8-9424-01aa75ed71a1.
EC (2018c), Early warning report for Greece on the implementation of EU waste legislation, European Commission, Brussels, http://ec.europa.eu/environment/waste/pdf/early_warning_report_EL.pdf.
EC (2018d), “Report on the implementation of the Water Framework Directive River Basin Management Plans: Greece”, Commission Staff Working Document SWD(2015) 54 final/2, European Commission, Brussels, https://ec.europa.eu/environment/water/water-framework/pdf/4th_report/Greece_CORRECTED_5_EN_autre_document_travail_service_part1_v5-1_FINAL.pdf.
EC (2018e), “Impact Assessment, Accompanying the document Proposal for a Directive of the European Parliament and of the Council on the quality of water intended for human consumption (recast)”, Commission Staff Working Document SWD(2017) 449 final, European Commission, Brussels, https://ec.europa.eu/transparency/regdoc/rep/10102/2017/EN/SWD-2017-449-F1-EN-MAIN-PART-1.PDF.
EC (2017a), Assessing progress towards the EU energy efficiency targets using index decomposition analysis, European Commission, Luxembourg, https://doi.org/10.2760/675791.
EC (2017b), Overview report, Sustainable Use of Pesticides, European Commission, Luxembourg, https://doi.org/10.2875/604951.
EC (2017c), “Ninth Report on the implementation status and the programmes for implementation (asrequired by Article 17) of Council Directive 91/271/EEC concerning urban waste water treatment”, Commission Staff Working Document SWD(2017) 445 final, Part 1/2, European Commission, Brussels, https://ec.europa.eu/environment/water/water-urbanwaste/implementation/pdf/COMMISSION_STAFF_WORKING_DOCUMENT_part1.pdf.
EEA (2019a), “Attainments of air quality objectives (data flow G)”, Air Quality e-Reporting (database), http://aideg.apps.eea.europa.eu (accessed in November 2019).
EEA (2019b), European Bathing Water Quality in 2018, European Environment Agency, Copenhagen, https://doi.org/10.2800/997525.
Eurostat (2018), Demography and migration (database), https://ec.europa.eu/eurostat/tgm/table.do?tab=table&init=1&plugin=1&language=en&pcode=tps00019 (accessed in March 2019).
Government of Greece (2018), Voluntary National Review on the Implementation of the 2030 Agenda for Sustainable Development, General Secretariat of the Government, Office of Coordination, Institutional, International & European Affairs, Athens, https://sustainabledevelopment.un.org/content/documents/19378Greece_VNR_Greece_2018_pdf_FINAL_140618.pdf.
HRA (2019), Annual Report 2019, Hellenic Recycling Agency, Athens, www.eoan.gr/uploads/Programmatismos-EOAN-2019.pdf
IEA (2017), Energy Policies of IEA Countries: Greece 2017 Review, IEA/OECD Publishing, Paris, https://doi.org/10.1787/19900082.
INSETE (2019), The contribution of tourism to the Greek economy in 2018, www.insete.gr/Portals/0/meletes-INSETE/01/2019/2019_Tourism-Greek_Economy_2017-2018_EN.pdf (accessed in May 2019).
IRENA (2015), Renewable desalination: technology options for islands, Internation Renewable Energy Agency, Abu Dhabi, www.irena.org/publications/2015/Dec/Renewable-Desalination-Technology-Options-for-Islands.
Klein, K. et al. (2019), Transboundary air pollution by main pollutants (S, N, O3) and PM in 2017, Greece, MSC-W Data Note 1/2019, Norwegian Meteorological Institute (EMEP/MSC-W), Oslo, www.emep.int/publ/reports/2019/Country_Reports/report_GR.pdf.
MIT (2019), National Transport Plan for Greece, Final Transport Plan Report, Ministry of Infrastructure and Transport, Athens, www.nationaltransportplan.gr/wp-content/uploads/2019/06/Final_NTPG_en_20190624.pdf.
MoEE (2020), Long-term Strategy to 2050, January, Ministry of Environment and Energy, Athens, https://ec.europa.eu/clima/sites/lts/lts_gr_el.pdf.
MoEE (2019), National Energy and Climate Plan, December, Ministry of Environment and Energy, Athens, https://ec.europa.eu/energy/sites/ener/files/el_final_necp_main_en.pdf.
MoEE (2018a), 7th National Communication and 3rd Biennial Report under the United Nations Framework Convention on Climate Change, Ministry of Environment and Energy, Athens, http://unfccc.int/files/national_reports/annex_i_natcom_/application/pdf/48032915_greece-nc7-br3-1-nc7_greece.pdf.
MoEE (2018b), Annual report on air quality 2017, Ministry of Environment and Energy, Athens.
MoEE (2016), National Climate Change Adaptation Strategy, Ministry of Environment and Energy, Athens, www.bankofgreece.gr/BogDocumentEn/National_Adaptation_Strategy_Excerpts.pdf.
MRDF (2016), Results from Collected Data on the Occupational Use of Pesticides for the Year 2016, Ministry of Rural Development and Food, Athens, www.minagric.gr/images/stories/docs/agrotis/Georgika_Farmaka/StatisticsResultsSustUse2016.pdf (accessed in June 2019).
National Bank of Greece (2017), Survey of Greek SMEs: Land Logistics, National Bank of Greece, Athens, www.nbg.gr/english/the-group/press-office/e-spot/reports/Documents/SMEs_logistics_en.pdf.
National Bank of Greece (2015), Unlocking the potential of Greek agro-food industry, Sectoral report, National Bank of Greece, Athens, www.nbg.gr/greek/the-group/press-office/e-spot/reports/Documents/Sectoral%20Report_Agriculture%202015.pdf.
NCESD (2018), Greece State of the Environment Report: Summary, National Center for the Environment and Sustainable Development, Athens, https://ekpaa.ypeka.gr/wp-content/uploads/2019/10/Greece-State-of-the-Environment-Report-Summary-2018-English-Version_WEB.pdf.
OECD (2019a), OECD Economic Outlook, Vol. 2019, No. 2, OECD Publishing, Paris, https://doi.org/10.1787/9b89401b-en.
OECD (2019b), OECD Development Co-operation Peer Reviews: Greece 2019, OECD Publishing, Paris, https://doi.org/doi.org/10.1787/9789264311893-en.
OECD (2019c), “Biodiversity: Protected areas”, OECD Environment Statistics (database), https://doi.org/10.1787/5fa661ce-en (accessed in June 2019).
OECD (2018a), OECD Economic Surveys: Greece 2018, OECD Publishing, Paris, https://doi.org/dx.doi.org/10.1787/eco_surveys-grc-2018-en.
OECD (2018b), OECD Regions and Cities at a Glance 2018, OECD Publishing, Paris, https://doi.org/10.1787/reg_cit_glance-2018-en.
OECD (2017), Water Risk Hotspots for Agriculture, OECD Studies on Water, OECD Publishing, Paris, https://doi.org/10.1787/9789264279551-en.
Scheinberg, A. et al. (2016), “From collision to collaboration – Integrating informal recyclers and re-use operators in Europe: A review”, Waste Management & Research, Vol. 34, pp.820-39, https://doi.org/10.1177/0734242X16657608.
Notes
← 1. Between 2010 and 2018, Greece received EUR 288.7 billion in loans from its European partners (EUR 256.6 billion) and the International Monetary Fund (EUR 32.1 billion) that were conditional on implementation of comprehensive reform programmes.
← 2. Mining, manufacturing, energy and water.
← 3. Despite its low crude oil production, Greece has significant refining capacity and thus is a net exporter of oil products.
← 4. The ratio of people aged 65 or older to the working age population.
← 5. An EU-wide cap is in place to reduce emissions in EU ETS sectors by 21% from the 2005 level by 2020 and by 43% by 2030.
← 6. The annual level of tonne-kilometres performed per truck is low and the share of vehicle-kilometres travelled by empty vehicles is high.
← 7. The others are delivering economic growth and efficiency, improving transport connectivity, providing accessibility and social inclusion, and maintaining a safe and secure transport system.
← 8. The programme was due by April 2019, according to 2016/2284/EU.
← 9. The sum of domestic raw material extraction used by an economy and its physical trade balance (imports minus exports of raw materials and manufactured products).
← 10. The Waste Framework Directive sets out four alternative calculation methods to verify compliance with the target. According to the method chosen by Greece, the “preparation for reuse and recycling” rate was 31% in 2017.
← 11. Greece has benefited from a four-year derogation to comply with the Landfill Directive. By 2010, biodegradable municipal waste going to landfill was to have been reduced to 75% of the total amount of biodegradable municipal waste generated in 1995. The share was required to be reduced to 50% by 2013 and 35% by 2020.
← 12. As of mid-2018, 14 illegal landfills were still in use, 24 sites were not in use but had not been restored, and 19 had been restored but not fully closed in accordance with the legal framework.
← 13. All equipment should have been tested by 2016 under the Sustainable Use of Pesticides Directive (2009/128/EC).
← 14. Using harmonised international data for the denominator, the percentage of marine protected areas in Greece is less than 5% (OECD 2019c).