copy the linklink copied!New Zealand
GDP per capita is a quarter below the average of the most advanced OECD countries, reflecting an even larger shortfall in labour productivity. The GDP per capita and labour productivity gaps have been fairly stable over the past decade. The employment rate is relatively high and has been increasing since 2012.
Income inequality is higher than the OECD average and has increased since 2012. Greenhouse gas emissions per capita are higher than the OECD average and have edged up since 2012. Exposure to air pollution is very low.
Measures to increase the supply of affordable and social housing have been introduced and public transit projects have been expanded to enhance housing affordability and reduce congestion. The government has appointed a taskforce to make recommendations to improve efficiency and equity in schools.
Making the FDI screening process more transparent could help integrate domestic firms in global supply chains. Reducing regulatory and infrastructure barriers to housing densification would enhance affordability and reduce congestion. Further increasing the supply of affordable and social housing and increasing transfers to low-income families would reduce child poverty, enhancing equality of opportunities. Enhancing school board skills in disadvantaged areas would help to improve education outcomes and equity. Expanding training to reduce teacher bias would improve Māori and Pasifika achievement. Increasing the R&D tax credit and making it refundable would help boost innovation.
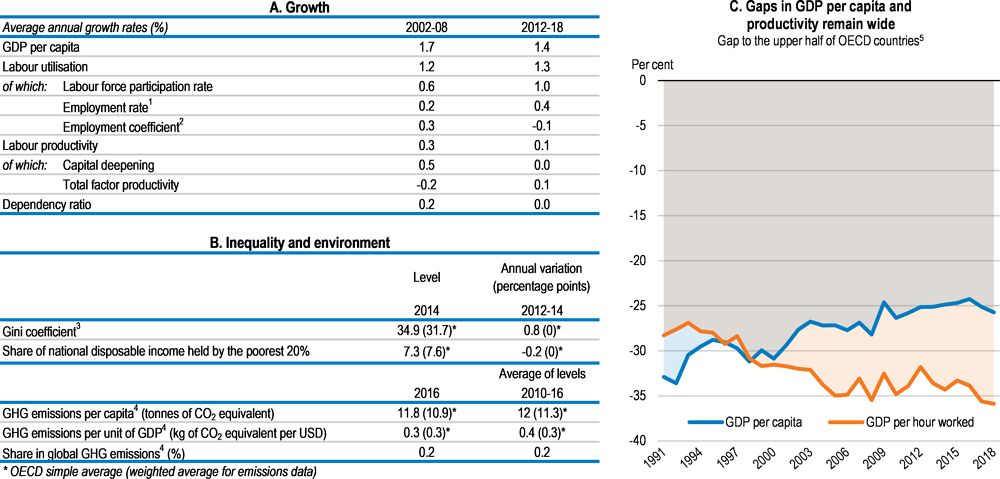
Source: Panel A: OECD, Economic Outlook Database; Panel B: OECD, Income Distribution and National Accounts Databases; United Nations Framework Convention on Climate Change (UNFCCC) Database and International Energy Agency (IEA), Energy Database; Panel C: OECD, National Accounts and Productivity Databases.
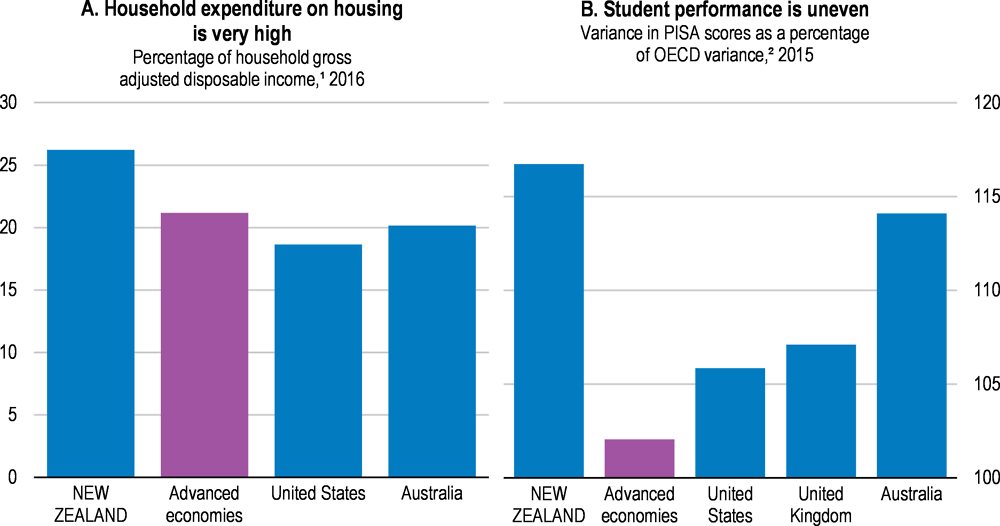
Source: Panel A: OECD, Better Life Index 2019; Panel B: OECD, PISA Database.
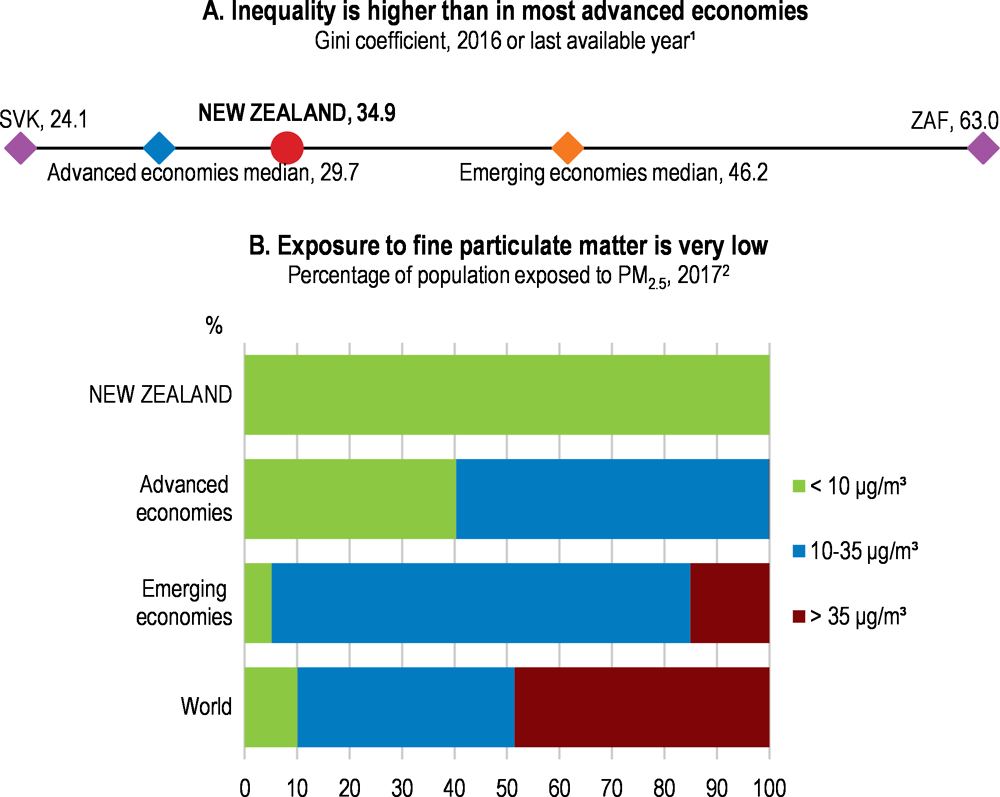
Source: Panel A: OECD, Income Distribution Database, World Bank, World Development Indicators Database and China National Bureau of Statistics; Panel B: OECD, Environment Database.
Note: For the explanation of the sets of indicators above, please go to the metadata annex at the end of this chapter.
New Zealand: Going for Growth 2019 priorities
Reduce barriers to FDI and trade and to competition in network sectors. Non-transparent screening, barriers to trade facilitation and competition in network sectors deter investment and hinder the competitiveness of downstream firms.
-
Actions taken: No action taken.
-
Recommendations: Ease FDI screening requirements, clarify criteria for meeting the net national benefit test and remove ministerial discretion in their application. Encourage more extensive use of advance rulings on imports. Sell remaining government shareholdings in electricity generators and Air New Zealand. Subject airports to price regulation.
Improve housing policies. Restrictive land-use policies reduce housing supply responsiveness to demand, accentuating price increases when demand rises.
-
Actions taken: Further large urban transport projects have been launched in 2018, supporting greater densification, and road fuel taxes have been increased to help pay for it. The government has started building affordable houses for re-sale and increasing the supply of social housing. Foreign demand for residential property has been curtailed since the entry into force in October 2018 of a law prohibiting the purchase of existing residential property by foreigners other than Australians and Singaporeans.
-
Recommendations: Adopt different regulatory approaches for the natural and built environments. Make the planning system more responsive in the provision of key infrastructure. Implement road pricing to reduce urban congestion and diversify urban infrastructure funding sources. Ensure that restrictions on foreign ownership do not hinder property development. Extend the holding period during which capital gains on residential property (other than the principal residence) are taxed from two to five years.
1Reduce child poverty. Child poverty is higher than in the top performing countries. It has adverse effects on children’s health and development.
-
Recommendations: Build on The Families Package, which is estimated to reduce the child poverty rate (50% median income poverty line) from 13% to 8% by 2020/21, by further increasing low incomes to achieve the government’s child poverty targets (including 5% on the above measure and 10% after housing costs) and expanding the supply of social housing. Enact legislation requiring governments to set targets for reductions in child poverty and report annually on progress.
Reduce educational underachievement among specific groups. Students from Māori, Pasifika and vulnerable socio-economic backgrounds have much poorer education outcomes than others.
-
Actions taken: The government appointed a taskforce in April 2018 to recommend reforms to enhance efficiency and equity in the education system.
-
Recommendations: Improve the quality of board oversight in schools with high concentrations of students from disadvantaged backgrounds. Expand training to reduce teacher bias entailing low expectations for Māori and Pasifika achievement. Better target early childhood education on groups with low participation and improve quality. To improve the school-to-work transition, enhance the quality of teaching, careers advice and pathways. Facilitate participation of disadvantaged youth in training and apprenticeships.
Raise effectiveness of R&D support. Relatively low public funding of business R&D contributes to below average R&D intensity.
-
Actions taken: The government announced that R&D growth grants (20% of eligible expenditure) will be replaced by an R&D tax credit (12.5% of eligible expenditure, compared with tax offsets of 38.5-43.5% in Australia) from April 2019, leaving expected budget costs broadly unchanged.
-
Recommendations: Further boost support for business R&D investment, notably by increasing the R&D tax credit to a more internationally competitive rate, to help lift R&D expenditure to the 2% of GDP target by 2027. Make the tax credit refundable so that firms that are not yet profitable can benefit. Evaluate remaining grant programmes. Co-ordinate immigration and education policies with business skills needs for innovation.
Note
← 1. New policy priorities identified in Going for Growth 2019 (with respect to Going for Growth 2017). No action can be reported for new priorities.
Metadata, Legal and Rights
https://doi.org/10.1787/aec5b059-en
© OECD 2019
The use of this work, whether digital or print, is governed by the Terms and Conditions to be found at http://www.oecd.org/termsandconditions.