.jpg?a4384ad645a7284c15259ce80248ac2e)
Indicator C4. What is the total public spending on education?
Total public spending on primary to tertiary education as a percentage of total government expenditure averages 11% across OECD countries, ranging from around 7% to 17%.
Between 2012 and 2018, the proportion of government expenditure devoted to primary to tertiary education slightly decreased on average across OECD countries (1%). However, this share increased over the same period in half of OECD and partner countries and most notably in the Czech Republic and Greece, where it rose by more than 12%. Nevertheless, in many countries, increases in educational expenditure did not keep pace with the growth in government expenditure overall.
Spending on non-tertiary education (primary, secondary and post-secondary non-tertiary levels) is mostly decentralised, with 56% of final funds (after transfers between levels of government) managed by regional and local governments. In contrast, spending at tertiary level is more centralised, with only 13% of final public funds sourced from the regional and local levels.
Context
Public expenditure enables governments to serve a wide range of purposes, including providing education and health care and maintaining public order and safety. Decisions concerning budget allocations to different sectors depend on countries’ priorities and the options for private provision of these services. Education is one area in which all governments intervene to fund or direct the provision of services. As there is no guarantee that markets will provide equal access to educational opportunities, government funding of educational services is necessary to ensure that education is not beyond the reach of some members of society.
Policy choices or external shocks, such as demographic changes or economic trends, can have an influence on how public funds are spent. Like the financial crisis in 2008, the COVID-19 pandemic is likely to significantly impact societies economically, and education is one of the sectors affected. Past economic crises have put pressure on public budgets, resulting in less public funding being allocated to education in some countries. Budget cuts can represent improved allocation of government funds and may generate gains in efficiency and economic dynamism, but they can also affect the quality of government-provided education, particularly at a time when investment in education is important to support learning adquisition and economic growth.
This indicator compares total public spending on education with total government expenditure across OECD and partner countries. This indicates the priority placed on education relative to other public areas of investment, such as health care, social security, defence and security. It also includes data on the different sources of public funding in education (central, regional and local governments) and on transfers of funds between these levels of government. Finally, it also covers how public expenditure has changed over time.
Other findings
In 2018, public transfers and payments to the non-educational private sector for primary to tertiary education represented on average less than 1% of total government expenditure. These public-to-private transfers represent 8% of public expenditure on education, with the remaining 92% consisting of direct public expenditure on education.
Governments in OECD countries spend almost three times as much on non-tertiary education (primary, secondary and post-secondary non-tertiary levels) as they do on tertiary education, mainly as a result of near-universal enrolment at lower levels.
The transfers of public funds from central to regional and local levels of government is larger at primary, secondary and post-secondary non-tertiary level than at tertiary level. At non-tertiary levels, 42% of public funds come from local sources after transfers between levels of government, compared to 26% before transfers. At tertiary level, local sources represent around 1% of public funds, before and after transfers between levels of government.
Overall level of public resources invested in education
The share of total public expenditure devoted to education varies across countries. In 2018, total public expenditure on primary to tertiary education as a percentage of total government expenditure for all services averaged 11% in OECD countries. However, this share varies across OECD and partner countries, ranging from around 7% in Greece to around 17% in Chile (Table C4.1 and Figure C4.1).
Overall, significant government funding was devoted to non-tertiary levels of education in 2018. In most countries, and on average across OECD countries, roughly three-quarters of total public expenditure on primary to tertiary education (about 8% of total government expenditure) was devoted to non-tertiary education (Table C4.1). This is largely explained by the near-universal enrolment rates at non-tertiary levels of education (see Indicator B1), the demographic structure of the population and the fact that in OECD countries, on average, the funding structure for tertiary education depends more on private funding sources than it does for non-tertiary levels (primary, secondary and post-secondary non-tertiary levels).
In 2018, the share of total public expenditure devoted to tertiary education varied widely among countries. On average across OECD countries, total public expenditure on tertiary education amounted to 27% of total public expenditure on primary to tertiary education. Across OECD and partner countries, the share ranges from below 15% in Luxembourg to over 35% in Austria, Denmark and Turkey where expenditure on research and development (R&D) represents a significant share (Table C4.1).
Total public expenditure on education includes direct expenditure on institutions (such as the operating costs of public schools), transfers to the non-educational private sector that are attributable to educational institutions and public subsidies to households for living costs that are not spent in educational institutions. Public transfers and payments to the non-educational private sector for primary to tertiary education (such as public student loans, grants, scholarships and subsidies to private student loans) represent a small share of total government expenditure in OECD and partner countries, but significant differences are observed across countries (Figure C4.1). In 2018, on average across OECD countries, this public expenditure represented less than 1% of total government expenditure and 8% of public expenditure on education, with the remaining 92% corresponding to direct public expenditure on education. However, the percentage varies by country: public transfers and payments to the non-educational private sector represent 2% or more of total government expenditure in Denmark, the Netherlands and the United Kingdom and less than 0.3% in Argentina, the Czech Republic, Estonia, Greece, Hungary, Luxembourg and the Russian Federation (Figure C4.1).
When public expenditure on education is considered as a proportion of total government expenditure, the relative sizes of public budgets must be taken into account. Indeed, the share of total government expenditure as a proportion of gross domestic product (GDP) varies greatly among countries (Table C4.1 – web columns). In 2018, about one-in-ten countries with available data reported that total government expenditure on all services accounted for more than 50% of GDP. A high share of total government expenditure devoted to public expenditure on education does not necessarily translate into a high share relative to a country’s GDP. For example, Korea allocates 13% of its total government expenditure on primary to tertiary education (more than the OECD average of 11%), but total public expenditure on education as a share of GDP is relatively low (4.1% compared to the OECD average of 4.4%). This can be explained by Korea’s relatively low total government expenditure as a share of GDP (31%) (Table C4.1 – web columns).
The economic crisis associated with the COVID-19 pandemic has affected the availability of public funding for education in OECD and partner countries. While the longer term impact on education funding is still uncertain, some countries have implemented immediate financial measures to support students and education systems to cope with the disruptions and economic impact of school and university closures (OECD, 2021[1])
Trends in public expenditure on education as a percentage of total government expenditure, 2012-18
Between 2012 and 2018, the proportion of government expenditure devoted to public expenditure on primary to tertiary education slightly decreased across OECD countries (1%). This was the result of an increase of 10% on the total public spending on primary to tertiary education compared with a higher increase in the total government expenditure over the same period (12%) (Table C4.3).
Despite this decrease at aggregate level, in half of the OECD and partner countries with available data for both years, this share increased between 2012 and 2018, with the Czech Republic and Greece showing the greatest increase (over 12%). In the remaining countries, the increase in public expenditure on education was smaller than the increase in government spending overall. The most notable examples are Costa Rica, Latvia and Turkey, where the relative increase in total government expenditure was at least 10 percentage points higher than the increase in public expenditure on education (Table C4.3).
On average across OECD countries, a similar pattern is observed when looking at dissaggregated education levels. However, significant differences are observed when looking at the evolution of public expenditure across countries. Between 2012 and 2018, the increase in total public expenditure on education was larger than the increase in total government expenditure in around one-fourth of OECD and partner countries with available data. Decisions on public spending varied across education levels and countries. Among countries where public expenditure on education increased more than government expenditure between 2012 and 2018, Hungary displayed the highest growth in both non-tertiary and tertiary levels of education (around or above 26%). In contrast, other countries prioritised public funding growth to specific education levels. For example, public spending on tertiary education increased more than total government spending over this period in Brazil, Chile, Estonia, Switzerland and the United Kingdom whereas public spending at pre-tertiary level grew at a lower rate and even declined in Brazil. In contrast, growth in public spending on pre-tertiary education was higher than total government expenditure in Iceland, Israel, the Russian Federation, the Slovak Rebublic, Slovenia, Sweden and the United States, while public investment at tertiary level increased at a lower rate than government spending or declined slightly over this period.
Sources of public funding invested in education
The division of responsibility for education funding between levels of government (central, regional and local) is an important factor in education policy. Indeed, important decisions regarding education funding are taken at both the initial level of government, where the funds originate, and at the final level of government, where they are ultimately spent. At the initial level, decisions are taken about how much funding should be allocated and any restrictions on how that money can be spent. At the final level of government, additional restrictions may be attached to the funds, or this level of government may even pay directly for educational resources (e.g. teachers’ salaries). However, independently of the division of the funding responsibilities between levels of government, public expenditure might be allocated differently across education levels (Box C4.1).
Education funding may be centralised or decentralisedwith funds transferred between levels of government. Complete centralisation can cause delays in decision making. Decisions that are far removed from those affected can also fail to address changes in local needs and desired practices. Under complete decentralisation, however, units of government may differ in the level of educational resources they spend on students, either due to differences in priorities related to education or to differences in their ability to raise funding for education. Wide variations in education standards and resources can also lead to unequal educational opportunities and insufficient attention being paid to long-term national requirements.
In recent years, many schools have become more autonomous and decentralised, as well as more accountable to students, parents and the wider public for their outcomes. The results of the OECD Programme for International Student Assessment (PISA) suggest that when autonomy and accountability are intelligently combined, they tend to be associated with better student performance (OECD, 2016[3]).
National governments make key decisions in the proportion of financial resources devoted to education, which impacts economic and social development. Economic theory predicts that increasing public expenditure on education will lead to an increase in the economic growth rate due to higher levels of schooling and a better quality workforce. In terms of equity, public spending also has an effect on individuals’ future income (see Indicator A5) and can reduce poverty rates.
Policy makers have to balance the importance of improving the quality of educational services with the desirability of expanding access to educational opportunities. The public resources devoted to education are generally allocated based on the funding formula approach (see Indicator D6 and OECD (2017[4])), and the number of students is one of the factors that influence the resources devoted to education. Indeed, the funding formula approach relies on a mathematical formula taking into account four main groups of variables: 1) student numbers and grade levels; 2) needs; 3) curriculum or educational programmes; and 4) school characteristics. Therefore, the proportion of students participating in different levels of education is an important element for policy makers. Variations in these proportions might reflect differences in the demand for these education services and therefore the need to adjust public funds across education levels.
Relative measures such as the location quotient (LQ) can help quantify the concentration levels of students across education levels in comparison to the proportion of public financial resources devoted to each. This measure can help policy makers assess whether sufficient resources are allocated to each level of education based on the share of students participating in them. The location quotient is equal to 1 when the percentage of students in a particular education level is equal to the proportion of resources devoted to it. Indexes over 1 indicate that the proportion of resources devoted to that level of education are over-represented; indexes under 1 indicate that the proportion of resources devoted to it are under-represented.
This analysis clearly shows that some OECD countries emphasise broad access to tertiary education, while others invest in near-universal education for children. On average, primary education seems to be slightly underfunded compared to the share of students enrolled at this level. In 2018, the LQ was 0.92 at this level, significantly lower than at higher education levels. Indeed, the LQ reaches 1.07 at tertiary level on average across all OECD countries.
The way resources are allocated across the different levels of education varies widely across countries. While countries such as Australia, Greece, Korea, Latvia and Lithuania devote a larger share of public funds to education compared to the proportion of students in pre-tertiary levels, the opposite is observed in the majority of other countries where a disproportionate share of resources (after excluding research and development expenditure) are devoted to tertiary education levels. This is particularly striking in countries such as Denmark where generous student grants are provided to tertiary students, but also in Mexico, New Zealand, Turkey and the United Kingdom, where the share of public expenditure at tertiary level is at least 1.4 times higher than the share of national students enrolled. The demand for high-quality education must also be balanced against other demands on public expenditure and the overall burden of taxation.
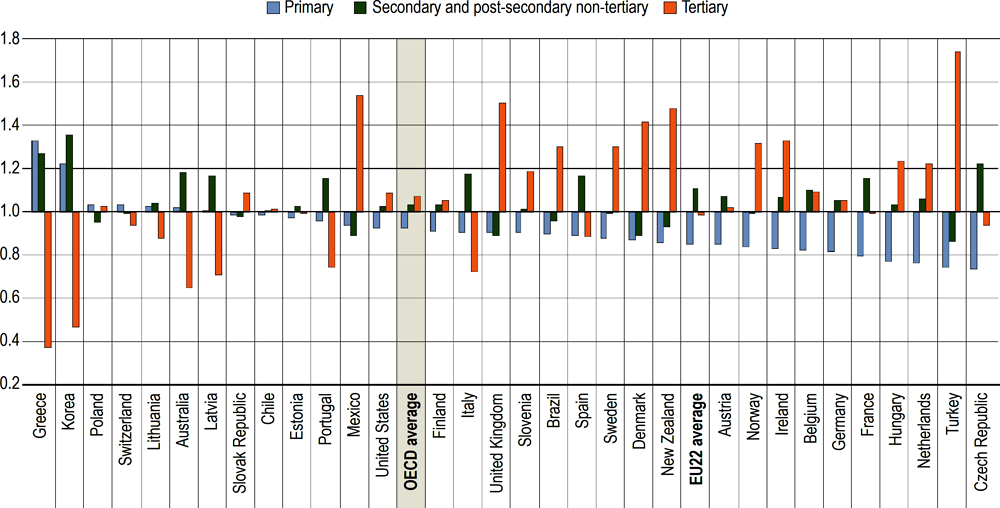
Note: Public expenditure on research and development has been excluded from the public expenditure figures presented here. The relative share is computed using the location quotient, which is defined as a ratio of ratios. The location quotient is a simple descriptive statistic measuring the extent to which government expenditure on education in a given ISCED level is distributed in accordance with the distribution of the full-time equivalent students in a country. The formula is LQ= ((Xi/∑Xi)/(Ni/∑Ni)), where LQ is the location quotient, Xi is the public expenditure on education in an ISCED level i, ∑Xi is the total public expenditure on education in all ISCED levels combined, Ni is the total of students in an ISCED level i, and ∑Ni is the total number of students in all ISCED combined. An LQ=1 indicates that there is the same proportion of public expenditure on education as total full-time equivalent students in an ISCED level i. If LQ<1, the ISCED level has a lower distribution of public expenditure on education in comparison to the full-time equivalent students. If LQ>1, the ISCED level has a higher distribution of public expenditure on education than it does in terms of students.
Countries are ranked in descending order of the LQ index in primary education.
Source: OECD/UIS/Eurostat (2021), based on data available on OECD.stat. See Source section for more information and Annex 3 for notes (https://www.oecd.org/education/education-at-a-glance/EAG2021_Annex3_ChapterC.pdf).
The levels of government responsible for funding education differ depending on the level of education. Typically, public funding is more centralised at the tertiary level than at lower levels of education. In 2018, on average across OECD countries, 59% of the public funds for non-tertiary education came from the central government before transfers to the various levels of government, compared to 88% of the funds for tertiary education (Table C4.2).
The division of responsibility for public funding in non-tertiary levels of education varies greatly among countries (Table C4.2 and Figure C4.4):
On average, central and regional governments are the main initial and final sources of funds in non-tertiary education. However, the central government is the only main initial source of funds and the only final purchaser of educational services in Costa Rica, Ireland and New Zealand. In countries such as Chile, Colombia, France, Greece, Hungary, Israel, Italy, Luxembourg, the Netherlands, Portugal, Slovenia, Turkey and the United Kingdom, the central government is the source of the majority of initial funds and the main final purchaser of educational goods and services.
In Austria, Estonia, Korea, Latvia, Lithuania, Mexico, Poland and the Slovak Republic, the central government is the main initial source of funds, but regional and local authorities are the main final purchasers of educational services in non-tertiary education.
Regional governments are both the main initial source and the main final spender of education funds in Australia, Belgium, the Czech Republic, Germany, the Russian Federation, Spain and Switzerland. In Canada and Japan, regional governments are the predominant source of initial funds, but local authorities are the main final purchasers of educational services.
In Denmark, Finland, Iceland, Norway and Sweden, local authorities are both the main initial source of funds and the main final purchasers of educational services. In the United States, both regional and local governments are the main initial sources of funds, but local governments are the main final purchasers.
On average across OECD countries, more funds are transferred from central to regional and local levels of government for non-tertiary education than for tertiary education. This extends the scope for decentralisation at non-tertiary levels of education. On average across OECD countries, the share of public funds for non-tertiary education provided by the central government falls from 59% to 44% after transfers to other levels of government have been accounted for, while the share of local funds rises as a result, from 26% to 42%. There is a great deal of variation in the sources of funds before and after transfers from central to lower levels of government. In Korea, Lithuania, Mexico, Poland and the Slovak Republic, the difference is more than 50 percentage points after transfers to regional and local governments. In Australia, Austria, Chile and Estonia, the difference is between 25 and 40 percentage points. In Canada and the United States, where the regional level is mostly responsible for transferring funds to schools, the share of regional funding falls by 40 percentage points or more after transfers to local levels of government (Table C4.2 and Figure C4.4).
Tertiary education is much more centralised than non-tertiary education, as the proportion of public funds coming from the central government is relatively large, both before and after transfers to lower levels of government (Table C4.2). On average across the OECD, the central government manages 88% of funds before transfers, and this barely changes once intergovernmental transfers are taken into account. In most OECD and partner countries with available data, central government directly provides more than 60% of public funds in tertiary education; in about two-thirds of countries, the central government is the main source of initial funding and there are no or small transfers to regional or local governments. In contrast, countries such as Belgium, Germany, Spain and Switzerland source over 60% of tertiary-level funding from regional governments with little or nothing transferred down to local governments. Local authorities typically do not have an important role in financing tertiary education, representing only 1% of public funds on average, with the exception of the United States where local governments provide 12% of total expenditure to the level.
Intergovernmental transfers are transfers of funds designated for education from one level of government to another. They are defined as net transfers from a higher to a lower level of government. Initial funds refer to the funds before transfers between levels of government, while final funds refer to the funds after such transfers.
Public expenditure on education covers expenditure on educational institutions and expenditure outside educational institutions such as support for students’ living costs and other private expenditure outside institutions, in contrast to Indicators C1, C2 and C3, which focus only on spending on educational institutions. Public expenditure on education includes expenditure by all public entities, including the education ministry and other ministries, local and regional governments, and other public agencies. OECD countries differ in the ways in which they use public money for education. Public funds may flow directly to institutions or may be channelled to institutions via government programmes or via households. Public funds may be restricted to the purchase of educational services or may be used to support students’ living costs.
All government sources of expenditure on education, apart from international sources, can be classified under three levels of government: 1) central (national) government; 2) regional government (province, state, Bundesland, etc.); and 3) local government (municipality, district, commune, etc.). The terms “regional” and “local” apply to governments with responsibilities exercised within certain geographical subdivisions of a country. They do not apply to government bodies with roles defined in terms of responsibility for particular services, functions or categories of students that are not geographically circumscribed.
Total government expenditure corresponds to non-repayable current and capital expenditure on all functions (including education) of all levels of government (central, regional and local), including non-market producers (e.g. providing goods and services free of charge, or at prices that are not economically significant) that are controlled by government units, and social security funds. It does not include expenditure derived from public corporations, such as publicly owned banks, harbours or airports. It includes direct public expenditure on educational institutions (as defined above), as well as public support to households (e.g. scholarships and loans to students for tuition fees and student living costs) and to other private entities for education (e.g. subsidies to companies or labour organisations that operate apprenticeship programmes).
Figures for total government expenditure and GDP have been taken from the OECD National Accounts Statistics Database (see Annex 2).
Public expenditure on education is expressed as a percentage of a country’s total government expenditure. The statistical concept of total government expenditure by function is defined by the National Accounts’ Classification of the Functions of Government (COFOG). There are strong links between the COFOG classification and the UNESCO, OECD and Eurostat (UOE) data collection, although the underlying statistical concepts differ to some extent (Eurostat, 2011[5]).
Expenditure on debt servicing (e.g. interest payments) is included in total government expenditure, but it is excluded from public expenditure on education, because some countries cannot separate interest payments for education from those for other services. This means that public expenditure on education as a percentage of total government expenditure may be underestimated in countries in which interest payments represent a large proportion of total government expenditure on all services.
For more information, please see the OECD Handbook for Internationally Comparative Education Statistics 2018 (OECD, 2018[6]) and Annex 3 for country-specific notes (https://www.oecd.org/education/education-at-a-glance/EAG2021_Annex3_ChapterC.pdf).
Data refer to the financial year 2018 (unless otherwise specified) and are based on the UNESCO, OECD and Eurostat (UOE) data collection on education statistics administered by the OECD in 2020 (for details see Annex 3 at: https://www.oecd.org/education/education-at-a-glance/EAG2021_Annex3_ChapterC.pdf). Data from Argentina, the People’s Republic of China, India, Indonesia, Saudi Arabia and South Africa are from the UNESCO Institute of Statistics (UIS).
The data on expenditure for 2012-18 were updated based on a survey in 2020-21, and expenditure figures for 2012-18 were adjusted to the methods and definitions used in the current UOE data collection.
References
[5] Eurostat (2011), “Manual on sources and methods for the compilation of COFOG statistics”, Methodologies and Working Papers, European Commission, Luxembourg, https://doi.org/10.2785/16355.
[1] OECD (2021), The state of global education – 18 months into the pandemic, OECD Publishing, Paris, https://doi.org/10.1787/1a23bb23-en.
[2] OECD (2021), The State of School Education: One Year into the COVID Pandemic, OECD Publishing, Paris, https://doi.org/10.1787/201dde84-en.
[6] OECD (2018), OECD Handbook for Internationally Comparative Education Statistics 2018: Concepts, Standards, Definitions and Classifications, OECD Publishing, Paris, https://doi.org/10.1787/9789264304444-en.
[4] OECD (2017), The Funding of School Education: Connecting Resources and Learniing, OECD Publishing, Paris, https://doi.org/10.1787/9789264276147-en.
[3] OECD (2016), PISA 2015 Results (Volume II): Policies and Practices for Successful Schools, PISA, OECD Publishing, Paris, https://dx.doi.org/10.1787/9789264267510-en.
Cut-off date for the data: 17 June 2021. Any updates on data can be found on line at: https://doi.org/10.1787/eag-data-en. More breakdowns can also be found at: http://stats.oecd.org, Education at a Glance Database.
Table C4.1. Total public expenditure on education as a percentage of total government expenditure (2018) |
|---|
Initial sources of funds, by level of education |
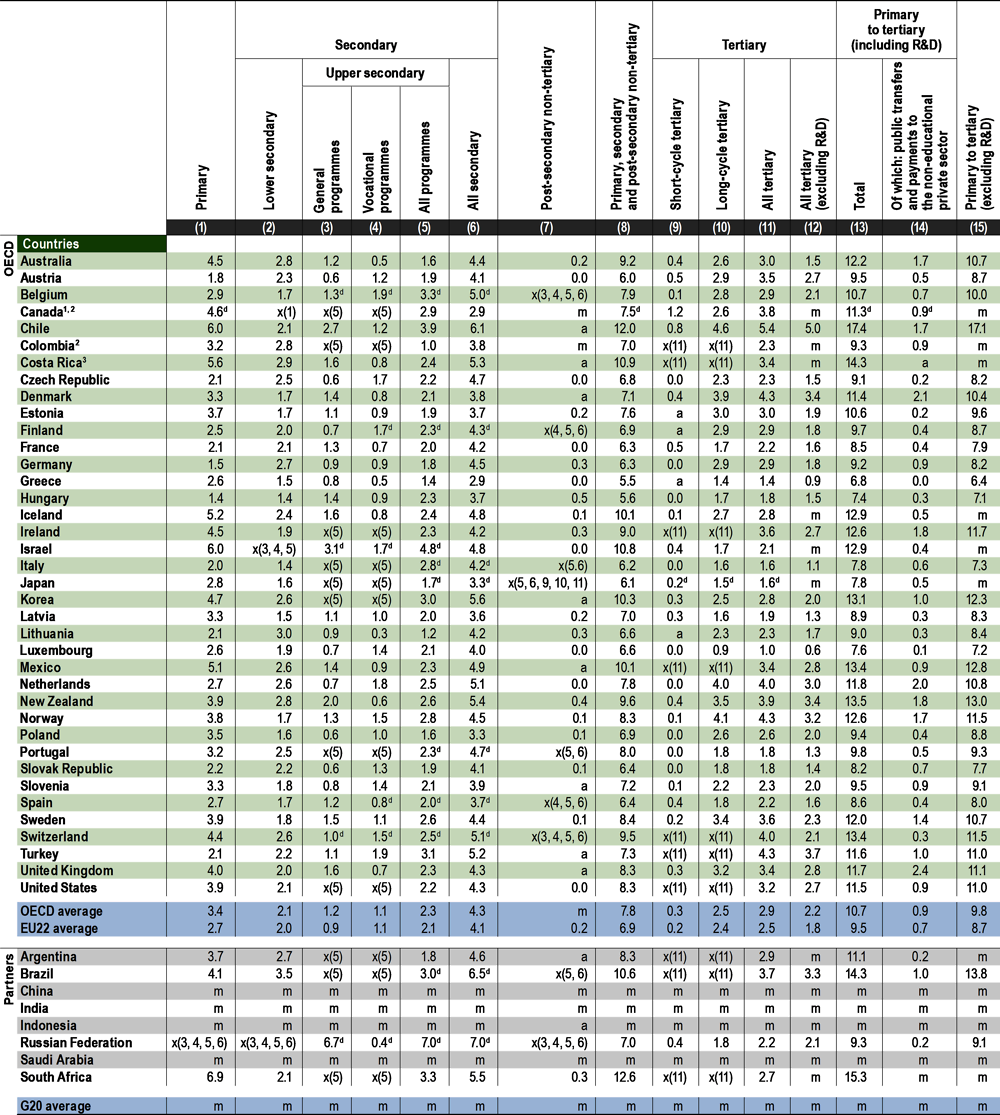 |
Note: The public expenditure presented in this table includes both public transfers and payments to the non-educational private sector which are attributable to educational institutions, and those to households for living costs, which are not spent in educational institutions. Therefore, the figures presented here (before transfers) exceed those for public spending on institutions found in Indicators C1, C2 and C3. Data on public expenditure as a share of GDP (i.e. Columns 16 to 19) are available for consultation on line (see StatLink below). See Definitions and Methodology sections for more information. Data and more breakdowns available at: http://stats.oecd.org, Education at a Glance Database. |
2. Post-secondary non-tertiary figures are treated as negligible. |
Source: OECD/UIS/Eurostat (2021). See Source section for more information and Annex 3 for notes (https://www.oecd.org/education/education-at-a-glance/EAG2021_Annex3_ChapterC.pdf). Please refer to the Reader’s Guide for information concerning symbols for missing data and abbreviations. |
Table C4.2. Distribution of sources of total public funds devoted to education, by level of government (2018) |
|---|
Percentage of total government expenditure, before and after transfers, by level of education |
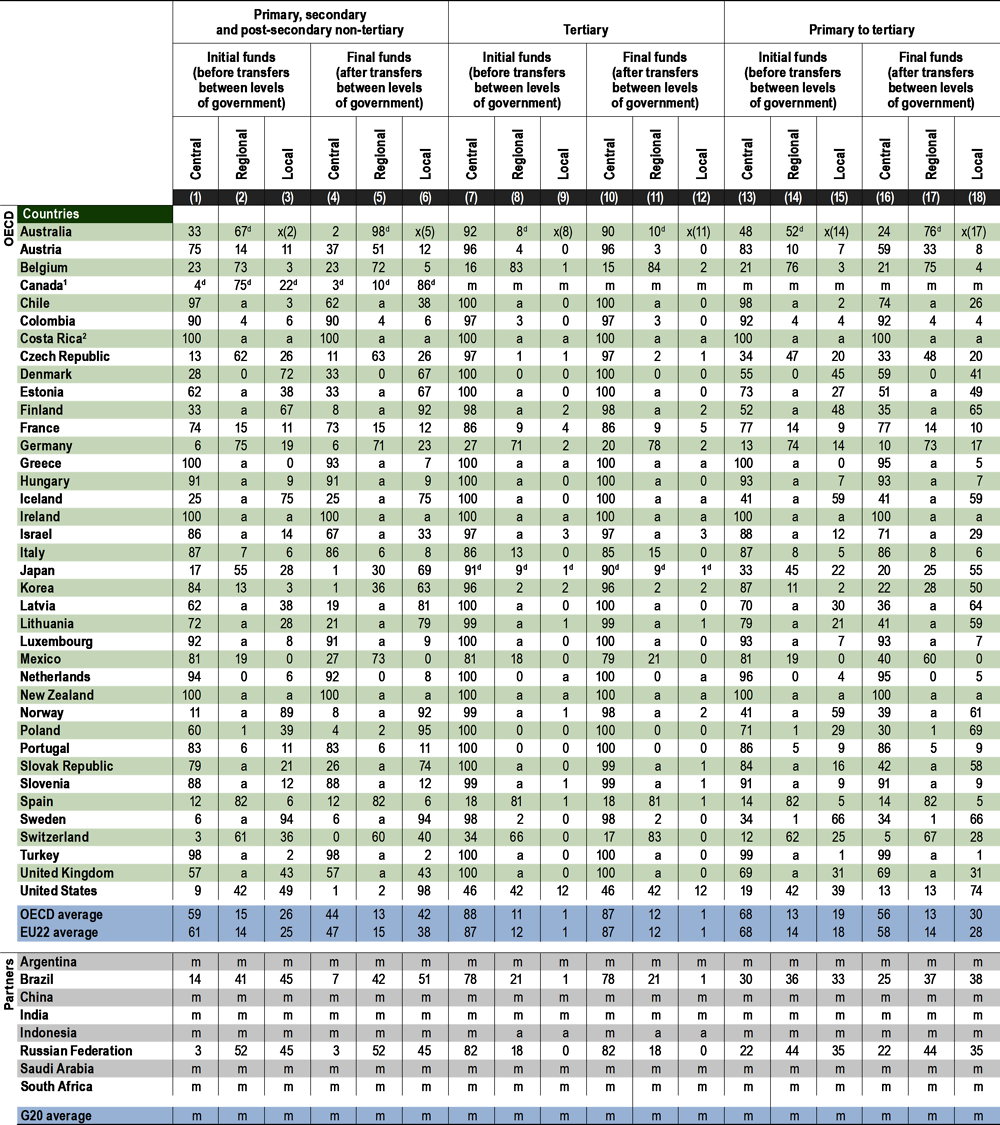 |
Note: Some levels of education are included with others. Refer to “x” code in Table C4.1 for details. See Definitions and Methodology sections for more information. Data and more breakdowns available at: http://stats.oecd.org, Education at a Glance Database. |
1. Primary, secondary and post-secondary non-tertiary education includes pre-primary programmes. |
Source: OECD/UIS/Eurostat (2021). See Source section for more information and Annex 3 for notes (https://www.oecd.org/education/education-at-a-glance/EAG2021_Annex3_ChapterC.pdf). Please refer to the Reader’s Guide for information concerning symbols for missing data and abbreviations. |
Table C4.3. Index of change in total public expenditure on education as a percentage of total government expenditure (2012 and 2018) |
|---|
Reference year 2015 = 100, constant prices, initial sources of funds, by level of education and year |
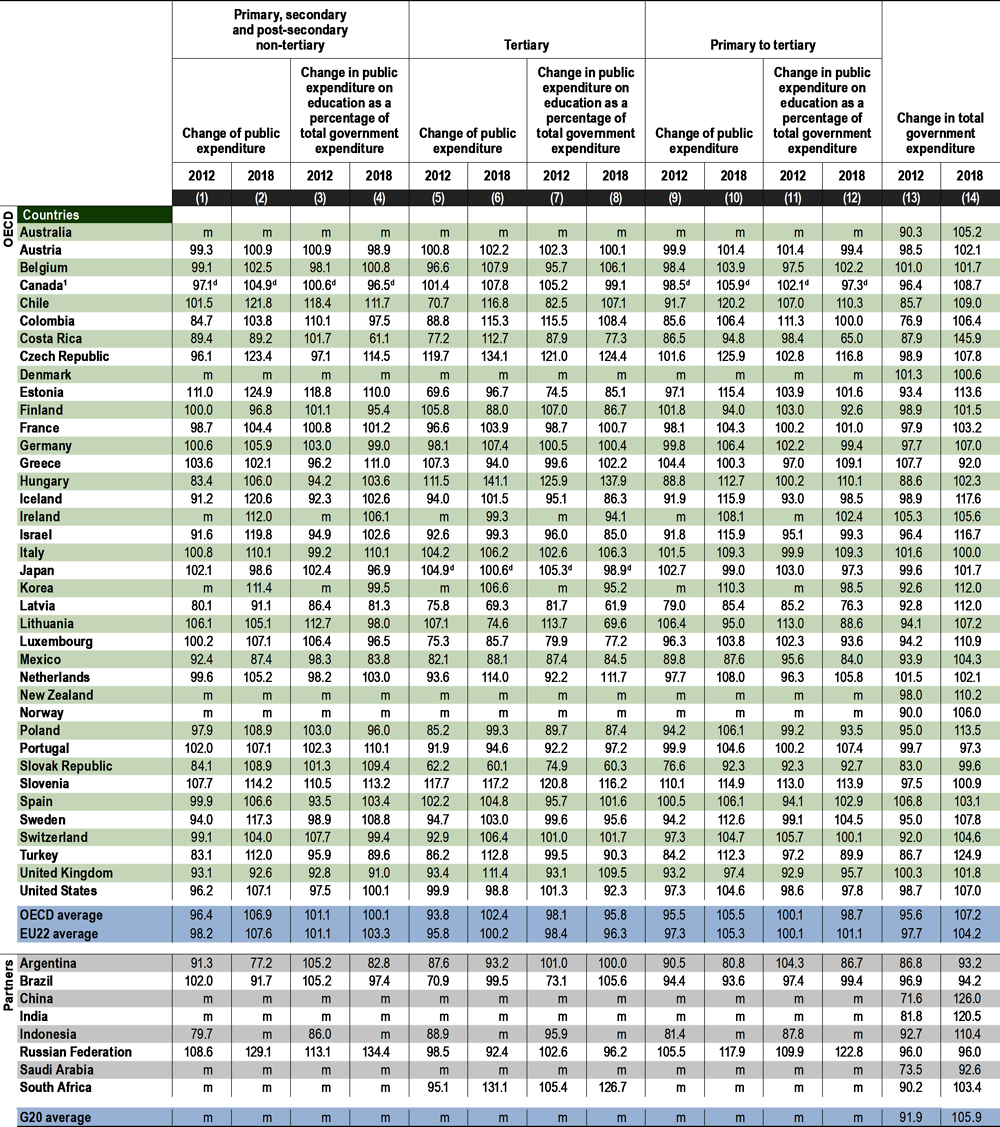 |
Note: The public expenditure presented in this table includes both public transfers and payments to the non-educational private sector which are attributable to educational institutions, and those to households for living costs, which are not spent in educational institutions. Therefore, the figures presented here (before transfers) exceed those for public spending on institutions found in Indicators C1, C2 and C3. See Definitions and Methodology sections for more information. Data and more breakdowns available at:: http://stats.oecd.org, Education at a Glance Database. |
1. Primary, secondary and post-secondary non-tertiary education includes pre-primary programmes. |
Source: OECD/UIS/Eurostat (2021). See Source section for more information and Annex 3 for notes (https://www.oecd.org/education/education-at-a-glance/EAG2021_Annex3_ChapterC.pdf). Please refer to the Reader’s Guide for information concerning symbols for missing data and abbreviations. |