23. United States
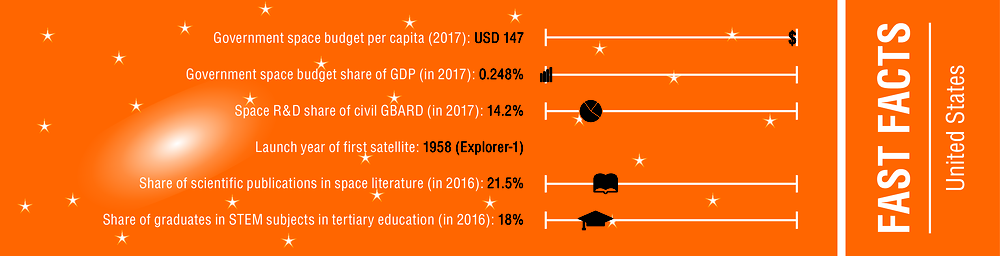
The United States has the world’s largest government space programme and has been a leading global space actor since its first successful satellite launch 60 years ago.
The National Aeronautics and Space Administration (NASA) is the national space agency, but other federal agencies and administrations also have important space programmes, including the Departments of Defense, Commerce (National Oceanic and Atmospheric Administration) and the Interior (US Geological Survey). The National Space Council, set up in 2017 within the Executive Office of the President, provides strategic directives for the US Space programmes.
Several space policy directives have been enacted. There is a reinforced focus on exploration and commercialisation, with directives specifically addressing human space exploration, space traffic management and the creation of a US Space Force. In 2019, the Space Development Agency was established as a separate organisation within the Department of Defense, in an effort to streamline the development of military space capabilities and promote strategic relations with commercial and international partners.
In 2017, the United States allocated some USD 48 billion to space activities (a conservative estimate), financing civil and military space programmes and activities implemented by multiple government departments and agencies. The main priorities of NASA’s USD 19.7 billion budget in 2017 included science (29% of funding), space operations (25%) and human exploration (22%) (US Congress, 2017[1]). Important programmes include the development of the Space Launch System (SLS), scheduled for launch in the early 2020s and the US deep exploration programme (e.g. human landing on the Moon and the deployment of the Gateway, a manned space station orbiting the Moon). While the United States currently depends on the Russian Federation to send astronauts to the International Space Station, Boeing and SpaceX are conducting advanced testing for commercial crew capsules. The first manned flights are expected late 2019 or early 2020.
Another important government space programme is the National Environmental Satellite, Data and Information Service (NESDIS) at the National Oceanic and Atmospheric Administration. In 2017, it received some USD 2.2 billion in funding (US Congress, 2017[1]), mainly for the operations and future development of satellite meteorological systems. NESDIS works closely with both commercial and international actors to improve forecasting strength. It is responsible for a range of data products for science and climate research.
Important research actors in space science, earth science and engineering include both government and non-government research organisations and multiple higher education institutions, such as the NASA-funded Jet Propulsion Laboratory located at the California Institute of Technology.
The United States has market-leading capabilities in all space industry segments: space manufacturing and launch, operations and downstream applications. In 2016, the US space industry generated some USD 110 billion in revenues (Satellite Industry Assocation, 2017[2]). The space manufacturing sector consists of several thousand companies (US Department of Commerce, 2014[3]). Start-up activity is high. The space manufacturing industry, which employed some 80 000 persons in 2017, is located throughout the United States, with a concentration near research centres, facilities and high-technology clusters in California, Texas, Florida, New Mexico, Colorado and Alabama. Several new manufacturing facilities (e.g. OneWeb, Blue Orbital) are being built in the Kennedy Space Center Exploration Park in Florida.
Important downstream activities include telecommunications and navigation-related equipment and services, which accounted for an estimated 90% of total US space industry revenues in 2016 (Satellite Industry Assocation, 2017[2]). Earth observation has seen considerable entrepreneurship in the last years, particularly in data analytics.
The United States has the highest share in scientific publications in the OECD “Space literature” dataset and space-related patent applications (see guide to the profiles). In both cases, the share has decreased since 2000, mainly due to increased activity of other countries. US satellite TV and satellite broadband penetration rates are some of the highest in the OECD area. The number of satellite TV subscriptions has remained stable since 2009, while the number of satellite broadband subscriptions doubled between 2007 and 2016.
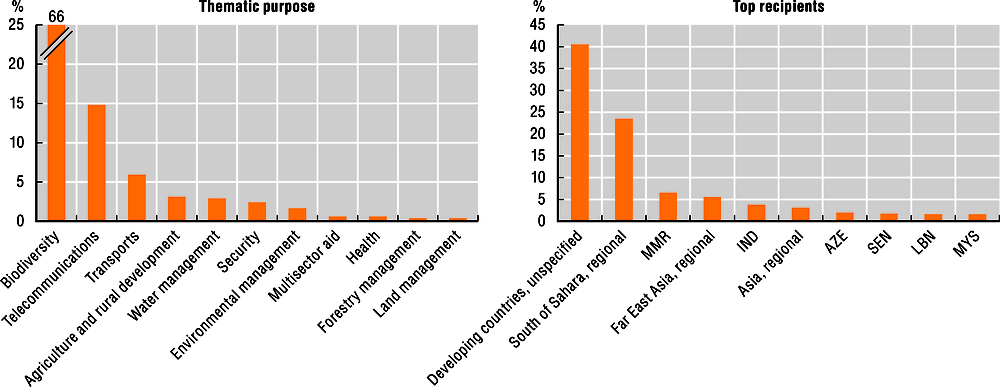
US space-related official development assistance projects have mainly focussed on biodiversity (e.g. the monitoring of forest cover and land use change) and telecommunications over the 2000-16 period. Main recipient countries and regions (when excluding unspecified recipients) were located in sub-Saharan Africa and Far East Asia (East and Southeast Asia). NASA and the US Agency for International Development (USAID) run the SERVIR programme, which provides satellite-based earth observation data, models and applications to assist environmental decision-making in developing countries.

1. Space budget trends are estimates.
2. This category also includes security and mission services.
Source: OECD analysis based on institutional sources.
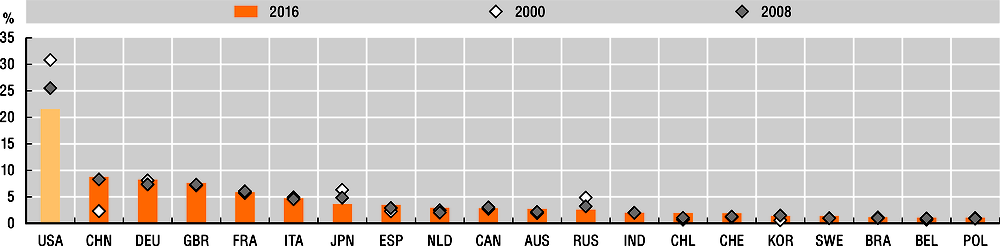
Source: OECD analysis based on Scopus Custom Data, Elsevier, July 2018.
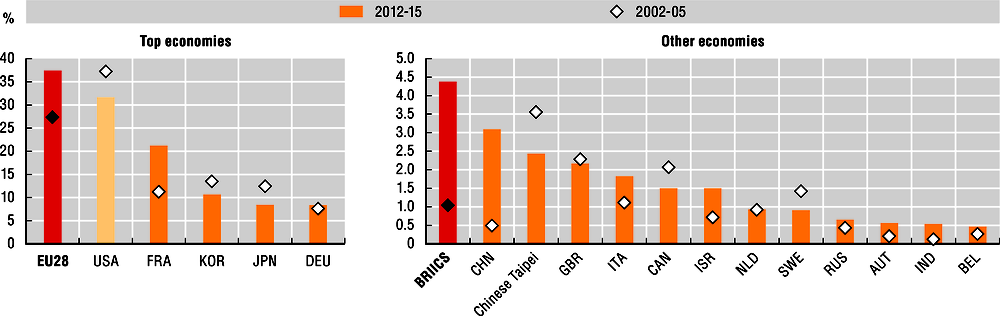
Note: Patent families are compiled using information on patent families within the Five IP offices (IP5). Figures are based on incomplete data from year 2014.
Source: OECD STI Micro-data Lab: Intellectual Property Database, http://oe.cd/ipstats, March 2018.
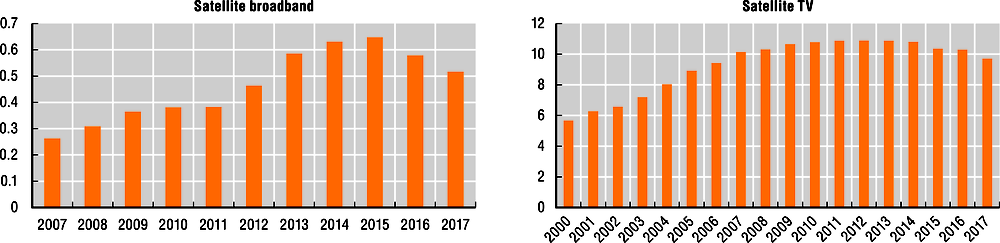
Source: OECD analysis based on OECD Broadband database, https://www.oecd.org/sti/broadband/broadband-statistics/, and ITU World Telecommunication/ICT Indicators database.
Source: Calculations based on OECD DAC database (2018).
References
[2] Satellite Industry Assocation (2017), State of the Satellite Industry Report 2017, Report written by Bryce Space and Technology, Satellite Industry Association, Washington, DC, https://www.sia.org/wp-content/uploads/2017/07/SIA-SSIR-2017.pdf (accessed on 11 June 2018).
[1] US Congress (2017), Consolidated Appropriations Act, 2017 (P.L. 115-31): Explanatory Statement - Division B, Commerce, Justice, Science, and Related Agencies, Washington, DC, https://www.nasa.gov/offices/ocfo/appropriations/appropriations_bills_and_committee_reports (accessed on 26 June 2018).
[3] US Department of Commerce (2014), US Space Industry Deep Dive: Assessment: Small Businesses in the Space Industrial Base, Washington, DC, http://www.bis.doc.gov/dib (accessed on 28 June 2018).