copy the linklink copied!Self-rated health and disability at age 65 and over
Even as life expectancy at age 65 has increased across OECD countries, many adults spend a high proportion of their older lives in poor or fair health (see indicator on “Life expectancy and healthy life expectancy”). In 2017, more than half the population aged 65 and over in 35 OECD countries reported being in poor or fair health (Figure 11.6). Older people in eastern European OECD countries report some of the highest rates of poor or fair health, with more than three-quarters of people aged 65 and over reporting their health to be fair, bad or very bad in Lithuania, Latvia, Estonia, Hungary, Poland, and the Slovak Republic. High rates of poor health are also reported in Portugal and Korea. Women are slightly more likely to report being in poor or fair health than men: 59% of women report their health to be fair, bad or very bad on average across OECD countries, compared with 54% of men. Less than 40% of the total population aged 65 and over reported being in poor or fair health in five European countries (Norway, Ireland, Switzerland, Sweden and the Netherlands). The lowest rate of poor or fair health for women was reported in Ireland (31%), while men reported the lowest rate of poor or fair health in Norway (also 31%).
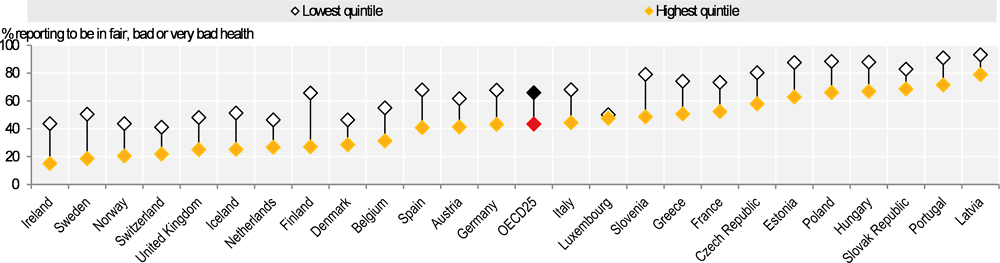
In all OECD countries with available data, older people in the lowest income quintile are more likely to rate their health as poor or fair (two in three people) than those in the top income quintile (less than one in two) (Figure 11.7). In every country except Luxembourg, the gap between self-reported poor or fair health among people in the lowest and highest income quintiles is larger than 14 percentage points. In five countries – Iceland, Norway, Finland, Sweden and Ireland – adults aged 65 and over in the lowest income quintile are more than twice as likely to report living in poor or fair health, compared with adults in the highest income quintile.
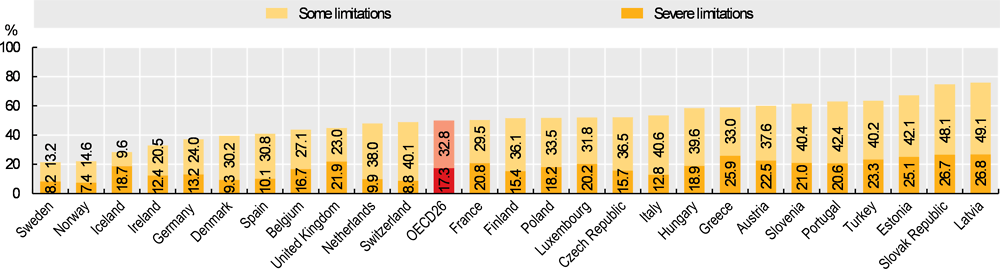
Across 26 European OECD countries, 50% of people aged 65 and over reported having at least some limitations in their daily activities: 33% reported some limitations and a further 17% reported severe limitations (Figure 11.8). Many of the countries reporting the highest rates of self-rated poor health also reported high rates of limitations in daily activities in adults aged 65 and over. In the Slovak Republic and Latvia, three in four adults aged 65 and over reported at least some limitations to activities of daily living, while in Latvia, the Slovak Republic and Estonia one in four adults aged 65 and over reported severe limitations. In contrast, about one in five people aged 65 and over in Sweden (21%) and Norway (22%) reported having limitations in their daily activities, with fewer than one in 12 reporting severe limitations in both countries.
Self-reported health reflects people’s overall perception of their own health, including both physical and psychological dimensions. Typically, survey respondents are asked a question such as: “How is your health in general: very good, good, fair, poor, very poor?”. OECD Health Statistics provides figures related to the proportion of people rating their health to be “fair/bad/very bad” combined.
Caution is required in making cross-country comparisons of perceived health status for at least two reasons. First, people’s rating of their health is subjective and can be affected by cultural factors. Second, there are variations in the question and answer categories used to measure perceived health across surveys/countries. In particular, the response scale used in Australia, Canada, New Zealand and the United States is asymmetrical (skewed on the positive side), including response categories: “excellent, very good, good, fair, poor”. The data reported in OECD Health Statistics refer to respondents answering one of the two negative responses (fair, poor). By contrast, in most other OECD countries, the response scale is symmetrical, with response categories: “very good, good, fair, poor, very poor”. The data reported from these countries refer to the last three categories (“fair, poor, very poor”). This difference in response categories may introduce an upward bias in the results from those countries that use an asymmetrical scale.
The category of limitations in daily activities is measured by the Global Activity Limitation Indicator (GALI) question, which comes from the EU-SILC survey. The question is: “For at least the past six months, have you been hampered because of a health problem in activities people usually do: yes, strongly limited; yes, limited; no, not limited?”. People in institutions are not surveyed, resulting in an under-estimation of disability prevalence. Again, the measure is subjective, and cultural factors may affect survey responses.
References
[1] Hirosaki, M. et al. (2017), “Self-rated Health Is Associated with Subsequent Functional Decline Among Older Adults in Japan”, International Psychogeriatrics, Vol. 29, No. 9, pp. 1475-1483, https://doi.org/10.1017/S1041610217000692.
[2] Schnittker, J. and V. Bacak (2014), “The Increasing Predictive Validity of Self-Rated Health”, PLoS ONE, Vol. 9, No. 1, e84933, https://doi.org/10.1371/journal.pone.0084933.
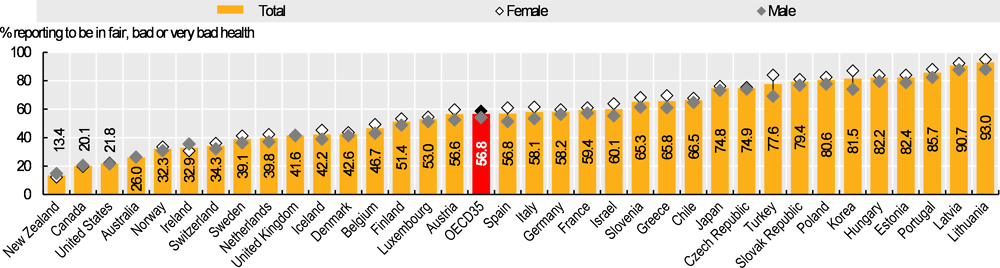
Note: Numbers are close together for males and females for Canada, the United States, Australia, the United Kingdom and the Czech Republic. Data for New Zealand, Canada, the United States and Australia biased downwards relative to other countries and so are not directly comparable.
Source: OECD Health Statistics 2019.
Source: Eurostat Database.
Source: Eurostat Database.
Metadata, Legal and Rights
https://doi.org/10.1787/4dd50c09-en
© OECD 2019
The use of this work, whether digital or print, is governed by the Terms and Conditions to be found at http://www.oecd.org/termsandconditions.