Chapter 2. Overview of the food and agriculture situation in Japan
This chapter describes the overall economic, social and environmental context in which Japan’s food and agriculture sector operates, and the natural resource base upon which it relies. It provides an overview of the general geographical and economic characteristics of Japan; identifies the main structural characteristics of the food and agriculture sector; provides an overview of the main food and agriculture outputs and markets; and analyses the main trends in agricultural productivity, competitiveness and sustainability. It finally raises a number of challenges the agro-food complex is likely to face in the future.
2.1. General economic context
Agriculture in the Japanese economy
Japan is the world’s third largest economy, after the United States and the People’s Republic of China (hereafter “China”), with a relatively small land area and high population density (Table 2.1). The share of agriculture in GDP has declined to 1.1%, while the share in employment is 3.4%, both of which are lower than the OECD average (Table 2.2). The higher share of agriculture in employment than GDP indicates that labour productivity in agriculture is lower than in the rest of the economy. The majority of those employed in agriculture are part-time farmers.
The food and agricultural sector, including food manufacturing industries, accounts for 3.4% of GDP and 5.3% of employment. In rural areas, the service industry generates the majority of employment. Even in the mountainous agricultural region, the employment share of primary industry is only 12%. Hokkaido, the northernmost prefecture, has a higher economic share of the food and agricultural sector, where these industries generate 7% of GDP and 10% of employment in the prefecture. The food manufacturing sector generates nearly half of employment in the manufacturing sector in Hokkaido.
Despite small shares of agriculture in the economy, agriculture is a major user of natural resources. Agriculture is the largest user of land and water, accounting for 12% of the total land area (36% of the total inhabitable area) and 68% of total water withdrawals. Japan is a mountainous country and forests account for about two-thirds of total land. The agricultural area decreased by more than 10% over the past two decades due to farmland abandonment and conversion to non-farm uses (e.g. residential or commercial uses). About half of farmland is irrigated paddy field used for rice production, while the rest is upland (dryland) for non-rice production such as wheat and soybeans.
Demographic change
The contraction of the Japanese population and labour force is a major challenge which increasingly affects the food and agriculture sector. Japan’s total population peaked in 2008 and is expected to decline by 31% by 2065 (Figure 2.1). Its working age population first began to decline in 1995 and it is expected to decline by 41% over the next four decades. The country’s fertility rate (1.44 in 2016) is lower than the OECD average (1.73) and one of the lowest among OECD countries (World Bank, 2018[5]). Labour shortages are a reality with a ratio of more than one job opening per applicant since 2011, and the share of firms reporting shortages of labour has increased markedly (OECD, 2017[10]).
The ageing population is particularly significant for the economy. The share of the population aged 65 years or more will rise from around 27% in 2016 to almost 40% in 2055, the highest in the OECD area. The elderly population is projected to reach 73% of the working age population (15-64) by 2050. Half of the children born in 2007 are expected to live until the age of 107. This elderly dependency ratio in rural and urban areas is again the highest among OECD countries (OECD, 2013[11]). The ageing issue is more severe in rural areas, where both depopulation and ageing are more advanced and growing faster than in other areas of the country, largely due to the migration of young people to cities (OECD, 2016[12]).

Note: Children refers to the population under 14 years, working-age population refers to those aged between 15 and 64, and elderly population refers to those aged 65 years and over.
Source: MIC (2017[13]) 2015 Population Census, http://www.stat.go.jp/english/data/kokusei/index.html, IPSS (2017[14]), Population Projections for Japan: 2016 to 2065, http://www.ipss.go.jp/pp-zenkoku/e/zenkoku_e2017/pp_zenkoku2017e.asp.
2.2. Characteristics of the agricultural and agro-food sectors in Japan
Production
The total value of agricultural production peaked in 1984 and up to 2010 declined on average by 1.4% annually. Increasing imports of food and agricultural products and declining domestic food consumption are the main drivers of this decline. However, between 2010 and 2017, the value of agricultural production increased on average by 1.9% annually. As a result, the value of agricultural production in 2017 recovered its highest level since 2000.
The structure of agricultural production has evolved over time. The share of rice in the value of agricultural production declined from 43% to 17% between 1965 and 2015 (Figure 2.2). Over this same period, the share of livestock and vegetable production increased from 23% and 12% to 35% and 27%, respectively. Livestock, vegetable and fruits now account for more than 70% of the total value of agricultural production.
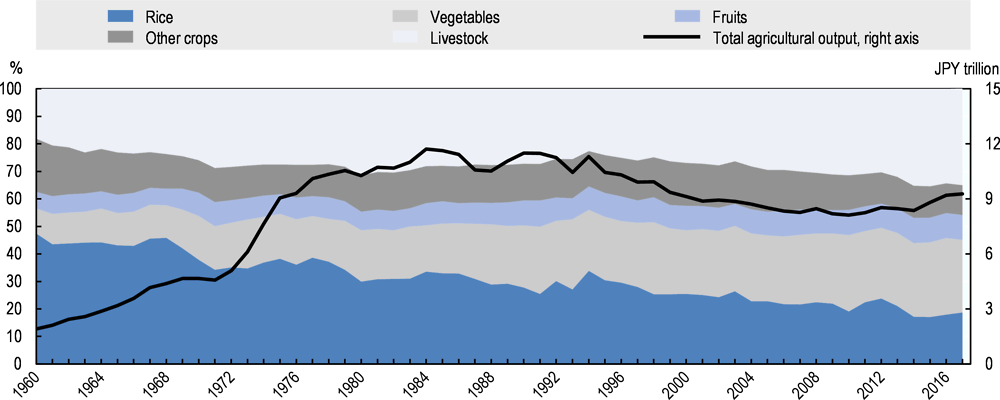
Source: MAFF (2018[15]), Statistics on Agricultural Income 2017 (database), http://www.maff.go.jp/j/tokei/kouhyou/nougyou_sansyutu/index.html.
Consumption
In 2016-18, on average, 26% of household expenditure went to food, of which 19% was consumed outside the home (MIC, 2019[16]). Similar to the change in the agricultural production structure, annual consumption per capita of rice declined continuously between 1962 and 2017, from 118 kg to 54 kg (Figure 2.3). The “westernisation” of the Japanese diet increased consumption per capita of meat and dairy by 6.3 and 4.2 times between 1960 and 2017.
Due mainly to the ageing Japanese population, calorie supply per capita started to decrease in 1996 and is projected to decline by 11% to 26% between 1995 and 2050 depending on the alternative assumptions (PRIMAFF, 2014[17]). As the Japanese population continues to age and to contract, domestic food demand is expected to decline.

Source: MAFF (2018[18]), Food Balance Sheet 2017 (database), http://www.maff.go.jp/j/zyukyu/fbs/.
Trade
Japan is the world’s fourth largest importer of agro-food products, after the United States, China, and Germany (UN Comtrade, 2018[8]), and the second largest net importer of agro-food products after China (MAFF, 2017[19]). In 2015-17, the value of its agro-food imports was 13.4 times larger than that of its exports.
While Japan maintains near self-sufficiency in rice, the food self-sufficiency ratio in calorie supply declined from 79% in 1960 to 38% in 2017, meaning that more than 60% of calorie intake depends on imports. Wheat and soybean depend largely on imports. On a value basis, the self-sufficiency ratio was 65% in 2017, reflecting a recent proportional increase in domestic vegetables, fruits and livestock products, which have a relatively higher unit price and added value per calorie.
Japan’s agro-food exports are rapidly growing (Figure 2.4). In particular, agro-food exports nearly doubled from 2011 to 2017, reaching JPY 497 billion (USD 4.4 billion). In 2016, the government set a target to increase exports of agro-food, fisheries and forestry products to JPY 1 trillion (USD 9 billion) by 2019.1 The share of agro-food exports in total exports increased from 0.4% to 0.6% over the same period.
Most Japanese agricultural exports are directed at final consumers rather than to an intermediate industry use. Processed food products such as alcohol, green tea, snacks, sauces and seasonings account for the majority of Japan’s agro-food exports. Among the unprocessed products, apples and beef are the most exported products. Approximately half of Japan’s agricultural imports are primary and processed products for consumption, while the rest is for further processing by domestic industries. These products include pork, maize, poultry, and poultry products.
The United States is Japan’s largest trading partner for agro-food imports, followed by China, Australia, Thailand, Canada and Brazil (Table 2.3). The majority of Japan’s agro-food exports goes to Asian countries; Hong Kong and Chinese Taipei are the largest importers of Japanese agro-food products.

Source: MAFF (2018[20]), Overview of Foreign Trade of Agricultural, Forestry, and Fishery Products, http://www.maff.go.jp/j/tokei/kouhyou/kokusai/houkoku_gaikyou.html.
International trade flows suggest that Japan does not have a comparative advantage in the agriculture and food sectors, either in gross or value-added terms. The Revealed Comparative Advantage (RCA) indicator compares the country's share in world agro-food exports with its share in world exports of all goods – a ratio above parity indicates comparative advantage and vice versa.2 Japan's RCA in gross trade flow is estimated at 0.04 for agricultural goods and 0.09 for food products (2005-14) suggesting that Japan is not competitive both in agricultural and food products (Figure 2.5). However, the RCAs estimated in value-added trade flow terms are higher than those estimated by gross trade flow, indicating Japan’s relatively high value-added positioning in agro-food trade.

Note: The value-added RCA is defined as the share of value-added originating from a given sector in a country’s exports divided by the share of value-added originating from this sector in world exports.
Source: OECD (2017[21]), Statistics on Trade in Value-Added (database), https://doi.org/10.1787/tiva-data-en.
Increasing trade in agro-food sectors within global value chains have the potential to offer new opportunities to add value to agricultural production. The degree of a country’s participation in global value chains can also reveal the role of its trade in enhancing competitiveness and innovation, and thus its exposure to globally competitive production and processes. Participation in Global Value Chains (GVCs) can be analysed through the import content of exports (backward participation) and the extent to which domestic value added from an industry in a given country form part of the value of another country’s exports (forward participation) (Greenville, Kawasaki and Beaujeu, 2017[22]).
Japan’s overall participation in GVCs is close to average compared with other OECD and non-OECD countries (OECD, 2017[21]). It’s agricultural products have a relatively higher degree of backward integration in foreign value chains, in which 13% of the value added that consumers paid for agricultural products originated abroad (compared to 8% for the world). Reflecting the low level of agricultural exports, the forward integration of Japan’s agriculture into the value chain outside the country is very low; only 2% of the agricultural value added is exported (compared to 11% for the world).
However, the value-added flows between Japan’s agriculture sector and other domestic and foreign sectors is larger than what GVC indicators seem to reveal. For instance, 31% of agricultural value added comes from other domestic sectors (26% for the world), which represents a significant backward linkage to domestic manufacture and service industries (Table 2.4). In particular, the share of value added from domestic manufacturing sector is relatively large. Domestic service sector is playing an important role in the presence of stronger competition, helping differentiate, customise and improve product quality, bundling them with products and services, and helping develop closer, more longstanding relationships with customers.
The degree of forward linkage between Japan’s agriculture and domestic value chains is particularly high. Overall, 57% of agricultural value-added ends in the production of other sectors in the country (43% for the world), indicating a strong forward linkage of Japan’s agriculture with domestic industries, in particular food processing.
Farm structure
Japan has experienced a significant transformation in its agriculture in the last few decades. The number of agricultural workers declined from 4.8 million in 1990 to 2.1 million in 2015, with an accelerated pace of decline in the last decade (Figure 2.6). Similarly, the number of commercial farm households declined from 3 million in 1990 to 1.3 million in 2015.3 The number of business and semi-business farms declined faster than side-business farms. As a result, the share of side-business farms in commercial farm households increased from 40% to 59% between 1990 and 2015.

Source: MAFF (2016[24]) Census of Agriculture and Forestry, http://www.maff.go.jp/j/tokei/census/afc/.
The average age of agricultural workers increased from 59.1 to 66.4 years between 1995 and 2015. In 2015, 63% of agricultural workers were more than 65 years old. This contrasts with many OECD countries; for example, only 32% of farm managers in the European Union were aged more than 65 years old. Moreover, in Japan, aged farmers are concentrated in small farms. Larger, business farms tend to be operated by younger farm managers. Farm managers under 54 years old account for 39% of farms of more than 10 hectares, but only 11% of farms less than 1 hectare (Figure 2.7).
Because of the increasing dominance of side-business and non-commercial farms in the number of farm households, production and resource use are increasingly concentrated on a small number of large-scale business farms. These farms often convert their legal status to that of a corporation to strengthen farm management capacity and hire non-family workers. The number of farm corporations more than doubled between 2005 and 2015 (Table 2.5).

Source: MAFF (2016[24]), Census of Agriculture and Forestry, http://www.maff.go.jp/j/tokei/census/afc/.
The average farm size increased from 1.4 hectares to 2.2 hectares between 1990 and 2015. Despite the slow increase in average farm size, concentration of land use to large farms accelerated in the last decade. For example, the share of farms operating more than 10 hectares of land increased from 34% to 48% between 2005 and 2015 (Figure 2.8). In Japan, farm structure is polarised so that the largest 3% of commercial farms cultivate nearly half of total farmland, although a large number of small-scale operations remains in the sector. This polarisation of agricultural structure is widely observed among OECD countries. In the European Union, the 7% of farms that were of 50 hectares or more in size account for a little over two-thirds (68%) of the European Union's utilised agricultural area in 2013 (Eurostat, 2017[25]).
It is estimated that this 3% of large farms, with more than JPY 30 million (USD 278 000) of sales, accounted for 53% of total output in 2015 (Figure 2.9). This is similar to the EU15, where 3% of all holdings with more than a standard output of EUR 250 000 (USD 311 000) were responsible for 55% of total agricultural economic output in 2013.

Source: MAFF (2016[24]), Census of Agriculture and Forestry, http://www.maff.go.jp/j/tokei/census/afc/.

Note: Farm-size class is expressed in JPY. The output value of each farm-size class in Japan is calculated by multiplying the number of farms by the median value of each class. For the classes of JPY 500 million (USD 4.1 million) or more, which is the highest class of the original statics, JPY 1 billion (USD 8.3 million) is used as the median output.
Source: MAFF (2016[24]) Census of Agriculture and Forestry, http://www.maff.go.jp/j/tokei/census/afc/; Eurostat (2017[25]), Farm Structure Survey 2013 (database), https://ec.europa.eu/eurostat/statistics-explained/index.php/Farm_structure_statistics.
Farm income
In Japan, the income gap between farm and non-farm households became negligible. The agriculture, forestry and fisheries household earned 98% of average household income and owned 29% more financial assets in 2014 (MIC, 2015[26]). Inter-regional inequalities in income in Japan are exceptionally low by OECD standards: in 2010, Japan had the second-lowest level of inequality among regions in GDP per capita. Moreover, inequality across Japanese regions has fallen over time, while it has increased in most other OECD countries (OECD, 2016[12]).
The income equality between farm and non-farm households is largely due to increasing non-farm income opportunities in rural areas. In 2015, two-thirds of rural communities are within a 30-minute drive of an urban centre, while over 90% are within an hour’s drive (MAFF, 2016[24]). This implies that the vast majority of hamlets are effectively within the commuter belts of reasonably large cities.
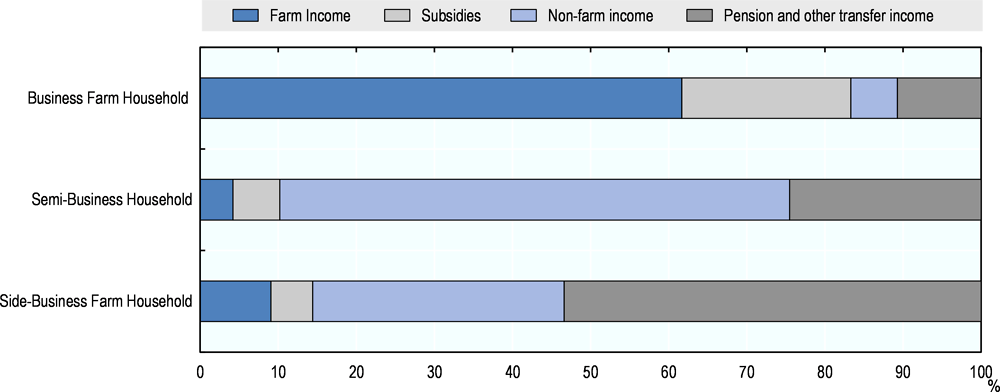
The share of farm income including subsidies among semi-business and side-business farm households was only 10% and 14% in 2017, respectively (Figure 2.10). The majority of income of side-business farm households are pension and other transfer income. In contrast, business farm households earn the majority of household income from farming. However, they are more dependent on subsidies, which accounted for 22% of the income of business farm households in 2017.
Source: MAFF (2018[27]), Survey on Farm Management Statistics on Type of Management (individual management), http://www.maff.go.jp/j/tokei/kouhyou/noukei/einou_syusi/index.html.
2.3. Productivity performance of agriculture in Japan
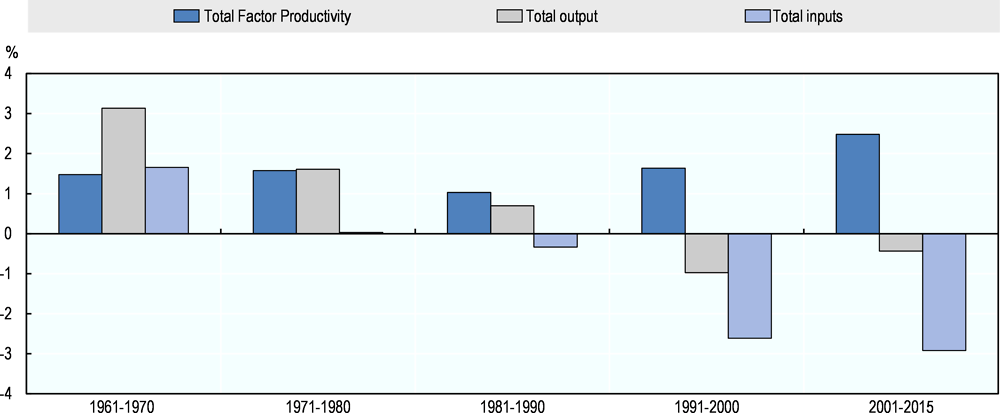
Total factor productivity (TFP) – the ratio of total output quantity to the total input quantity in a given sector – is a standard measure of productivity. According to the United States Department of Agriculture (USDA), Japan’s TFP growth in primary agriculture in 2001-15 averaged 2.5% a year, which is 0.8 percentage points above the OECD average (Figure 2.11). Productivity growth after the 2000s accelerated in comparison to the 1990s.
Decomposing TFP growth into total output and input growth in different time periods shows the dynamics of productivity growth. Recent TFP growth in Japan’s primary agriculture is mainly driven by the faster decline in inputs than outputs (Figure 2.12). In particular, labour input declined on average by 6.6% in 2001-15. Output growth has slowed since the 1990s and has been negative over the last two decades.

Note: The statistical data for Israel are supplied by and under the responsibility of the relevant Israeli authorities. The use of such data by the OECD is without prejudice to the status of the Golan Heights, East Jerusalem and Israeli settlements in the West Bank under the terms of international law.
Source: USDA, Economic Research Service (2018[28]), International Agricultural Productivity (database), https://www.ers.usda.gov/data-products/international-agricultural-productivity.
Source: USDA, Economic Research Service (2018[28]), International Agricultural Productivity (database), https://www.ers.usda.gov/data-products/international-agricultural-productivity.
The Japan Industrial Productivity Database, however, shows that the productivity growth of the agricultural sector has been lower than the manufacturing sector (RIETI, 2015[29]). The productivity gap between the agriculture and manufacturing sectors has widened since 1970. There has been a sustained lower productivity growth for agriculture since the 1990s. Within the manufacturing sector, electronics, transportation and precision machinery achieved high productivity growth, but productivity growth in the food manufacturing industry remains consistently lower than other manufacturing industries.
2.4. Sustainability performance of agriculture in Japan
Agriculture is often considered as a part of a “managed nature” or so called Satoyama that is indispensable for conserving the country’s natural environment (Cabinet Office, 2014[30]).4 However, agricultural production can negatively impact the environment, including through soil and water pollution (OECD, 2015[31]). The agricultural sector plays a key role in natural resource management as it accounts for 36% of its total inhabitable land and 68% of total water withdrawal.
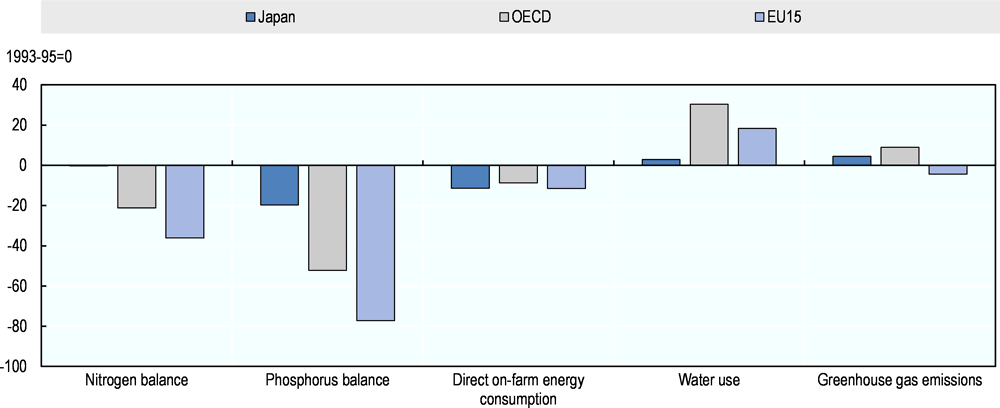
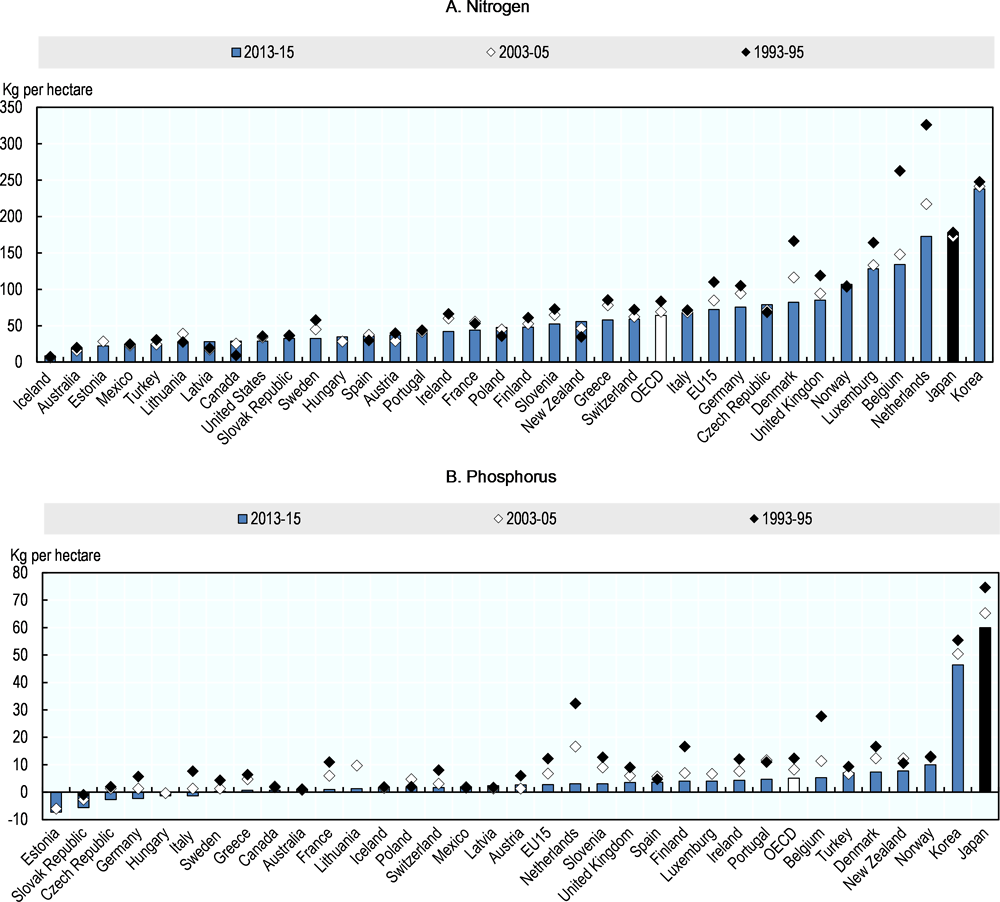
The total amount of inputs and emissions – including fertilisers, pesticides, water and energy consumption, as well as greenhouse gas (GHG) emissions – has decreased in Japanese agriculture, but this does not necessarily mean the environmental performance of the sector has improved. The nitrogen balance per hectare in Japan decreased by 0.3% between 1993-95 and 2013-15, while it fell by 35% in the EU15 and by 24% in the OECD area. Similarly, phosphorus balance per hectare decreased on average by 58.5% between 1993-95 and 2013-15 in the OECD area, whereas the decrease of Japan’s phosphorus balance remained at 24.5% (Figure 2.13). The nitrogen and phosphorus balance of Japan remains one of the highest among OECD countries.
Rice production plays an important role in Japan’s agricultural environmental performance as it accounts for more than half of total farmland use and 94% of agricultural water withdrawal in Japan (MLIT, 2018[32]). The rice sector is also the largest source of methane (CH4) emissions, accounting for 45% of the national CH4 emissions in 2016 (MOE, GIO, 2018[33]). At the same time, rice paddy fields provide non-commodity outputs such as conserving biodiversity and natural habitat. In particular, the usage of paddy fields – shallow water is retained during the growing period of rice while fields are drained before harvest – creates habitats for diverse organisms (Maeda, 2001[34]). Rice paddy fields also recharge about 20% of groundwater by percolating through soil (Mitsubishi Research Institute, 2001[35]). They retain water and slow the passage of water, which contributes to flood prevention. The irrigation canals of paddy fields can also prevent landslides (OECD, 2015[31]).
Notes: All indicators are calculated per unit of agricultural land. For water use, the 2013-15 average was replaced by 2012-14. Greenhouse gas emissions excludes LULUCF emissions.
Source: OECD (2018[9]), Agri-environmental indicators (database), http://www.oecd.org/tad/sustainableagriculture/agri-environmentalindicators.htm.
Nutrient balance
Fertiliser use and manure application are the main nutrient inputs of today’s agriculture to nature. Nitrogen is a key nutrient for crop growth and 40-60% of applied nitrogen is estimated to be absorbed by crops, but during and after fertiliser and manure application, some of these nutrients volatilise in the form of ammonia (NH3) and nitric oxide (NO) (Mosier et al., 1998[36]; Sebilo et al., 2013[37]). Excessive nitrogen leads to eutrophication of surface water which can cause biodiversity loss and pose risks to human health if concentrated in ground water. Moreover, rice paddy farming can lead to loss of soil nitrogen to gaseous nitrogen (N2) or nitrous oxide (N2O) through denitrification.5 N2, a major product of denitrification, is neutral from an environmental perspective, but N2O is a GHG and acidifies soil and water (Goulding, 2016[38]; OECD/Eurostat, 2007[39]).
Japan’s nitrogen balance in 2013-15 was 177.7 kg per hectare, the second highest among OECD countries and 2.8 times higher than the OECD average (Figure 2.14 Panel A). Manure has been the largest source of nitrogen input in Japan, 1.5 times higher than that from inorganic fertilisers. However, the intensity of inorganic nitrogen input was also above the OECD average (89.1 kg/hectare versus 60.8 kg/hectare) in 2015, although this represented a decrease from 104.7kg/hectare in 1995 (OECD, 2018[9]). A high degree of fertiliser use and livestock production, combined with a low share of pastureland, contribute to the high intensity of nutrient inputs in Japan (Shindo, 2012[40]).
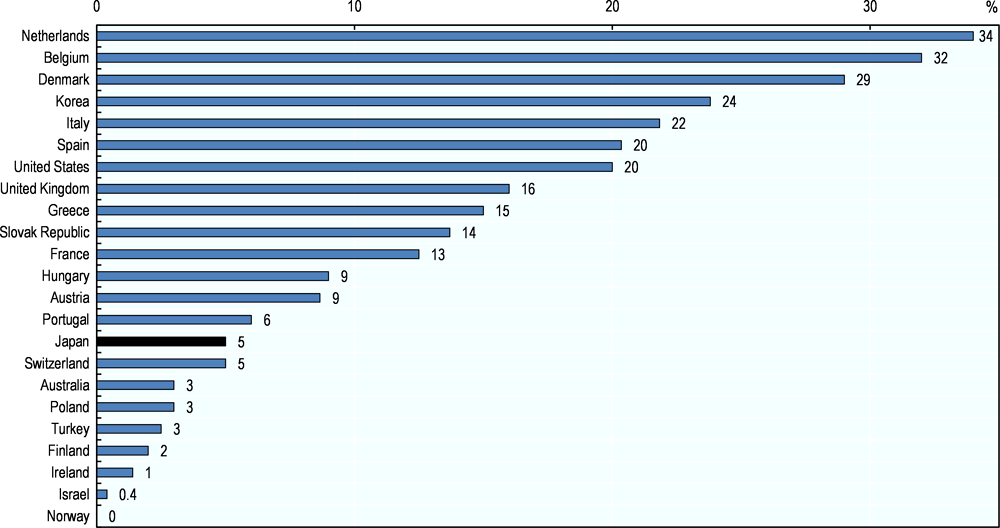
A survey conducted by the Ministry of Environment (MOE) (2018[41]) found that more than half of underground water contamination in Japan was due to excess nitrogen originating from agriculture. The share of monitoring sites in agricultural areas that exceeded recommended drinking water limits, however, was low (Figure 2.15). For surface water, only two out of 3 156 river sites were found to be contaminated by an excess of nitrogen, and no excess levels were found in lakes and oceans (MOE, 2018[42]). Nitrogen leaching in groundwater is much lower from paddy fields due to denitrification (OECD/Eurostat, 2007[39]). Indeed, the largest source of N2O emissions in 2016 was agriculture – agricultural soils and manure management accounted for 26% and 19% of N2O emissions, respectively (MOE, GIO, 2018[33]).
1. Countries are ranked according to the average amount of nitrogen or phosphorus balance in 2013-15. Chile and Israel are excluded due to data availability.
2. Data for 1993-95 nitrogen average refer to 1995 for Portugal and the United Kingdom while for Estonia, Hungary, Lithuania, and Luxemburg data are not available.
3. Data for 1993-95 phosphorus average refer to 1995 for Portugal and the United Kingdom while for Estonia and Hungary are not available.
4. Data for 2003-05 nitrogen and phosphorus average refer to 2004-05 average for Estonia.
5. For Switzerland, total agricultural area includes summer grazing.
Source: OECD (2018[9]), Agri-environmental indicators (database), http://www.oecd.org/tad/sustainableagriculture/agri-environmentalindicators.htm.
Unlike nitrogen, phosphorus, another important nutrient, is scarce in nature and exploited from mineral resources. Phosphorus uptake rates by crops are estimated to be 10%-15% (Roberts and Johnston, 2015[43]). The runoff of excess phosphorus in water increases toxic substances produced by cyanobacteria and produces algae, which restricts oxygen in the water and causes biodiversity loss (Chorus and Bartram, 1999[44]; Hitzfeld, Hoger and Dietrich, 2000[45]). In view of past applications and the accumulation of phosphorus in the soils, phosphorus application rates have declined in many OECD countries (OECD, 2013[46]).
However, the phosphorus balance in Japan was 59.9 kg per hectare in 2013-15, the highest of all OECD countries and 11.7 times higher than the OECD average (Figure 2.14 Panel B). Inorganic fertilisers account for 48% of phosphorus input and the intensity of inorganic phosphorus fertilisers in 2015 was substantially higher than the OECD average (36.2 kg/hectare versus 6.9 kg/hectare). The type of soil in Japan, Andosols, which has strong phosphate fixation (i.e. low phosphorus availability) caused by aluminum and iron, requires more intensive phosphorus input (FAO, 2015[47]).
The amount of phosphorus runoff from farmland is estimated to be less than 2% for most cases, mainly because phosphorus is easily fixed by soil and little flows out (Mishima et al., 2003[48]). However, phosphorus runoff increases when accumulated phosphorus reaches a certain level (Heckrath et al., 1995[49]). In the case of Japan, accumulated phosphorus increases the risk of eutrophication by overflow from paddy fields and surface runoff from upland farm fields in the rainy and the typhoon seasons (Mishima et al., 2003[48]).
Note: The figures refer to: 2000 for Japan, Korea, Turkey and United States; 2001 for Greece; 2002 for Australia, Finland, Hungary and Norway; 2003 for Denmark, Italy and Spain; 2005 for Belgium (Flanders), Portugal and Slovak Republic; 2008 for France and Poland; 2009 for Switzerland; and 2010 for Austria, Ireland, Israel, Netherlands and United Kingdom.
Source: Adapted from OECD (2013[46]), OECD Compendium of Agri-environmental Indicators, https://doi.org/10.1787/9789264181151-en.
Pesticides
Annual sales of chemical pesticides declined in quantity by 38% between 1994-96 and 2014-16. In 2014-16, 42% of pesticides sales were fungicides, followed by insecticides (33%) and herbicides (24%) (OECD, 2018[9]). The chemical pesticides sales also declined from 17 kg/ha in 1994-1996 to 11.8 kg/ha in 2014-16, although in 2011-15 it was the second highest among OECD countries (Figure 2.16). The intensive use of pesticides in Japan is due in part to its topography and humid temperate climate, which increases the occurrence of insects and mould.
Rice paddy fields are one of the most important non-point sources of pesticide water contamination in Japan. Since rice paddy fields are linked with the circulation of basins, pesticide discharge to water bodies sourced from paddy fields can be lethal to the aquatic environment. Moreover, extensive use of pesticides may adversely affect beneficial microorganisms in the soil and other species (Hussain et al., 2009[50]; Parsons, Mineau and Renfrew, 2010[51]).
Pesticide residue in food poses potentially serious detrimental health effects if it exceeds maximum residue limit (MRL). Globally, an average of 200 000 deaths per year from toxic exposure to pesticides is reported (UN, 2017[52]). In the case of Japan, however, the level of domestically-produced agro-food products that exceeded the MRL was only 0.003% in FY 2015 (MHLW, 2015[53]). Pesticides were handled in accordance with the regulations by all farmers surveyed in FY 2015 and FY 2016 (MAFF, 2018[54]).

Notes: Figure excludes New Zealand due to data availability. Data for 2011-13 are not available for Norway; data for 2013-15 are not available for Chile; data for 2014 and 2015 are not available for Israel, and data for 2015 are not available for Switzerland.
Source: OECD (2018[9]), Agri-environmental indicators (database), http://stats.oecd.org/.
Water
Japan is located in the easternmost part of the Monsoon Asia, one of the world’s heaviest rainfall regions. Average annual precipitation reaches 1 668 mm, 1.8 times more than the OECD average. However, the country’s annual available quantity of water resources per person is 3 397 m3, which is less than one-eighth of the OECD average (Figure 2.17). The amount of precipitation varies by season and region due to the country’s mountainous topography.
Japan’s steep topography requires good water management to preserve water resources as well as prevent water-related disasters such as floods, landslides and drought. Rice paddy fields are effective in retaining rainfall and flood reduction (Sujono, 2010[55]; OECD, 2015[31]). Paddy fields store water, lower the peak flow of rivers, and increase groundwater recharge, and most of the water that flows down to rivers and groundwater is reused downstream for agriculture and other purposes (Matsuno et al., 2006[56]; MLIT, 2018[32]). The decline of rice paddy fields is a concern in Japan from a water management perspective.
In 2015, 68% of Japan’s total water abstraction was used for agriculture, of which 94% was directed to paddy field irrigation (MLIT, 2018[32]). As freshwater withdrawal accounts for 95% of water use in agriculture, the reliance of groundwater in agriculture sector is the second lowest among OECD countries in 2013 (OECD, 2018[9]). Overall, agricultural water use has been stable since 2005, due largely to the offset of the decrease in paddy fields and the increase of other use (Cabinet Office, 2018[57]).

Note: Countries are ranked according to the average amount of water per capita.
Source: FAO (2018[58]), AQUASTAT (database), http://www.fao.org/nr/water/aquastat/main/index.stm.
Energy use and GHG emissions
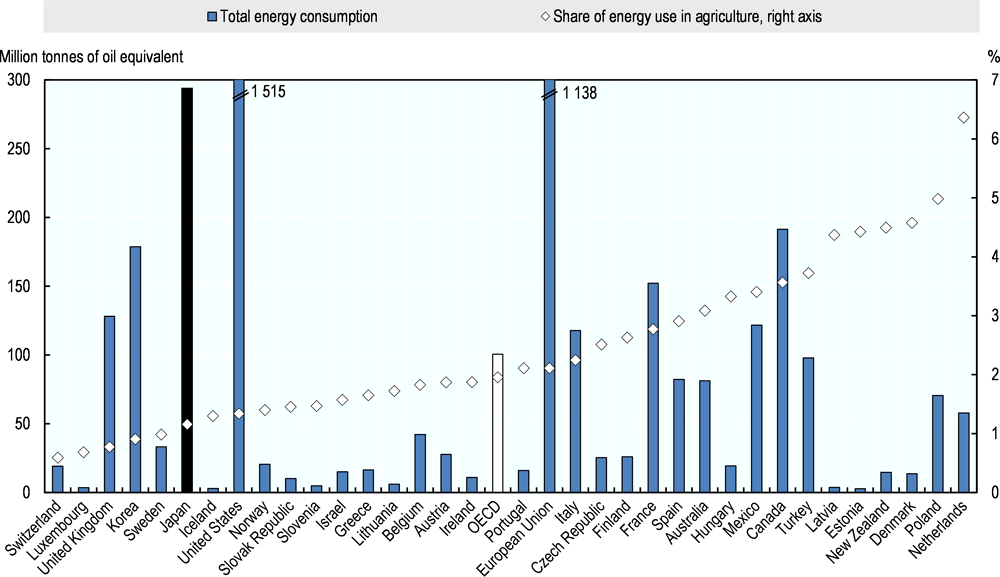
Reflecting the low economic share of agriculture, the share of agricultural energy consumption in Japan’s total final energy consumption was 1.2% in 2016 (Figure 2.18). However, on-farm energy consumption in 2016 was 3.4 million tonnes of oil equivalent, about twice the OECD average (OECD, 2018[9]).
Japan introduced the feed-in tariff scheme for renewable energy in 2012 to expand renewable energy production. This scheme requires electric utility companies to purchase electricity generated from renewable energy sources with a fixed price set by the government for a fixed period. The cost of purchasing electricity from renewable energy sources is transferred to consumers as a surcharge that is proportional to their use of electricity. Due mainly to this scheme, the share of renewable energy in the total primary energy supply increased from 2.1% to 5.5% between 1990 and 2017 (OECD, 2018[59]). This scheme also accelerated the production of renewable energy in the agricultural sector utilising agricultural dam and water channels, as well as photovoltaic solar panels built above the farmland (Farming Photovoltaics) (MAFF, 2018[60]).
Bioethanol production decreased from 52 tonnes in 2000 to 39 tonnes in 2018. Biodiesel production increased from 6 tonnes in 2008 to 11 tonnes in 2018, but the quantity remains marginal. Renewable energy derived from biomass source is mainly waste-based in Japan.6 The use of agriculture waste such as the non-edible parts of crops and thinning or scrap woods, is low as costs of transportation and conversion into fuel are high. The crop-based biofuel production has not reached the stage of wide practical use mainly because of competition with food production and the high cost of production.
Note: Figure excludes Chile and Germany due to data availability.
Source: OECD (2018[9]), Agri-environmental indicators (database), http://stats.oecd.org/.
Japan’s total GHG emissions was 1.3 million tonnes of carbon dioxide (CO2) equivalent in 2016, 7.3% lower than the level in the peak year of 2013. The reduction of GHG emissions was mainly driven by lower emissions from the energy sector — precisely the increase of renewable energy use and the re-operation of nuclear power plants after the Great East Japan Earthquake and the Fukushima accident of 2011 (MOE, 2018[61]). However, emissions are still 3% higher than the 1990 level.
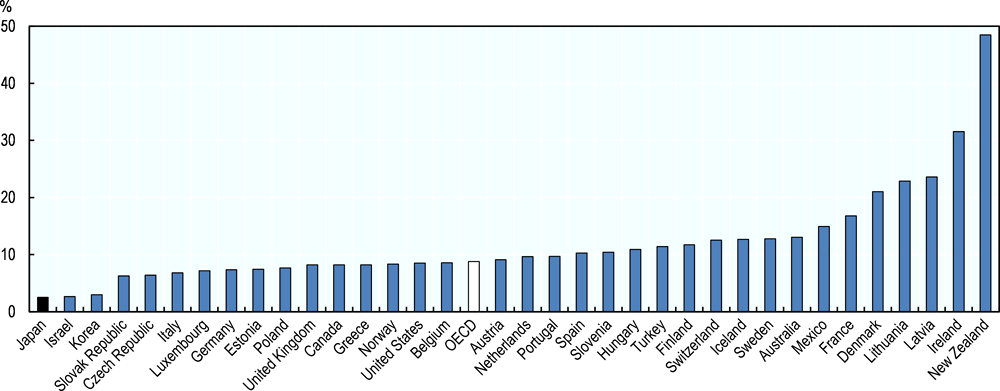
Globally, the agricultural sector is one of the largest contributors of GHG emissions, accounting for approximately 20% of total emissions (FAO, 2018[62]). However, the agricultural sector in Japan represented only 2.6% of total national GHG emissions in 2015, the lowest share in OECD countries (Figure 2.19). GHG emissions from the agricultural sector decreased by 10.9% between 1990 and 2016. Agricultural GHG emissions in Japan are mainly CH4 originating from rice cultivation (42%), followed by CH4 from livestock enteric fermentation (22%) and N2O by fertiliser application (16%) (MOE, GIO, 2018[33]). CH4 emission from agriculture accounts for 76.9% of the country’s total CH4 emission. GHG emissions from rice cultivation increased by 4.2 % between 2003-05 and 2013-15 (OECD, 2018[9]). The increase of CH4 emission from rice production highlights that policies seeking to minimise CH4 emissions from rice paddy fields is particularly effective in reducing GHG emissions originating from the Japanese agricultural sector.
Note: Chile is not included due to data availability.
Source: OECD (2018[9]), Agri-environmental indicators (database), http://www.oecd.org/tad/sustainableagriculture/agri-environmentalindicators.htm.
Climate change
Japan’s average annual temperature increased at a rate of 1.19℃ per century, which is higher than the global average of 0.85℃ (IPCC, 2013[63]). The prevalence of extreme high temperatures has increased in Japan since around 1990 and the number of days with a minimum temperature below 0℃ has decreased. The mean sea surface temperature around Japan increased by 1.11℃ per century, which is also higher than the global average of 0.54℃. The average temperature in Japan is projected to rise by 4.5℃ by the end of the 21st century (2076-2095) from the late 20th century (1980-1999), with more frequent extreme weather events (JMA, 2018[64]).
The impact of climate change on agricultural productivity are evident in the quality of rice (e.g. occurrence of white immature grain, cracked grain, and chalky rice kernels), which is projected to decline nationwide due to an increase in temperature during the ripening period (MAFF, 2018[65]). Although the Intergovernmental Panel on Climate Change (IPCC) (2014[66]) projects a reduction of rice yields in western Japan, overall rice yields are expected to increase up to the mid-21st century (Government of Japan, 2018[67]; MAFF, 2018[65]). More vulnerable to climate change, perennial crops are similarly affected by the change in weather patterns, including a decline in quality and alterations in the type of disease and pests (MAFF, 2018[65]; IPCC, 2014[66]). Nonetheless, the net impact on the national agricultural production remains uncertain. As temperatures rise, primary agricultural production sites on certain commodities may experience economic loss, but the country’s northern region may be able to increase agricultural production as the temperature becomes similar to that of current major agricultural production areas.
Japan is relatively susceptible to water related disasters, but the frequency of strong typhoons reaching Japan is projected to increase (MAFF, 2018[65]). In addition to typhoons, IPCC (2014[66]) warns that the frequent occurrence of long-term heatwaves increases extreme rainfalls and droughts in Japan. Japan Meteorological Agency (JMA) (2018[68]) estimates that climate change is one factor of the recent heavy rains and heatwaves. More frequent extreme weather events combined with natural disasters will likely be a major risk to future agricultural production in Japan.
2.5. Summary
Agriculture in Japan showed a long period of contraction until recently. Since 1990, the value of Japan’s agricultural production declined more than 25%, and the number of commercial farm households and agricultural workers decreased by more than 50%. The food and agriculture sector continues to be under pressure to raise productivity in order to keep up with the highly competitive manufacturing sector and to increase its exposure to international competition. Although TFP growth in agriculture is higher than the OECD average, the sector’s productivity growth remains lower than that of the manufacturing sector.
The working-age population started to decline in 1995 and is expected to contract further by 41% over the next four decades. The declining working-age population and the ageing population have significant implications for Japan’s agriculture from both production and consumption sides. The shortage of labour in agriculture is already causing severe constraints in many agricultural operations. Declining population and ageing will reduce the size of the domestic food market in the medium to long term. The future growth of the agriculture and food sector thus depends on the production of high-value-added products for the domestic and overseas markets.
Japan is the second largest net importer of agro-food products after China. Despite policy efforts to maintain food self-sufficiency, more than 60% of calorie intake depends on imports. Trade flows show that Japan does not have a comparative advantage in agriculture and food products. However, rapid economic growth in East Asia boosted demand for Japanese agro-food products and the country’s agro-food exports more than doubled between 2012 and 2018, opening new market opportunities for the future.
Resource reallocation to more profitable sectors and more productive large-scale farms drive productivity growth of Japan’s agriculture. The value share of rice in agricultural production declined from 43% in 1965 to 17% in 2015, while that of livestock and vegetables increased to 35% and 27% in 2015 from 23% and 12% in 1965, respectively. Westernisation of the Japanese diet has reduced rice consumption by more than half from its peak, and increased the consumption of meat and dairy products.
Structural changes in agriculture has accelerated over the past two decades. As a result, the structure of agricultural production is polarised with a small number of large, commercial farms dominates the sector. At present, the top 3% of large farms producing more than JPY 30 million (USD 278 000) accounts for more than half of total production. The farm structure in Japan is now similar to that of the EU15, and the future performance of the sector will depend more on improving productivity and sustainability performance at the farm level than on concentration of land to large-scale farms.
Income disparity problems between farm and non-farm households has gradually disappeared due to increasing off-farm employment opportunities in rural areas. In contrast, large farms depend on farm income and are thus more vulnerable to income risk associated with agricultural production and markets. They are typically incorporated farms and hire regular employees, separating agricultural production operations from overall business management. The number of corporate farms doubled between 2005 and 2015.
The evolution of Japan’s agricultural structure and the global trend towards more integrated value chains require a change in the implicit policy assumption that the government needs to support small-scale family farms that are disadvantaged in the economy. Developing a favourable policy environment for entrepreneurial farms to enable innovation, entrepreneurship, and sustainable resource use has become more relevant.
Despite the declining share of primary agriculture in the economy, controlling the impact of agriculture on natural resources is important as the sector uses 36% of the country’s total inhabitable land area and accounts for 67% of total water withdrawal. The evolution of Japan’s agricultural structure requires producers to take more responsibility of their environmental performance.
There is significant room to improve the environmental performance of Japanese agriculture. Japan has one of the highest nutrient surpluses among OECD countries, indicating the potentially high risk of environmental pressure on soil, water and air. While many OECD countries have reduced their agricultural nutrient surpluses, Japan’s progress has been much slower. For example, the nitrogen balance in Japan decreased by only 0.3% between 1993-95 and 2013-15, while it fell by 35% in the EU15 and by 24% in the OECD area – in both cases from lower initial levels. Future growth in Japanese agriculture can no longer depend on the intensive use of inputs and natural resources.
The impact of climate change on agriculture is already evident. The prevalence of extreme high temperatures has increased in Japan since around 1990 and days with minimum temperatures below 0℃ have decreased. More frequent extreme weather events combined with natural disasters will likely be a major risk to future agricultural production. Increasing preparedness for climate change is critical to ensuring the sustainability of agriculture production in Japan.
References
[57] Cabinet Office (2018), White Paper on Water Circulation 2018 (in Japanese), https://www.cas.go.jp/jp/seisaku/mizu_junkan/materials/materials/white_paper.html.
[30] Cabinet Office (2014), Public Survey on Rural Area (in Japanese), https://survey.gov-online.go.jp/h26/h26-nousan/index.html.
[6] Eurostat (2018), [nama10_a10], [lfsa_egan2], http://ec.europa.eu/eurostat/data/database.
[1] Eurostat (2017), [demo_pjan], http://ec.europa.eu/eurostat/data/database.
[25] Eurostat (2017), Farm structure survey 2013, https://ec.europa.eu/eurostat/statistics-explained/index.php/Farm_structure_statistics (accessed on 30 July 2018).
[58] FAO (2018), AQUASTAT, http://www.fao.org/nr/water/aquastat/main/index.stm.
[62] FAO (2018), The future of food and agriculture – Alternative pathways to 2050, http://www.fao.org/publications/fofa.
[2] FAO (2017), FAOSTAT, Food and Agriculture Organization of the United Nations, http://www.fao.org/faostat/en/ (accessed on 27 July 2018).
[47] FAO (2015), World Reference Base for Soil Resources 2014, update 2015 International soil classification system for naming soils and creating legends for soil maps. World Soil Resources Reports No. 106., http://www.fao.org/3/i3794en/I3794en.pdf.
[38] Goulding, K. (2016), “Soil acidification and the importance of liming agricultural soils with particular reference to the United Kingdom”, Soil Use and Management, Vol. 32/3, pp. 390-399, https://doi.org/10.1111/sum.12270.
[67] Government of Japan (2018), Climate change adaptation plan (in Japanese), http://www.env.go.jp/earth/tekiou/tekioukeikaku.pdf.
[23] Greenville, J., K. Kawasaki and R. Beaujeu (2017), “A method for estimating global trade in value added within agriculture and food value chains”, OECD Food, Agriculture and Fisheries Papers, No. 99, OECD Publishing, Paris, https://dx.doi.org/10.1787/f3a84910-en.
[22] Greenville, J., K. Kawasaki and R. Beaujeu (2017), “How policies shape global food and agriculture value chains”, OECD Food, Agriculture and Fisheries Papers, No. 100, OECD Publishing, Paris, https://doi.org/10.1787/aaf0763a-en.
[49] Heckrath, G. et al. (1995), “Phosphorus Leaching from Soils Containing Different Phosphorus Concentrations in the Broadbalk Experiment”, Journal of Environment Quality, Vol. 24/5, p. 904, https://doi.org/10.2134/jeq1995.00472425002400050018x.
[45] Hitzfeld, B., S. Hoger and D. Dietrich (2000), “Cyanobacterial Toxins: Removal during Drinking Water Treatment, and Human Risk Assessment”, Environmental Health Perspectives, Vol. 108, p. 113, https://doi.org/10.2307/3454636.
[50] Hussain, S. et al. (2009), “Chapter 5 Impact of Pesticides on Soil Microbial Diversity, Enzymes, and Biochemical Reactions”, in Advances in Agronomy, Elsevier, https://doi.org/10.1016/s0065-2113(09)01005-0.
[66] IPCC (2014), Climate change 2014 Impacts, Adaptation and Vulnerability Part B: Regional Aspect, Cambridge University Press, https://www.ipcc.ch/site/assets/uploads/2018/02/WGIIAR5-Chap21_FINAL.pdf.
[63] IPCC (2013), Climate Change 2013: The Physical Science Basis. Contribution of Working Group I to the Fifth Assessment Report of the Intergovernmental Panel on Climate Change, Cambridge University Press, https://www.ipcc.ch/site/assets/uploads/2017/09/WG1AR5_Frontmatter_FINAL.pdf.
[14] IPSS (2017), Population Projections for Japan : 2016 to 2065, http://www.ipss.go.jp/site-ad/index_english/population-e.html.
[68] JMA (2018), Characteristics and factors of heavy rainfall in July and the following heat wave (in Japanese), https://www.data.jma.go.jp/gmd/cpd/longfcst/extreme_japan/monitor/japan20180810.pdf.
[64] JMA (2018), Climate change monitoring report 2017, https://www.jma.go.jp/jma/en/NMHS/ccmr/ccmr2017_low.pdf.
[34] Maeda, T. (2001), “Patterns of bird abundance and habitat use in rice fields of the Kanto Plain, central Japan”, Ecological Research, Vol. 16/3, pp. 569-585, https://doi.org/10.1046/j.1440-1703.2001.00418.x.
[60] MAFF (2018), Annual Report on Food, Agriculture and Rural Areas in Japan FY 2017 (in Japanese).
[18] MAFF (2018), Food balance sheet 2017 (in Japanese), https://www.e-stat.go.jp/ (accessed on 30 July 2018).
[65] MAFF (2018), MAFF climate change adaptation plan (in Japanese), http://www.maff.go.jp/j/kanbo/kankyo/seisaku/attach/pdf/tekioukeikaku-10.pdf.
[20] MAFF (2018), Overview of Foreign Trade of Agricultural, Forestry, and Fishery Products (in Japanese), http://www.maff.go.jp/j/tokei/kouhyou/kokusai/houkoku_gaikyou.html (accessed on 30 July 2018).
[54] MAFF (2018), Pesticide use and pesticide residue found in domestically produced foods (in Japanese), http://www.maff.go.jp/j/press/syouan/nouyaku/attach/pdf/180328-2.pdf.
[15] MAFF (2018), Statistics on Agricultural Income 2017 (in Japanese), http://www.maff.go.jp/j/tokei/kouhyou/nougyou_sansyutu/index.html (accessed on 28 February 2019).
[27] MAFF (2018), Survey on Farm Management Statistics on Type of Management (individual management) (in Japanese), http://www.maff.go.jp/j/tokei/kouhyou/noukei/einou_syusi/index.html.
[19] MAFF (2017), Overseas food balance report 2016 (in Japanese), http://www.maff.go.jp/j/zyukyu/jki/j_rep/annual/2016/attach/pdf/2016_annual_report-48.pdf (accessed on 24 August 2018).
[24] MAFF (2016), The Census of Agriculture and Forestry (in Japanese), http://www.maff.go.jp/j/tokei/census/afc/ (accessed on 30 July 2018).
[56] Matsuno, Y. et al. (2006), “Prospects for multifunctionality of paddy rice cultivation in Japan and other countries in monsoon Asia”, Paddy and Water Environment, Vol. 4/4, pp. 189-197, https://doi.org/10.1007/s10333-006-0048-4.
[53] MHLW (2015), The examination results of pesticides residues in food FY 2015 (in Japanese), https://www.mhlw.go.jp/file/06-Seisakujouhou-11130500-Shokuhinanzenbu/0000194453.pdf.
[16] MIC (2019), Family Income and Expenditure Survey, https://www.stat.go.jp/english/data/kakei/index.html.
[13] MIC (2017), 2015 Population Census, http://www.stat.go.jp/english/data/kokusei/2015/pdf/schedule.pdf.
[26] MIC (2015), 2014 National Survey of Family Income and Expenditure, https://www.e-stat.go.jp/en.
[48] Mishima, S. et al. (2003), “Trends of phosphate fertilizer demand and phosphate balance in farmland soils in Japan”, Soil Science and Plant Nutrition, Vol. 49/1, pp. 39-45, https://doi.org/10.1080/00380768.2003.10409977.
[35] Mitsubishi Research Institute (2001), Evaluation of Multifunctionality associated with Agriculture and Forestry related to the Global Environment and Human Life (in Japanese), Mitsubishi Reseach Institute Inc., Tokyo.
[32] MLIT (2018), Water resource in Japan 2018 (in Japanese), http://www.mlit.go.jp/mizukokudo/mizsei/mizukokudo_mizsei_fr2_000020.html.
[61] MOE (2018), GHG emissions in FY2017 (in Japanese), https://www.env.go.jp/press/files/jp/110354.pdf.
[41] MOE (2018), Results on groundwater quality assessment FY2017 (in Japanese), http://www.env.go.jp/water/report/h30-03/h30-03_full.pdf.
[42] MOE (2018), Results on water quality assessment in public water area FY2017 (in Japanese), http://www.env.go.jp/water/suiiki/h29/h29-1.pdf.
[33] MOE, GIO (2018), National Greenhouse Gas Inventory Report of Japan, http://www-gio.nies.go.jp/aboutghg/nir/2018/NIR-JPN-2018-v4.1_web.pdf.
[36] Mosier, A. et al. (1998), , Nutrient Cycling in Agroecosystems, Vol. 52/2/3, pp. 225-248, https://doi.org/10.1023/a:1009740530221.
[9] OECD (2018), Agri-environmental indicators, http://www.oecd.org/greengrowth/sustainable-agriculture/agri-environmentalindicators.htm.
[3] OECD (2018), National Accounts, http://stats.oecd.org/.
[59] OECD (2018), Renewables Information 2018, OECD Publishing, Paris, https://dx.doi.org/10.1787/renew-2018-en.
[7] OECD (2018), System of National Accounts, Annual Labour Force Statistics, http://data.oecd.org/.
[10] OECD (2017), OECD Economic Surveys: Japan 2017, OECD Publishing, Paris, https://doi.org/10.1787/eco_surveys-jpn-2017-en.
[21] OECD (2017), OECD-WTO: Statistics on Trade in Value Added, https://doi.org/10.1787/tiva-data-en.
[12] OECD (2016), OECD Territorial Reviews: Japan 2016, OECD Territorial Reviews, OECD Publishing, Paris, https://doi.org/10.1787/9789264250543-en.
[31] OECD (2015), Public Goods and Externalities: Agri-environmental Policy Measures in Selected OECD Countries, OECD Publishing, Paris, https://dx.doi.org/10.1787/9789264239821-en.
[11] OECD (2013), How’s Life? 2013: Measuring Well-being, OECD Publishing, Paris, https://dx.doi.org/10.1787/9789264201392-en.
[46] OECD (2013), OECD Compendium of Agri-environmental Indicators, https://doi.org/10.1787/9789264181151-en.
[39] OECD/Eurostat (2007), Gross nitrogen balances handbook, http://www.oecd.org/greengrowth/sustainable-agriculture/40820234.pdf.
[51] Parsons, K., P. Mineau and R. Renfrew (2010), “Effects of Pesticide use in Rice Fields on Birds”, Waterbirds, Vol. 33/sp1, p. 193, https://doi.org/10.1675/063.033.s115.
[17] PRIMAFF (2014), The estimation of food consumption whith a declining population (in Japanese), http://www.maff.go.jp/j/council/seisaku/kikaku/bukai/H26/pdf/140627_03_01kai.pdf (accessed on 3 August 2018).
[29] RIETI (2015), Japan Industrial Productivity Database 2015, https://www.rieti.go.jp/en/database/JIP2015/ (accessed on 30 July 2018).
[43] Roberts, T. and A. Johnston (2015), “Phosphorus use efficiency and management in agriculture”, Resources, Conservation and Recycling, Vol. 105, pp. 275-281, https://doi.org/10.1016/j.resconrec.2015.09.013.
[37] Sebilo, M. et al. (2013), “Long-term fate of nitrate fertilizer in agricultural soils”, Proceedings of the National Academy of Sciences, Vol. 110/45, pp. 18185-18189, https://doi.org/10.1073/pnas.1305372110.
[40] Shindo, J. (2012), “Changes in the nitrogen balance in agricultural land in Japan and 12 other Asian Countries based on a nitrogen-flow model”, Nutrient Cycling in Agroecosystems, Vol. 94/1, pp. 47-61, https://doi.org/10.1007/s10705-012-9525-x.
[55] Sujono, J. (2010), “Flood Reduction Function of Paddy Rice Fields under Different Water Saving Irrigation Techniques”, Journal of Water Resource and Protection, Vol. 02/06, pp. 555-559, https://doi.org/10.4236/jwarp.2010.26063.
[4] UN (2018), World Population Prospects: The 2017 Revision, https://esa.un.org/unpd/wpp/.
[52] UN (2017), Report of the Special Rapporteur on the right to food, https://documents-dds-ny.un.org/doc/UNDOC/GEN/G17/017/85/PDF/G1701785.pdf?OpenElement.
[8] UN Comtrade (2018), United Nations Commodity Trade Statistics (database), http://comtrade.un.org/ (accessed on 28 July 2018).
[28] USDA, Economic Research Service (2018), International Agricultural Productivity (database), https://www.ers.usda.gov/data-products/international-agricultural-productivity/ (accessed on 30 October 2018).
[44] WHO (ed.) (1999), Toxic cyanobacteria in water : a guide to their public health consequences, monitoring and management, E & FN Spon, http://www.who.int/iris/handle/10665/42827.
[5] World Bank (2018), World Development Indicators (database), http://data.worldbank.org/indicator (accessed on 27 July 2018).
Notes
← 1. The value of exported agro-food, fisheries and forestry products was JPY 907 billion (USD 8.2 billion) in 2018, of which agro-food products amounted to JPY 566 billion (USD 5.1 billion).
← 2. In general, RCA values greater than 1 indicate a comparative advantage and that a country specialises in exports for that sector, meaning that the sector is competitive within the economic system of the country with respect to other sectors. Values less than 1 indicate that a country has not specialised in that sector and that it has no comparative advantage.
← 3. A farm household in Japan’s agricultural statistics is a household that cultivates more than 0.1 hectare of land or has more than JPY 150 000 (USD 1 379) in annual sales of agricultural products. Farm households are divided into commercial farm households and self-sufficient farm households. Agricultural workers are defined as farm household members of 15 years or older who mainly engage in farming. Commercial households are farm households that cultivate more than 0.3 hectare of land or sell more than JPY 500 000 (USD 4 596) of farm products and are further sub-categorised as follows according to the extent of non-farm employment: 1) Business farm household: a farm household whose farm income is more than half of the total household income and which has at least one family member (less than 65 years-old) engaged in farming more than 60 days per year; 2) Semi-business farm household: a farm household whose farm income is less than half of the total household income and which has at least one family member (less than 65 years-old) engaged in farming more than 60 days per year; 3) Side-business farm household: a farm household in which no member either engages in farming more than 60 days or is less than 65 years-old.
← 4. Satoyama is located between villages (sato) and the mountains (yama) in which rich biodiversity have been fostered for centuries thanks to continued human management of the land. MOE selected 500 Satoyamas as important biodiversity sites in an attempt to conserve the lands but the selection does not legally bind the use of land or farming methods.
← 5. Denitrification is a reduction of nitrates or nitrite by heterotrophic bacteria in soil that results in the escape of N2 or N2O into the air. Denitrification is common in anaerobic soils and is encouraged by high soil temperatures. It occurs during and after flood irrigation and/or heavy rainfall. Denitrification process is important for soil bacteria because it supplies them with oxygen but it can also result in N2O emissions.
← 6. The government set rates for biomass plants that burn liquidified biomass from thinning or scrap woods at JPY 32 (USD 0.3) per kilowatt-hour and agricultural waste (methane fermentation) at JPY 39 (USD 0.4) per kilowatt-hour through the feed-in tariff scheme.