copy the linklink copied! Cost effectiveness of public policies
Governments are responsible for the provision of public services, either directly or by regulating private providers. The relationship between inputs (human or financial) and sectoral outcomes is referred to in the academic literature as cost effectiveness. Outcomes in health and education (e.g. health gains, learning gains, financial net benefits and improvements in satisfaction with services) are the results of various factors including public policies and frontline provision of services.
Health care
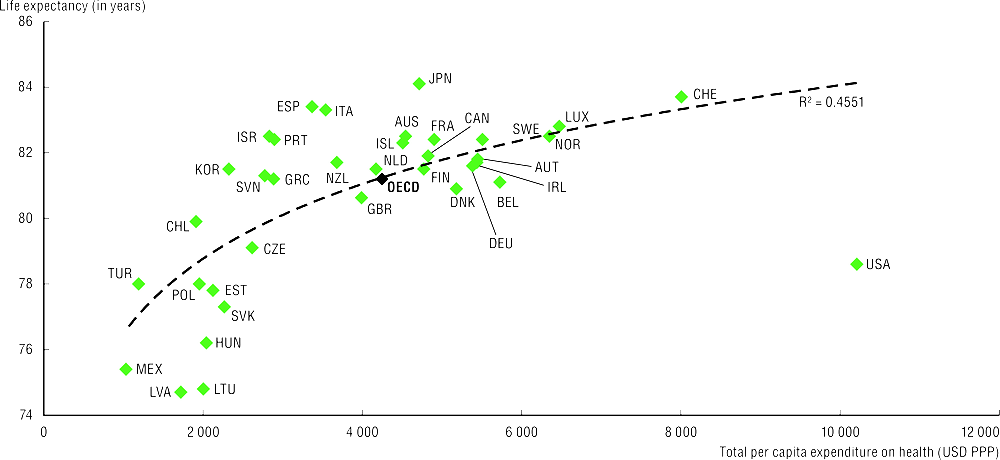
The relationship between total health expenditure (or only public expenditure on health, which account for about 75% of total health spending) and life expectancy at birth provides a broad measure of health-spending effectiveness, although life expectancy is the result of various factors. Higher health spending is associated with longer lives, although with diminishing returns. Beyond a certain threshold, policy choices, environmental factors and individual lifestyles can explain the difference in life expectancy between countries.
Japan, Italy, Spain, Israel and Korea have relatively high life expectancy given their health expenditure levels. On the other hand, life expectancy in the United States, and to a lesser extent in Latvia, Mexico and Hungary, is lower than expected at their levels of health spending. Factors explaining this phenomenon in the United States include: the highly fragmented nature of the health system - with relatively few resources devoted to public health and primary care-; health-related behaviours, e.g. obesity rates and deaths from road traffic accidents; and higher poverty rates and income inequality than in most other OECD countries. Between 2015 and 2017, the opioid crisis and a slowdown in the reduction in cardiovascular mortality contributed to reduce life expectancy in the United States (Raleigh, 2019). In Hungary, Latvia and Lithuania, risk factors (e.g. tobacco use, alcohol consumption and unhealthy diet) prevalent among men, explain the relatively low life expectancy.
Education
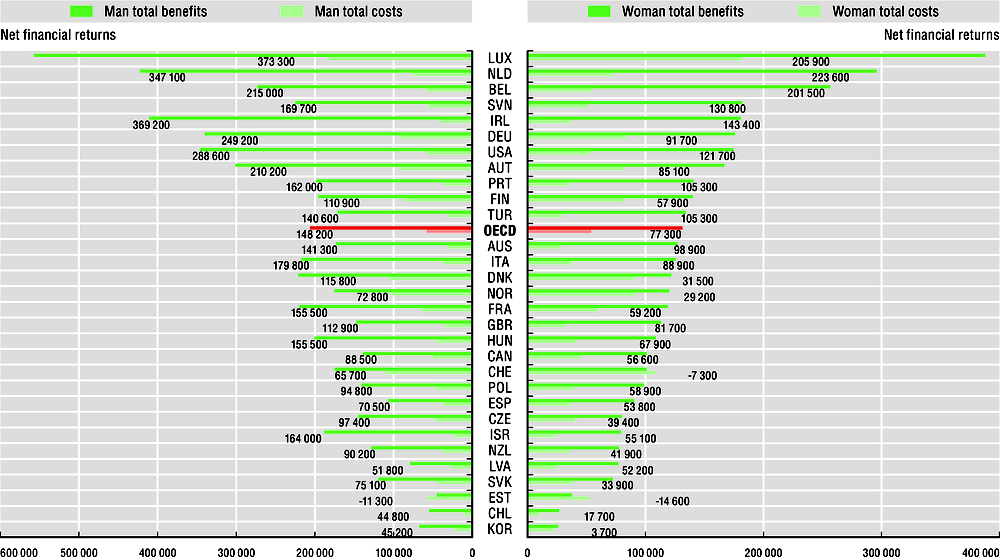
Human capital creation and skills development are two key objectives for the education sector given their beneficial effects on employment prospects and life-long earnings. There are several possibilities for measuring cost effectiveness of the education sector. One option is to look at the difference between public costs and benefits of attaining an additional education level (e.g. net financial returns) throughout the working life of education recipients. On average across OECD countries, the public net financial returns of obtaining tertiary education compared to upper secondary are about USD 148 200 for a man and USD 77 300 for a woman. For a man, these public financial returns are highest in Luxembourg (USD 373 300) and for a women in the Netherlands (USD 223 600). Differences in public net financial returns between men and women are explained by lower earnings and employment rates of women. These results, may also be due to, among others, employment in different sectors, career progression, types of occupation and contracts, difficulties conciliating work and family life, and a wage gap between men and women for similar jobs.
Life expectancy measures how long, on average, a newborn can expect to live if current death rates do not change. Total current expenditure on health captures the final consumption of health goods and services (i.e. current expenditure), but excludes capital investment in health care infrastructure. This includes spending by both public and private sources on medical services and goods, prevention programmes and administration. Education cost and benefits values are based on the difference between men or women who attained tertiary education compared with those who attained upper secondary education. In this analysis, the costs include direct public costs for supporting education and foregone taxes on earnings, while the benefits are calculated using income tax and social contributions. For governments, direct costs represent the largest share of total public costs for tertiary education, even though student loans are not taken into account in this indicator. Tertiary educated people are defined as those who have attained at least one of the following International Standard Classification of Education (ISCED) levels: short-cycle tertiary (ISCED 5), a bachelor’s degree or equivalent (ISCED 6), master’s degree or equivalent (ISCED 7) or a doctoral degree or equivalent (ISCED 8).
Further reading
OECD (2019), Education at a Glance 2019: OECD Indicators, OECD Publishing, Paris, https://doi.org/10.1787/f8d7880d-en.
OECD (2017), Health at a Glance 2017: OECD Indicators, OECD Publishing, Paris, https://doi.org/10.1787/health_glance-2017-en.
Raleigh, V. (2019), “Trends in life expectancy in EU and other OECD countries: Why are improvements slowing?”, OECD Health Working Papers, No. 108, OECD Publishing, Paris, https://doi.org/10.1787/223159ab-en.
Figure notes
On data for Israel, see https://doi.org/10.1787/888932315602.
10.15: All data for current expenditure on health per capita are for 2017.
10.16: Results are based on the net earnings of tertiary-educated adults (as compared with the net earnings of adults with upper secondary education). Data for the Czech Republic, Chile, France and Italy are for 2015, data for the Netherlands are for 2014.
Source: OECD Health Statistics (database).
Source: OECD Education at a Glance (database).
Metadata, Legal and Rights
https://doi.org/10.1787/8ccf5c38-en
© OECD 2019
The use of this work, whether digital or print, is governed by the Terms and Conditions to be found at http://www.oecd.org/termsandconditions.