
Chapter 5. Brazil’s demographic transition and its effect on public spending
This chapter presents future public spending projections for Brazil as a result of the demographic transition. The end of the demographic dividend, which will be followed by population ageing, will affect spending on health, education, social programmes and social security, including pensions. Health spending will increase significantly in absolute terms but should maintain its share as a proportion of gross domestic product (GDP). Education expenditure will decline. As education spending in Brazil is determined by the level of education, the reduction in spending will not be linear, and will affect all levels of government. The biggest challenge will be the payment of social security benefits, putting at risk the sustainability of the government finances. Therefore, the most urgent task for federal, state and municipal governments is to pursue comprehensive social security reforms that will guarantee basic government functions in the coming years.
The authors would like to thank the Getulio Vargas Foundation Research Network (FGV Research Network) for its financial support for the Project "Demografia e Gastos Públicos", of which this chapter is a product.
Since the 1930s, Brazil has been facing a rapid demographic transition, characterised by both mortality and fertility declines with consequences for the size, growth and age profile of its population (Carvalho and Wong, 2008[1]). The United Nations projections indicate that demographic growth rates will decline from 1.26% in 2000-05 to -0.60% in 2100 (United Nations, 2019[2]). In the same period, the dependency ratio (i.e. the ratio between dependents – youth and elderly – and the working-age population) will change significantly. It will have declined from 129 per 100 adults in 1970 to 60.6 in 2025 because of the reduction in the proportion of youth but will recover again, reaching 106.7 in 2100 due to population ageing. Families, markets, and the public sector will have to adapt to the changes in demand brought about by a rapidly ageing population.
The pressures of population ageing on the public pension system have been at the centre of debate in academia and the press. However, the demographic transition also represents critical challenges for the provision of public services, including education and health, and other public transfer programmes. The demographic transition affects not only public expenditure, but also public revenues because it affects labour supply and the growth rate of gross domestic product (GDP), as shown in Barbosa Filho (2014[3]).1
During the second phase of the demographic transition (after the 1960s), the working-age population increased sharply, leading to growth in public spending. However, compared to other high and middle-income countries, there was relative neglect of public investment (education, health and nutrition) in children and young people, while the share of the elderly in the population was still small. It was only after the promulgation of the new national constitution in 1988 that public investment in younger age groups started to expand, whereas transfers to the elderly increased further, owing to more extensive coverage and and more generous benefits (Turra, Queiroz and Rios-Neto, 2011[4]). Demographers and economists have documented, that public spending is elderly-biased since the 1990s with the help of intergenerational accounting models (see Turra (2000[5]); Turra and Queiroz (2006[6]); Turra, Queiroz and Rios-Neto (2011[4])). Recently, Turra, Queiroz and Mason (2016[7]) showed that the ratio between per capita net public transfers to people over 65 years and those under 19 years had remained higher in Brazil than in any other country over the last two decades, despite having declined since the 2000s, due to increased spending on education and the implementation of transfer programmes to low-income children.
With an increasing fraction of the population at older ages, larger transfers of the public pension system compromise public investment and raise fiscal risks. The demographic changes have not only had an impact on the Brazilian pension system but also the public provision of health services. A declining working-age population will limit labour supply and thus potential output (Barbosa Filho et al., 2014[3]), heightening public budget constraints. Since labour productivity growth will probably not be enough to compensate for the declining supply, imbalances will require reforms in order to maintain budget solvency.
It is crucial to estimate the impacts of the demographic transition on public spending in order to plan public budgets over time. In this chapter, the evolution of public spending is estimated until 2060 as a result of changes in the age structure of the Brazilian population. The evolution of public expenditure of the pension (both private-sector workers and public servants), public health and education system and of social transfers, both in real terms and as a percentage of GDP, at the federal, state and local level will be discussed. The chapter is organised into eight sections in addition to this introduction. The next section estimates the impacts of the demographic transition on the Brazilian GDP. The third to the seventh section discuss the consequences of population ageing, respectively, on health, education, pensions, other types of public transfers, and long-term care programmes. The penultimate section summarises the results and the final section presents conclusions.
This section provides estimates of potential GDP growth rates for Brazil, considering the demographic changes that are expected to occur in the next few decades, using the methodology described in Barbosa Filho et al. (2014[3]). The authors combined economic and demographic variables in a single model to forecast the GDP growth trajectory. The estimates show that the growth rate of the working-age population will decrease over time, dropping to less than 1% per year after 2022. The decline in the working-age population growth will limit the expansion of Brazil’s potential output to a rate below 2% until 2050. The increase in female labour force participation will mitigate this, but it will not offset the adverse effects on potential output. To maintain the current potential working-age population growth rate constant in the face of the demographic changes, Brazil would need an immigrant inflow of around 2 million people per year, a figure that is a hundred times higher than the current rate.
GDP potential forecast methodology
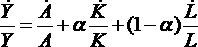
Following Barbosa Filho et al. (2014[3]), we estimate GDP growth rates based on the evolution of the working-age population (WAP) and labour-force participation rates (LFP), under the hypothesis that the occupied population growth rate reflects the variation of LFP, i.e. unemployment is assumed to be constant. The potential GDP growth estimates are presented in two ways. The first method uses the aggregate production function employing capital and labour, while the second method assumes constant labour productivity. It follows Barbosa Filho et al. (2014[3]), adopting a Cobb-Douglas production function and simplifying assumptions on depreciation and total factor productivity. According to a Cobb-Douglas technology, the potential GDP growth  is given by (1):
 (1)
(1)
where  is TFP growth,
  is the capital stock growth (which depends on the investment rate, considered to be equal to 16% (
 ));
));  is labour supply growth and
  is the labour income participation rate, assumed to be equal to 40% (
 ), consistent with Brazilian data.
The second method follows Dang, Antolín and Oxley (2001[8]), who adopted a methodology that decomposes potential GDP growth rate into two components: labour productivity growth and labour supply growth. Accordingly, potential GDP growth follows equation (2):
 (2)
(2)
where  represents labour supply growth and
  the labour productivity growth rate.
Empirical evidence shows that labour productivity growth in Brazil was around 1% per year between 1982 and 2016. Therefore, for the simulations, a labour productivity growth rate equal to 1% per year is adopted.
Results
Table 5.1 presents the potential output growth estimates based on the two methodologies discussed above. The demographic transition will lower labour input growth to negative rates after 2037, adversely affecting potential output growth. Both methods indicate a monotonic decrease in potential output until 2052.
In many countries, the empirical evidence suggests a non-monotonic relationship between health spending and age. Health expenditure is typically higher among children (especially toddlers) and the elderly. Estimates of the National Transfer Accounts (NTA) project (www.ntaccounts.org), which compares generational accounts in more than 40 countries, as well as other national studies, e.g. Reis, Noronha and Wajnman (2016[9]), confirm that the public health spending age profile also has a “J” shape in Brazil. The age patterns vary across societies, depending on population health standards, mortality profiles, health systems, available technology, habits, culture and other national characteristics (Noronha and Turra, 2013[10]; Berestein and Wajnman, 2008[11]). Age is indeed a proxy to many observable and non-observable variables that affect health expenditure in several indirect ways (Evans, 1985[12]; Zweifel, Felder and Meiers, 1999[13]; Werblow, Felder and Zweifel, 2007[14]; Brockmann and Gampe, 2005[15]). For instance, estimations suggest that the time until death explains large differences in health care spending and can be the reason why spending on the elderly is higher (Raitano, 2006[16]; Miller, 2001[17]). In addition, increases in health spending at older ages are higher in higher-income countries, suggesting that the age profile of spending shifts with GDP growth (Mason and Miller, 2017[18]).
Methodology
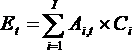
Total health spending projections depend on population size per age group j in year t  and per capita expenditure per age group j
  . Thus, total health spending
  is estimated by equation (3):
 (3)
(3)
Equation (3) provides the estimation of total health spending under the hypothesis of a fixed age profile of public spending on health . Therefore, projected total health spending reflects exclusively demographic changes. The health spending age profile estimated by Turra, Queiroz, and Mason (2016[7]) is used. The authors combined 2003 Brazilian household data (PNAD) on out-patient utilisation rates with public data on hospitalisation rates (Unified Health System, SUS) to compute the age spending profile. The per capita spending was adjusted according to the 2014 total public spending on health. The age profile is presented in Figure 5.1 and shows the typical “J” shape: after the first years of life, it declines with age and reaches a level three times lower in the group aged 10-14 years. It increases afterwards at a slow pace until the group aged 35-39 years. At ages older than 40, per capita spending increases faster, reaching values for the group aged 50-54, which are similar to those of the age group 0-4 years. The per-capita value keeps increasing until it doubles by the end of the life cycle.

Source: Authors' calculations based on Turra, Queiroz, and Mason (2016[7]), "New estimates of intergenerational transfers for Brazil: 1996-2011", NTA project, WP16-03, https://ntaccounts.org/web/nta/show/Working%20Papers.
Results
Table 5.2 shows that health spending is projected to increase substantially over time due to demographic changes in Brazil. Estimates point to a 40% increase until 2050, assuming per capita spending by age remains fixed at the current levels.
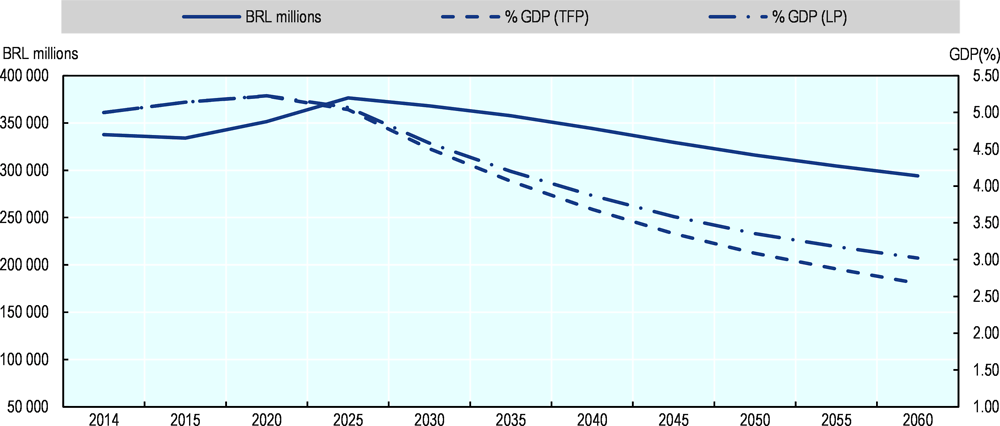
Figure 5.2 shows the results for the evolution of health spending in 2016 BRL millions and as a percentage of GDP. The estimates indicate that total public health expenditure, as a share of GDP, will peak in 2020 and later decline, due to the potential GDP growth. These projections are lower than other estimates published earlier, such as those by Miller and Castanheira (2013[19]), because of assumed GDP growth. Caution is necessary when interpreting these results since, as mentioned before, the age profile of health spending may change over time as the economy grows. Public health spending in Brazil is still low when compared to other countries and may increase faster than predicted by population ageing if the per capita age profile becomes relatively older. Currently, Brazil spends a lower share of GDP compared to OECD countries because of its use of less advanced (and cheaper) medical technology, the absence of long-term care (LTC) provision, and the different roles played by public and private health systems.

Source: Authors' calculations.
The projection of public education expenditures combines three different components: public spending per student and educational level, enrolment rates and demographic projections.
Public spending per student
The Instituto Nacional de Estudos e Pesquisas Educacionais Anísio Teixeira (INEP) periodically publishes data on direct public spending per student. According to Table 5.3, spending on primary and secondary education more than doubled between 2006 and 2014 in real terms. However, the values for lower levels of education still represent only a fraction of the expenditure per student on tertiary education. In these projections, it is assumed that spending per student remains fixed in real terms.
Enrolment rates and excluded students
The proportion of individuals by age group, who are enrolled in each school level, and the government enrolment targets, set out in the Plano Nacional de Educação (PNE), are two important determinants of the enrolment rates, the second component in our projections. One standard measure of the proportions enrolled is the gross enrolment rate for each education level, as computed by the number of students of all ages enrolled at the educational level, divided by the official age group's total population for that level. An alternative measure, which is also frequently employed is the net enrolment rate for each level, given by the number of enrolled students in the official age group for the educational level, divided by the total population of the official age group for that level. According to Table 5.4, only primary education has become universalised in Brazil, with a 93% net enrollment rate. The net enrolment rates are significantly lower in early childhood (pre-primary), at around 56%, and secondary education, at 57%.
Differences between gross and net enrolment rates represent children outside the official school age group. Table 5.5 shows the number of children who should be enrolled in school, given their ages, but who are not. The data show that the most significant demand pressure will be to incorporate the 7.7 million children between birth and three years old into the system. Other significant challenges will be to include 1.6 million teenagers (15 to 17 years old) in secondary education, as well as to increase tertiary enrolment rates. The proportion outside school is much lower at ages 4-5 (less than a million), and among children between the ages of 6 and 14 (only 390 000).
Methodology
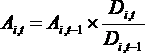
The number of students projected for each educational level i in year t  is obtained by multiplying the net enrolment rate in 2015 (Table 5.5) by the demographic growth rate of each age group, represented by the ratio
  (where
  is the population of age i in date t).
With no further adjustments, the projected number of students per education level would be given by:
 (4)
(4)
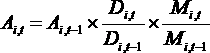
However, considering a foreseeable increase in net enrolment rates with the reduction of out-of-school children and of children outside the official school age groups, the enrolment targets of the PNE are incorporated, represented in the equation by the target number of students for each education level i in the period t  , as an additional factor. Therefore, equation (4) becomes:
 (5)
(5)
The PNE envisages the universalisation of education for ages 4 to 14. It also plans to increase net enrolment rates to 85% for youth aged 15-17. The PNE applies to public education. Therefore, a target of 10% at the tertiary level for the population between the ages of 18 and 24 is chosen. Finally, total spending in public education is obtained by multiplying the projected number of students per education level by the respective spending per student and level (Table 5.3), as follows:
 (6)
(6)
Results
Table 5.6 shows the projection of education spending in 2016 until 2060 (in real terms). The total amount will decrease in the next decades due to the decline in birth rates. However, the projected spending will vary for each education level, depending on the combination of projected net enrolment rates and demographic growth by age. Tables 5.7 to 5.9 break down the projected public spending on education into the different government levels: federal, state, and local (municipalities).
Table 5.7 shows that the reduction in education spending, driven by demographic changes, will be significant for the federal government, reaching about 22% by 2060.
Table 5.8 shows state-level spending on public education. State spending will be reduced by 18% between 2014 and 2060. Secondary enrolment rates are higher in state institutions, allowing a more substantial reduction in spending due to the demographic changes at these levels. The only exception is kindergarten spending, which will increase by 63% because of the much lower initial coverage.
Finally, Table 5.9 shows the projections for public spending at the local level. Municipalities will have the lowest reduction in public spending on education across the different government levels (only 5%) because of the sharp mandatory increase in kindergarten coverage.
Figure 5.3 shows that spending on education will drop after 2020, particularly as a percentage of GDP, due to the projected economic growth. Therefore, public education expenditure may not be a critical restrictive factor on government budgets in the future.
Source: Authors' calculations.
A larger decline in spending on public education in Brazil is projected than the decline projected by Dang, Antolín and Oxley (2001[8]) for OECD countries, despite total expenditure as a share of GDP being about the same size in Brazil and OECD countries (Table 5.10). The difference reflects the fact that Brazil is in an earlier stage of demographic transition, which implies more substantial reductions in the size of its young population in the decades to come.
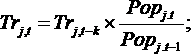
The high share of social security spending by the federal government, combined with the rapid demographic transition, motivated several studies on the financial sustainability of the pension systems in Brazil. There are several papers on the topic, such as Cechin and Cechin (2007[21]), Caetano (2008[22]; 2013[23]; 2014[24]), Costanzi (2017[25]), Giambiagi and Cechin (2011[26]), Tafner (2017[27]) and Tafner, Botelho and Erbisti (2013[28]). The social security projections developed in this chapter are based mainly on the transition of the age structure and accounts only partially for other factors. This simplification does not lead to a significant loss of realism in the long run. We will separately project expenditures related to the Social Security General System (RGPS) for private-sector workers, and the Social Security Systems for Public Servants (RPPS). The methodology is similar for both and based exclusively on demographic projections, retirees’ age profiles and the distribution of pensions by age.
Accordingly, for simplicity, the share of retirees by age  is assumed fixed over time, projecting the number of beneficiaries in year t
  by multiplying this share, obtained with 2015 PNAD data, to the number of individuals of age j in year t
 :
:
 (7)
(7)
Assuming that the average value of social security benefits remains constant over time, the total social security expenditure in each period  is projected proportionally to the number of beneficiaries in each period, as given by:
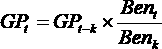 (8)
(8)
Social Security General System (RGPS) for private-sector workers
Table 5.11 shows the results of the projections for the outlays of the Social Security General System. Expenditures will increase by 203% between 2014 and 2060. Considering that under the current model, some workers can retire under the age of 65 (men) and 60 (women), which are the thresholds for retirement by the age criteria, the projection results reflect the high growth rates of the population below these ages. Therefore, for a counterfactual comparison that would reflect the evolution of spending in a scenario where everyone retired exclusively by age, Table 5.11 also presents the projected rise in spending considering only the increase of the population above 65. The comparison of the two projections shows that the increase in spending, if all retirement happens according to the age criteria.
The projection for RGPS expenditures as a share of the GDP (Figure 5.4) shows an increase from 8.3% in 2014 to 15.5% in 2060, revealing the enormous pressure that population ageing will soon pose on the federal budget.

Source: Authors' calculations.
Social Security System for Public Servants (RPPS)
The Social Security System for Public Servants (RPPS) is not exclusively pay-as-you-go, unlike the RGPS. Recent constitutional reforms have partially changed the system to individual accounts (mostly defined contribution plans), particularly for the new generations of workers in the federal government and some state and local governments. Therefore, projecting expenditures based solely on the age structure changes may imply an upward bias and should be taken cautiously. Future revisions of this study will account for the new structure of pensions brought about by upcoming reforms. Table 5.12 shows that RPPS expenditures would increase, under this simplistic scenario of no reforms, by more than fourfold due to population ageing, and RPPS spending could increase from 4.0% of GDP in 2014 to 9.7% by 2060 (Figure 5.5).

Source: Authors' calculations.
Dang, Antolín and Oxley’s (2001[8]) projections for the increase in social security spending for OECD countries range from 3% to 4% from 2000 to 2050. The projections here point to increases in total social security spending in Brazil (RGPS + RPPS) that is about twice as large as the OECD rates. Total social security expenditure could reach 25.4% of GDP in Brazil by 2060, considering only demographic changes (and no effects of recent changes to the RPPS), a number that highlights the urgency for new reforms.
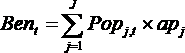
This section measures the impact of the demographic transition on two large public income transfer programmes: Bolsa Família (BF) and Benefício de Prestação Continuada, also known as Lei Orgânica de Assistência Social (BPC-LOAS). The BF is an income transfer programme directed at poverty reduction for families with children and teenagers, with the conditions of obligatory school enrolment and primary health care attendance (e.g. immunisation). The BPC is an unconditional transfer programme that guarantees basic income to Brazil’s elderly population, aged 65 and older, and disabled individuals of any age, whose household per capita income is less than one-quarter of the minimum wage. The projections measure the impact of changes in the population between 0 and 17 years old (for the BF programme) and the population above 65 years old (for the BPC-LOAS programme) on future expenditures for both programmes. For each transfer programme , total spending in year t
  is projected by adjusting for the growth of each age group that is targeted by the programme:
 0 (9)
0 (9)
Bolsa Família
The demographic transition reduces the number and percentage of young age groups in the total population. Thus, a pronounced decline is expected in the Bolsa Familia spending, from 0.5% in 2015 to 0.25% of the GDP in 2060 (Table 5.13).
Benefício de Prestação Continuada (BPC-LOAS)
The spending on the BPC-LOAS programme will follow a different path than the one predicted for the Bolsa Familia Programme since it is focused mainly on the elderly population. From 2014 to 2060, the share of the population aged above 65 will triple, and the total spending will follow a similar path. Figure 5.6 shows that BPC-LOAS expenditures will probably more than double in GDP terms, reaching 1.75% of GDP in 2060.

Source: Authors' calculations.
Population ageing will increase the demand for health and social services related to the care needs of the older population. In addition, the demand for the provision of health services to treat chronic diseases and health treatment for those who are in the final years of life will also increase. These trends will increase the demand for qualified personnel to assist those who require care in daily activities. There is virtually no policy of assistance or government expenditure funding long-term care (LTC) needs in Brazil nowadays; this responsibility is relegated mainly to family members. This kind of care costs will grow more expensive over time as the demographic transition reduces the number of siblings per family. In this section, a preliminary estimate of the costs to comply with the foreseeable demand for such services is provided. Introducing long-term care will require the development of a proper structure and institutions specifically designed for its provision.
According to the existing literature on this subject, e.g. de la Maisonneuve and Oliveira Martins (2014[29]), long-term care differs from health services in general by its very nature. Health care services are services that improve the quality of life, while long-term care services’ primary objective is to provide a comfortable environment for those who have lost their autonomy due to a health condition. Long-term care includes nursing care, social services and services related to the improvement of the patient’s domestic and social tasks. In general, the conditions that determine LTC eligibility are chronic diseases, which lead to health conditions that affect the patient’s mobility and autonomy. These conditions do not allow the patient to perform the basic activities of daily live, including feeding, dressing, or taking a bath, as well as some other basic activities, such as cooking or cleaning the house.
Therefore, the demand for LTC is determined by the occurrence of health conditions that leave the patient dependent on personal care, such as accidents or diseases. In general, there is a higher probability of dependency among elderly populations (Rocha, 2015[30]), which underscores the critical effect that ageing has on family costs. The costs of LTC programmes depend on factors associated with the degree of dependency of the patient, the technology and inputs available, as well as the average income of the country.
Methodology
To project LTC expenditures over time, LTC provision costs are simulated by age and demographic projections. The LTC demand age profile is kept constant in the projections despite indications from other estimations that some variables (e.g. health changes) may transform the age profile in the future (see, for example, Rocha (2015[30]) and Nepomuceno and Turra (2015[31])). The health supplement of the 2008 household survey (PNAD) data is used to measure the degree of dependence of the population. Specifically, we estimate demand by the share of answers to the survey question that asks, “Do you have any difficulty, because of a health condition, to eat, take a shower or go to the bathroom?” (“Normalmente, por problema de saúde, tem dificuldade para alimentar-se, tomar banho ou ir ao banheiro?”). The individuals who answered that they “are not able to” (“não conseguem”) or “have great difficulty” (“tem grande dificuldade”) are considered as those who require long-term care. Figure 5.7 shows the distribution of the population that needs long-term care to perform the activities mentioned above. It shows a sharp increase with age. For those who are 40 years old or younger, the proportion is lower than 2%; it reaches 30% for the population older than 90. Therefore, population ageing will increase the demand for LTC.
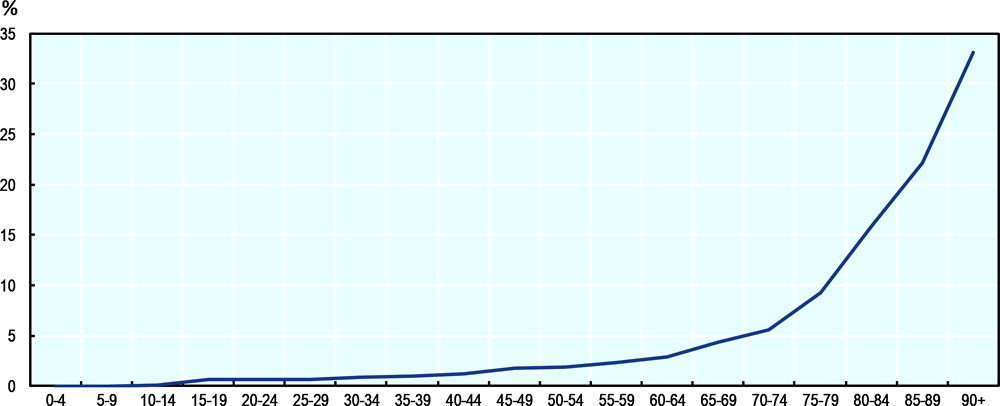
Source: Authors' calculations based on PNAD 2008.
The second component for the projection is the LTC costs per age. In that dimension, age will also be an important variable to determine LTC spending. As direct costs by age estimates are not available for Brazil, those available from other countries are used. Figure 5.8 shows the annual average cost of LTC by age for individuals that need long-term care, as a function of per capita GDP, for the countries of the European Union.

Source: European Union (2015[32]), The 2015 Ageing report: Economic and budgetary projections for the 28 EU member States (2013-2060), European Economy 3|2015, Publications Office of the European Union, Luxembourg, https://ec.europa.eu/economy_finance/publications/european_economy/2015/pdf/ee3_en.pdf.
The average LTC cost per patient younger than 20 years old in the European Union is around 80% of GDP per capita. The value increases gradually until the 50-54 age group, reaching 120% of per capita GDP. It then declines to 60% of per capita GDP at the 85-89 age group. The LTC costs for young adults are associated with accidents and diseases that require expensive treatments, while specialised care for the elderly is related to old age limitations and, thus, comparatively cheaper.
Table 5.14 shows the same data presented in Figure 5.8, as well as LTC costs per patient measured in 2017 BRL thousands, based on 2017 GDP per capita and the Instituto Brasileiro de Geografia e Estatistica (IBGE) projected population. LTC costs per patient would range from BRL 24 667 for the 0-4 age group to BRL 38 858 for the 50-54 age group. Among the elderly, the costs are slightly higher than BRL 20 000.
Using the notation  for the share of the population that requires LTC by age,
  for the LTC average cohort cost, and
  the projected population by age, the total LTC cost for year t is computed as:
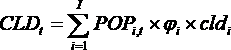 (10)
(10)
It is important to note that, as before, the demographic changes are exclusively relied on to project LTC costs, without considering other factors that could affect the average age profile of LTC costs.
Results
Table 5.15 shows the results of the projections in 2017 BRL based on the values of the second column of Table 5.14 as in equation (10). Table 5.16 shows the same results using LTC costs per age cohort in per capita GDP terms, using the values of the second column of Table 5.14 as in equation (10). Table 5.15 shows that spending on LTC in 2014 was about BRL 87 billion, based on the 2014 population age profile. Demographic changes until 2060 would raise LTC total costs to BRL 207 billion.
LTC spending can also be projected based on the assumption that costs per patient will increase proportionately with GDP per capita. In this scenario, LTC spending would vary from 1.4% of GDP in 2014 to 3.2% of GDP in 2060, a significantly higher rate of increase than the case with no economic growth effects (Table 5.16, 1.9% in 2060).
These projections are also higher than those presented by Rocha and Turra (2016[33]), who used a benefit equivalent of 1.5 minimum wages and estimated total LTC expenditure equal to 1.3% of GDP in 2033. The projections presented in Table 5.17 are in line with OECD LTC projections for the European Union.
This section presents a summary of the projected public expenditure on education, health, social security, social transfer programmes, and long-term care services. On the one hand, the projections indicate that expenditure on public education and the larger social transfer programme, Bolsa Família, tend to decline, reducing the burden for governments in the future (Table 5.18). The main explanation is the decline in the absolute and relative size of the young population. On the other hand, expenditure on social security (private workers), BPC-LOAS and LTC will most likely increase in the future because of population ageing. Spending on pensions (for private-sector workers) will rise from 8.3% of GDP in 2014 to 15.5% in 2060, a 7-percentage-point increase, under the present rules for retirement. At the same time, the BPC-LOAS will increase from 0.8% to 1.7% of GDP, and the development of long-term care provision in Brazil will add new spending ranging between 1.9% (LTC measured in real terms) to 3.2% (LTC measured in per capita GDP terms) of GDP in 2060.
Total health spending tends to increase until 2020 and then decreases gradually until 2060, reaching 3.4% of GDP. It is important to emphasise that the projections for health expenditure may be too low because the changes in the age profile of per-capita spending that may occur with GDP growth, particularly at older ages, are not accounted for.
The projected impact of the demographic transition on the budget shows a trajectory of rising pressure similar to that described by Dang, Antolín, and Oxley (2001[8]) for OECD countries. However, the composition of future expenditure will be different in Brazil compared to OECD countries. The OECD estimates show a 0.9% of GDP reduction in education and child transfers, a 3.3% GDP increase in social security and a 3.3% of GDP increase in long-term care.
There are some special tendencies for different expenditure categories regarding local government levels. For the municipalities (Table 5.19), public expenditure will decrease by 0.4% of GDP from 2014 to 2060. The main driver is the reduction in the number of students and the consequent decline in spending on education by about 1 percentage point of GDP. Health spending will remain almost constant, and expenditure on social security for public servants will increase by 0.7% of GDP (assuming no effects from pension reforms).
Also, in the case of state (Table 5.20) and federal (Table 5.21) governments, public expenditure will increase only on the public pension system and transfers to the old. State government spending on education will be cut in half (as a share of the GDP), and health expenditure will stay about the same. Expenditure on pensions for public servants will become the main source of fiscal pressure. At the federal level, increases in total spending caused by demographic changes will be the largest. Population ageing will increase transfers to the elderly (both pension systems and other income transfers) by 9.3% of GDP until 2060. In addition, long-term care will add another 1.9% of GDP. Spending on health will show a neutral tendency, whereas the decline in education and Bolsa Família expenditure will not be enough to reduce the increasing fiscal pressure.
In this chapter, the effects of the demographic transition on public social expenditure in Brazil were examined. The estimates predict an increase of about 10.8% of GDP between 2014 and 2060 for all public functions together (that may reach 12.7% of GDP with the implementation of long-term care services), as a result of population ageing. The projections indicate that social security spending, together with services (including health) and other income transfers to the elderly, will represent about 32% of the Brazilian GDP in 2060. By all standards, that is a much larger share of GDP than the corresponding shares for OECD countries, which are at more advanced stages of the demographic transition. That contrasts to the relatively low level of expenditure on health services in Brazil in comparison with OECD countries, which nevertheless cannot be justified by demographic differences.
One should interpret the results with caution since there are some methodological caveats. First, income growth and the demand for better health and education services will probably increase the pressure on the government for the allocation of more resources to these areas, implying higher costs by age. Therefore, one should take the education and health spending projections as lower bounds concerning future demands. Also, pension reforms have already started to change the structure of social security in Brazil, with consequences for the distribution of beneficiaries by age. For instance, in the case of the public servants’ system, the federal government has already implemented defined contribution plans for the new generations of workers. There is also a broad reform under discussion in the Brazilian Congress regarding the private-sector workers’ system, which will change eligibility criteria and the calculation of the benefits. Therefore, the projections of pensions represent upper bounds for future spending developments.
References
[3] Barbosa Filho, F. et al. (2014), Transição Demográfica, Oferta de Trabalho e Crescimento Econômico no Brasil.
[11] Berestein, C. and S. Wajnman (2008), “Efeitos da estrutura etária nos gastos com internação no Sistema Único de Saúde: uma análise de decomposição para duas áreas metropolitanas brasileiras”, Caderno de Saúde Pública, Vol. 24/10, pp. 2301-2313.
[15] Brockmann, H. and J. Gampe (2005), “The cost of population ageing: Forecasting future hospital expenses in Germany”, MPDIR Working Paper, Max Planck Institute for Demographic Research, Rostock.
[22] Caetano, M. (ed.) (2008), Previdência Social no Brasil: debates e desafios, Ipea, Rio de Janeiro.
[24] Camarano, A. (ed.) (2014), Dinâmica Fiscal da Previdência Social Brasileira, Ipea, Rio de Janeiro.
[1] Carvalho, J. and L. Wong (2008), “A transição da estrutura etária da população brasileira na primeira metade do século XXI”, Cad. Saúde Pública, Vol. 24/3.
[25] Costanzi, R. (2017), Reforma da Previdência: Análise da PEC287/2016, Rio de Janeiro.
[8] Dang, T., P. Antolín and H. Oxley (2001), “Fiscal Implications of Ageing: Projections of Age-Related Spending”, OECD Economics Department Working Papers, No. 305, OECD Publishing, Paris, https://dx.doi.org/10.1787/503643006287.
[29] de la Maisonneuve, C. and J. Oliveira Martins (2014), “The future of health and long-term care spending”, OECD Journal: Economic Studies, Vol. 2014/1, https://dx.doi.org/10.1787/eco_studies-2014-5jz0v44s66nw.
[32] European Union (2015), The 2015 Ageing report: Economic and budgetary projections for the 28 EU member States (2013-2060), Publications Office of the European Union, Luxembourg, https://ec.europa.eu/economy_finance/publications/european_economy/2015/pdf/ee3_en.pdf.
[12] Evans, R. (1985), “Illusion of necessity: Evading responsibility for choice in health care”, Journal of Health Politics, Policy and Law, Vol. 10, pp. 439-467.
[23] Giambiagi, F. and C. Porto (eds.) (2013), Reforma previdenciária, cedo ou tarde, Elsevier, Rio de Janeiro.
[26] Giambiagi, F. and C. Porto (eds.) (2011), Previdência: Em nome dos filhos, Editora Campus, Rio de Janeiro.
[4] Lee et al. (eds.) (2011), Idiosyncrasies of intergenerational transfers in Brasil, Edward Elgar, Northampton.
[18] Mason, C. and T. Miller (2017), “International projections of age specific health care consumption: 2015-2060”, The Journal of Economics of Ageing.
[17] Miller, T. (2001), “Increasing longevity and Medicare expenditures”, Demography, Vol. 38/2, pp. 215-226.
[19] Miller, T. and H. Castanheira (2013), “The fiscal impact of population aging in Brazil: 2005-2050”, Revista Brasileira de Estudos Populacionais, Vol. 30, pp. S5-S23.
[31] Nepomuceno, M. and C. Turra (2015), “Tendências da expectativa de vida saudável de idosas brasileiras, 1998-2008”, Revista de Saúde Pública, Vol. 49/1.
[10] Noronha, K. and C. Turra (2013), Estudo sobre o pacto intergeracional no setor privado de saúde em um cenário de envelhecimento da população. Relatório de pesquisa apresentado à Agência Nacional de Saúde e OPAS (Organização Pan-Americana de Saúde), Cedeplar, UFMG.
[20] OECD (2018), Education at a Glance 2018: OECD Indicators, OECD Publishing, Paris, https://dx.doi.org/10.1787/eag-2018-en.
[16] Raitano, M. (2006), “The impact of death-related costs on health-care expenditure: A survey”, ENEPRI Research Report, Vol. 17.
[9] Reis, C., K. Noronha and S. Wajnman (2016), “Envelhecimento populacional e gastos com internação do SUS: uma análise realizada para o Brasil entre 2000 e 2010”, Revista Brasileira de Estudos de População, Vol. 22/2, pp. 591-612.
[30] Rocha, A. (2015), Custos com benefícios para o financiamento de cuidados de longa duração para idoso com dependência: estimativas e projeções para o Brasil, Departamento de Demografia, Cedeplar, UFMG.
[33] Rocha, A. and C. Turra (2016), “Idosos com dependência no Brasil: estimativa de custo com política pública para o financiamento de cuidador”, Revista Brasileira de Economia Doméstica, Viçosa, Vol. 27/2, pp. 5-28.
[27] Tafner, P. (2017), Algumas considerações sobre o sistema previdenciário brasileiro e reforma, Centro Cultural da FGV, Rio de Janeiro.
[28] Tafner, P., C. Botelho and R. Erbisti (2013), “A previdência brasileira e mudanças demográficas (Convidado a publicar)”, Cadernos de Educação, Vol. 25, pp. 221-243.
[21] Tafner, P. and F. Giambiagi (eds.) (2007), Desequilíbrios: Causas e Soluções, Ipea, Rio de Janeiro.
[5] Turra, C. (2000), Contabilidade das Gerações: riqueza, sistema de transferências e consequências de mudanças no padrão demográfico, CEDEPLAR/UFMG.
[6] Turra, C. and B. Queiroz (2006), “Las Transferencias intergeneracionales y la desigualdad socioeconomica en el Brasil: un analasis inicial”, Notas de Poblacion, Vol. 80, pp. 65-98.
[7] Turra, C., B. Queiroz and A. Mason (2016), “New estimates of intergenerational transfers for Brazil: 1996-2011”, NTA project, No. WP16-03, https://ntaccounts.org/web/nta/show/Working%20Papers.
[2] United Nations (2019), “World Population Prospects: The 2019 Revision”, Department of Economic and Social Affairs, Population Division.
[14] Werblow, A., S. Felder and P. Zweifel (2007), “Population ageing and health care expenditure: A school of “red herring”?”, Health Economics, Vol. 16, pp. 1109-1126.
[13] Zweifel, P., S. Felder and M. Meiers (1999), “Ageing of population and health care expenditure: A red herring?”, Health Economics, Vol. 8/6, pp. 485-96.
Note
← 1. Demographic changes affect capital demand and supply, interest rates, long-term care supply, insurance and housing markets, just to mention some other demographic transition effects.