Chapter 1. Numbers and locations of Romanian emigrants
This chapter establishes the total numbers of Romanian-born emigrants residing in OECD countries. The main destination countries of Romanian emigrants are identified, and the chapter describes their composition by age and gender. Changes in numbers and locations between 2000/01 and 2015/16 are discussed. Comparisons are made notably between Romanian-born individuals and Romanian citizens living abroad as well as between Romanian emigrants and other emigrants from major origin countries or from neighbouring comparison countries. The chapter also presents evidence on emigrants’ reasons for migration and on international Romanian students.
The statistical data for Israel are supplied by and under the responsibility of the relevant Israeli authorities. The use of such data by the OECD is without prejudice to the status of the Golan Heights, East Jerusalem and Israeli settlements in the West Bank under the terms of international law.
Note by Turkey: The information in this document with reference to “Cyprus” relates to the southern part of the Island. There is no single authority representing both Turkish and Greek Cypriot people on the Island. Turkey recognises the Turkish Republic of Northern Cyprus (TRNC). Until a lasting and equitable solution is found within the context of the United Nations, Turkey shall preserve its position concerning the “Cyprus issue”.
Note by all the European Union Member States of the OECD and the European Union: The Republic of Cyprus is recognised by all members of the United Nations with the exception of Turkey. The information in this document relates to the area under the effective control of the Government of the Republic of Cyprus.
After several waves of emigration, the population of Romanian emigrants residing in OECD countries has become very heterogeneous and geographically dispersed. Most surveys can therefore only cover a part of this diaspora and their information is limited to only some destination countries, to a low number of observations and to certain characteristics. The data used in this chapter are based on censuses in OECD countries and are thus representative of all Romanian emigrants in these countries. This allows for analyses that are both detailed and comparable across destination countries. The results of these analyses can therefore serve as a reliable empirical basis for the development of initiatives and policies targeting the Romanian diaspora.
Historical context of Romanian emigration to the OECD
Emigration from Romania has a long history. Communities of ethnic Romanians were present outside of Romania prior to the middle of the 20th century, but this review will concentrate mostly on the country’s more recent migration experience since the beginning of the 21st century. Nonetheless, it is instructive to establish the historical context for current patterns of Romanian emigration, many of which have ties to previous periods of mobility.
Romanian emigration was tightly controlled between 1950 and 1989 (Mereuta, 2013[1]). Exit visas made it difficult for Romanians to leave the country, and very low emigration (with some exceptions, as was the case of Romanian Jews emigrating to Israel, see Box 1.3) was the norm. The Romanian Revolution of 1989 led to the lifting of emigration restrictions and a subsequent increase in emigration in the early 1990s. Main destination countries were Germany, Hungary and Israel. Students and business people also sought new opportunities abroad (Mereuta, 2013[1]). During the late 1990s, the United States and Canada became prominent destinations for Romanian emigrants (Sandu, 2005[2]) as overall Romanian emigration decelerated (Mereuta, 2013[1]).
The dawning of the 21st century brought with it significant changes to Romanian emigration patterns. Romanians had increasing access to mobility opportunities as Romania sought closer ties with the European Union. The accession of Romania to the European Union in 2007 represented a turning point in Romanian emigration. While some restrictions on free mobility remained in place as late as 2014, Romanians increasingly have increasingly migrated to other European Union countries such as Italy, Spain and the United Kingdom. Emigration has become a major social and economic phenomenon for Romania, the population of which has fallen from 22.4 million in 2000 to 19.5 million in 2018, with outward migration responsible for more than 75% of this decline (Matei, 2018[3]).
The fifth-largest emigrant population in OECD countries in 2015/16
Several estimates for the total number of Romanians residing abroad have been advanced in recent years. The figure necessarily depends on who is counted as a Romanian abroad (see Box 1.1 for a discussion of competing definitions). In this review, the terms “Romanian emigrants” and “Romanian diaspora” are reserved for persons who were born in Romania but reside abroad. Censuses carried out across OECD countries establish that close to 3.4 million Romanian emigrants aged 15 and above resided in OECD countries in 2015/16 (see Box 1.2 for a description of this and other data sources used in the review). When 180 000 Romanian-born children aged below 15 are also counted, the total of Romanian emigrants of all ages reaches 3.6 million. However, these children cannot (yet) play a role in the economic development of Romania, and the available data sources do not systematically cover children of this age. Therefore, adult Romanian emigrants (aged 15 and above) will be the reference group in this review’s analyses and in comparisons with other emigrant population.
Romanian emigrants were the fifth largest group of emigrants residing in OECD countries, as shown in Figure 1.1. In 2015/16, they accounted for 3% of all emigrants in the OECD area (see Annex Table 1.A.2). A comparable number of emigrants originated from Germany or the United Kingdom (both around 3.4 million emigrants). If one excludes OECD origin countries (Mexico and Poland), the Romanian diaspora was the third largest behind those from China and India.
According to available published estimates, more than 97% of Romanian emigrants worldwide live in OECD countries. The population of Romanian emigrants living in non-OECD countries numbers fewer than 60 000 and about 57% of this group resides in non-OECD EU-member countries such as Cyprus (41% of the non-OECD total) and Bulgaria (13%). Serbia, Ukraine and the Russian Federation each host an additional 7% of the non-OECD total, while Moldova is home to about 3%. Non-European non-OECD countries are also home to some Romanian emigrants. Argentina and South Africa each account for about 4% of the non-OECD total of Romanian emigrants, while about 3% reside in Brazil.
There is no single definition that captures all those who might reasonably be regarded as Romanians abroad. The definition most frequently used in the context of emigration identifies “Romanians abroad” as persons who were born in Romania but reside abroad. The main alternative is to identify “Romanians abroad” as Romanian citizens who reside abroad.
Both definitions have advantages and disadvantages. The group of Romanian-born persons does not include individuals who were born elsewhere but hold Romanian citizenship, such as children of Romanian citizens abroad or persons who acquired Romanian citizenship but do not live in Romania. This definition does include persons who were born in Romania to foreign parents and who reside abroad. The definition based on Romanian citizenship does not include persons who were born in Romania but either never obtained Romanian citizenship or later gave it up. In the case of Romania, a country with a long history of emigration, the definition based on citizenship could possibly be more relevant than that based on country of birth because the former would allow coverage of the descendants of emigrants.
Due to reasons of data availability, this review employs the definition based on country of birth, but also presents a number of results for Romanian citizens. To clarify in every case which definition is used, the review refers to “Romanian emigrants”, “Romanian-born persons” or “the Romanian diaspora” whenever the definition based on country of birth is used. Those who hold Romanian citizenship are always referred to as “Romanian citizens”. The two groups strongly overlap: many Romanian citizens abroad were also born in Romania, and vice versa.
With this terminology, the group of Romanian emigrants represents the first generation of emigrants – those who were themselves born in Romania. The “second generation” comprises the children of the first generation: persons who were themselves born abroad but have at least one parent born in Romania. Employing this definition, the review offers some analyses and insights on the children of Romanian emigrants (see e.g. the end of this chapter).
The available data sources (see Box 1.2) provide much less information on Romanian citizens than on Romanian emigrants. In particular, Romanian citizens who were not born in Romania cannot be identified in all OECD countries. As a consequence, the total number of Romanian citizens who reside in OECD countries cannot be established. For countries in the European Union, it is possible to identify persons who hold no other citizenship than that of Romania but were not born in Romania. As this group is found to be small (see below), the total number of Romanian emigrants and the total number of Romanian citizens abroad might be very similar.
The available data do allow determining the composition by citizenship for the group of Romanian emigrants (see below). Only one citizenship is recorded for each person. When a person is a citizen of the OECD country of residence, this citizenship is often recorded. It cannot be verified how many of these persons are also citizens of Romania. However, one can assume that nearly all Romanian emigrants are also Romanian citizens because Romanian citizenship is normally acquired at birth and can be lost or given up only in exceptional circumstances. This implies that Romanian emigrants recorded as citizens of OECD countries normally hold dual nationality.
A caveat arises from using the place of residence in these definitions: persons who were born in Romania, live there, but work abroad are not counted as Romanian emigrants; likewise for Romanian citizens. This concerns in particular residents of Romania who engage in temporary or seasonal work in OECD countries. While temporary and seasonal workers are rarely thought of as emigrants, their number can be large.
The definitions of other terms and variables used in this review are listed in Annex Table 1.A.1.
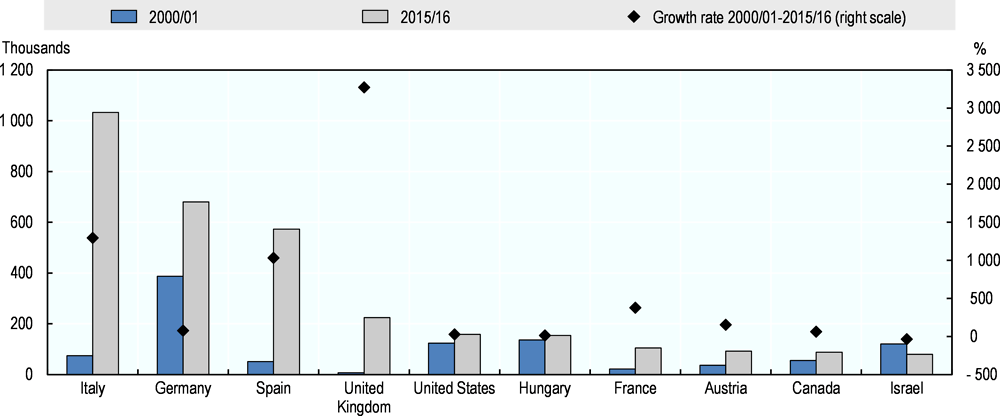
From a level of close to 1.1 million in 2000/01, the number of Romanian emigrants in the OECD grew by 2.3 million persons over the years to 2015/16, which translates into a an increase of over 200% (see Figure 1.1). During this period, the population of Romanian emigrants overtook the number of emigrants from a number of countries, including Germany, Italy and Turkey. The relative growth of the Romanian emigrant population was high, as no emigrant population in the top ten had a higher percentage increase. The next highest percentage increase was for emigrants from India (139%). The relative growth of the Romanian emigrant population was also well above the percentage increase for all origin countries shown in Figure 1.1 (49%).
Most of the growth (1.1 million persons) in the Romanian emigrant population occurred between 2005/06 and 2010/11: an increase of 65% over this period raised the total number of Romanian emigrants to 2.7 million in 2010/11 from a population of 1.6 million in 2005/06. Between 2000/01 and 2005/06, the Romanian emigrant population grew by only 500 000 persons, or 45% of the level in 2000/01. Growth in the second half of the decade thus accounted for 70% of the total growth over the ten-year period and 45% of the total growth between 2000/01 and 2015/16. Growth in the Romanian diaspora slowed to 28% between 2010/11 and 2015/16, but still increased by increased by approximately 750 000 emigrants. Growth between 2005/06 and 2010/11 accounted for 46% of the total growth between 2000/01 and 2015/16.
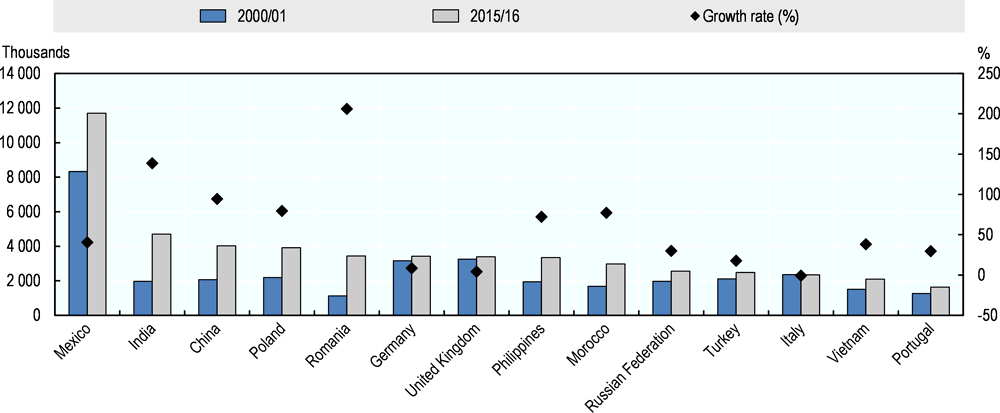
Note: The growth rate is the difference between the levels in 2000/01 and 2015/16, as a percentage of the level in 2000/01.
Source: OECD Database on Immigrants in OECD Countries (DIOC) 2000/01 and 2015/16, www.oecd.org/els/mig/dioc.htm.
Since emigrants are scattered across many countries, comparative analyses on emigrants require cross-country data sets. To ensure that valid comparisons can be drawn between emigrants across countries, the definitions used and the standards of data collection must not differ too much from one country to another. Further, sample sizes must be large enough so that emigrants from one particular country are included in the sample although they typically represent a very small share of the destination country’s population.
The often-unique data sources used for the analyses in this review meet these requirements. Where sample sizes are too small, data will be aggregated across countries to allow at least some general inference. Each data source can provide information on a different aspect of emigration from Romania, as described below for each cross-country data source. The cross-country analyses are complemented by analyses using detailed data sets on only one particular country. At the end of every chapter in this review, links to further information are given for the data sources that have been mentioned in the chapter.
OECD Database on Immigrants in OECD Countries (DIOC), 2000/01, 2005/06 and 2010/11
The Database on Immigrants in OECD Countries (DIOC) covers the OECD destination countries for which data were collected in 2000/01, 2005/06, 2010/11 and 2015/16. The principal sources of DIOC data are national administrative registers and population censuses. In the censuses carried out in 2000/01, virtually all OECD countries collected information on immigrants’ country of origin, so that it became possible for the first time to gain a comprehensive overview of migrant stocks in OECD countries (for more background information on DIOC, see OECD (2008[4]) and Arslan et al. (2015[5])). When censuses were either unavailable or incomplete, data from labour force surveys were used as a substitute.
DIOC contains information on the population aged 15 and above from over 200 origin countries who reside in OECD destination countries. The core variables are country of residence, country of birth, sex and educational attainment. Further variables – age, duration of stay, labour force status and occupation – can be cross-tabulated with the core variables, but not always with each other and not for the data from 2005/06. Data on employment and occupation are by and large available for the population aged 15 and above. In some sections of the review, the focus is on persons of working age, that is those aged between 15 and 64.
Two variables contain information on citizenship. One indicates whether a person is citizen of the country of residence or a foreigner; this variable is available for most OECD countries. A second variable provides more detailed information, but is available for only ten OECD countries, including France, Spain, Italy and Belgium. Dual citizenship is not recorded.
OECD International Migration Database, 2000-16
Largely based on the individual contributions of national correspondents (the OECD Expert Group on Migration), this database covers legal migration flows on a yearly basis. The network of correspondents covers most OECD member countries as well as the Russian Federation, the Baltic States, Bulgaria and Romania. The data have not necessarily been harmonised at the international level and should therefore be interpreted with caution. For example, flows to the United States include only permanent migrants, while others might also include temporary migrants such as seasonal workers, students, or refugees. In addition, the criteria for registering the population and conditions for granting residence permits vary across countries, so that measurements may differ greatly. Finally, irregular migrants are only partially covered.
OECD Programme for the International Assessment of Adult Competencies (PIAAC)
PIAAC is a survey of adults of working age (16 to 65 years) that aims to assess their competencies in an internationally comparable framework. Tests focus on competencies required to participate effectively in society and to function in the workplace. Competencies are tested in literacy, numeracy, and the ability to solve problems in a technology-rich environment. This is complemented by survey questions on how the adults use their skills at home or at work. In 2011/12, the survey was simultaneously implemented in 24 countries, almost all of which are OECD members. In Belgium, only Flanders is covered, and only England and Northern Ireland in the United Kingdom. Seven research institutes have been entrusted with the implementation, and in most of the participating countries, samples included 5 000 individuals.
European Labour Force Survey (EU LFS)
To produce the annual European Labour Force Survey, Eurostat merges household survey data from the 28 member countries of the European Union, three EFTA countries (Norway, Switzerland and Iceland), as well as Turkey and the Former Yugoslav Republic of Macedonia. The stock data in the European Labour Force Survey notably cover the labour force status, age, sex, occupation and educational attainment of individuals aged 15 and above. For migrants, the elapsed duration of stay is recorded as years of residence in the current country of residence. Citizenship information from this data source also allows identifying Romanian citizens who were not born in Romania. Dual citizenship is not recorded and citizenship of an EU country is recorded whenever possible.
In two years (2008 and 2014), the European Labour Force Survey included an ad-hoc module (AHM) that oversampled migrants and introduced a small number of additional questions specifically to explore the situation of migrants and their families. From these data, information on the entry category of migrants is available (labour migrant, family migrant, international student, humanitarian migrant) and can be cross-tabulated with several variables, including education, employment status and duration of stay. However, some European countries (Denmark, Ireland and the Netherlands) are not covered in the ad-hoc module in 2014 and the data for Germany were not available at the time when this review was written.
Based on information about the mother’s and father’s country of birth, children of Romanian emigrants can be identified in the 2014 ad-hoc module. The total for the European Union is only an approximation of the true total of the descendants of Romanian emigrants: members of this population who were born outside the EU country where they reside cannot be distinguished from persons born in Romania to Romanian parents.
Gallup World Poll Data
The Gallup World Poll covers a large range of behavioural and economic topics. It is conducted in approximately 140 countries based on a common questionnaire, translated into the predominant language of each country. Each year since 2006, more than 100 questions have been asked of a representative sample of around 1 000 persons aged 15 and above. In some countries, Gallup collects oversamples in cities or regions of special interest. The surveys collected a total of almost 9 000 observations from Romania (about 1 000 per year from 2005 to 2015). There are in total more than 600 observations on Romanian emigrants who were surveyed in their destination countries between 2005 and 2015 (between 40 and 120 observations in each year); 530 of these observations were collected in OECD countries. Some countries account for many observations (Hungary, Israel, Italy and Spain); hardly any observations were collected in the United States or the United Kingdom.
International Students (UOE data collection)
The UNESCO-OECD-Eurostat (UOE) data collection on education statistics is compiled from national administrative sources, as reported by ministries of education or national statistical offices. To capture student mobility, a distinction is made between resident foreign students – that is to say, foreign students who are resident in the country because of prior migration by themselves or their parents – and non-resident foreign students, who came to the country expressly to pursue their education. International students are defined as students with permanent residence outside the reporting country, and data on non-citizen students are used only where information on non-resident foreign students is unavailable. Data on international students are only available from 2013 onwards.
Romania is the main origin country among its neighbours
Among its neighbouring countries (Moldova, Bulgaria, Serbia, Hungary and Ukraine), Romania was the main origin country for emigrants in OECD countries in 2015/16 (see Figure 1.2). Romanian emigrants alone accounted for almost half (44%) of the 7.8 million emigrants from these countries in 2015/16. Romania also accounted for the largest group of emigrants in 2000/01, but they only made up 26% of the total. Between 2000/01 and 2015/16, the Romanian emigrant population grew at a rate (206%) far above the average growth rate for this comparison group (80%). The emigrant populations of all countries in this group have grown, in almost all cases at lower growth rates than observed for Romanian emigrants. The only comparison country with a higher rate of growth was Moldova (over 400%), which had a much lower emigrant population in 2000/01 (fewer than 100 000 emigrants compared to over 1 million for Romania).
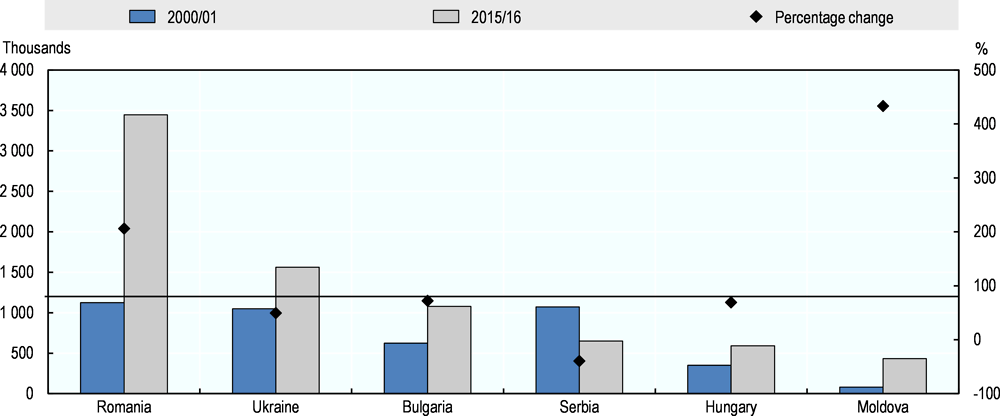
Note: The horizontal line represents the average weighted growth rate for the countries depicted in the figure. Serbia includes Montenegro in 2000/01 but not in 2015/16 due to Montenegro’s independence in 2006.
Source: OECD Database on Immigrants in OECD Countries (DIOC) 2000/01 and 2015/16, www.oecd.org/els/mig/dioc.htm.
The number of Romanian emigrants also appears large in relation to the domestic population of Romania. In 2015/16, Romanian emigrants accounted for 17% of the total Romanian population (see Figure 1.3). While Romania ranked fifth in total emigrant population, it occupied the first place in the ranking of emigration rates for the top ten origin countries of emigrants living in OECD countries. The emigration rate for Romania was higher than the rate for countries with larger numbers of emigrants, such as Mexico, China and India. Romania’s emigration rate was not only greater than that of Poland, a country with a slightly larger population of emigrants, but was also greater than the emigration rates of all of its neighbours. Moldova (11%) and Bulgaria (15%) were the only neighbouring countries with emigration rates greater than 10%.
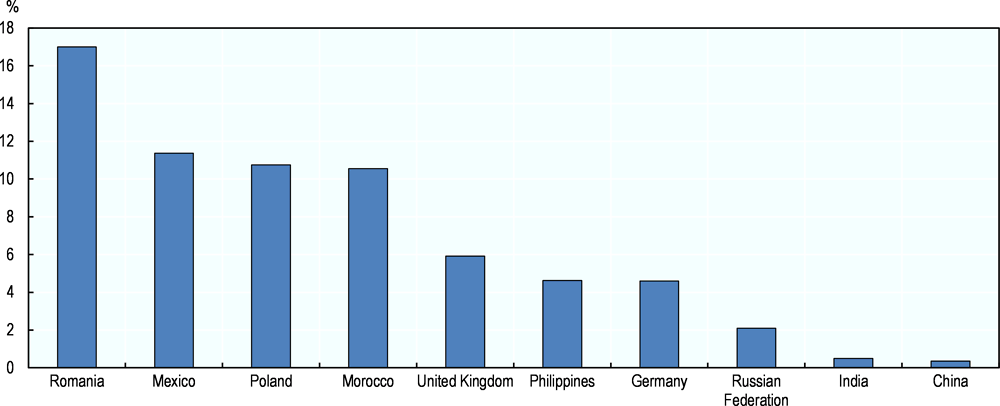
Note: A country’s emigration rate is defined as the number of persons born in the country and residing abroad, divided by the total number of persons born in the country, wherever they reside.
Source: OECD Database on Immigrants in OECD Countries (DIOC) 2000/01 and 2015/16, www.oecd.org/els/mig/dioc.htm and World Population Prospects: The 2017 Revision, United Nations, Department of Economic and Social Affairs, Population Division.
Demographic composition of the Romanian diaspora
More than half of Romanian emigrants are women
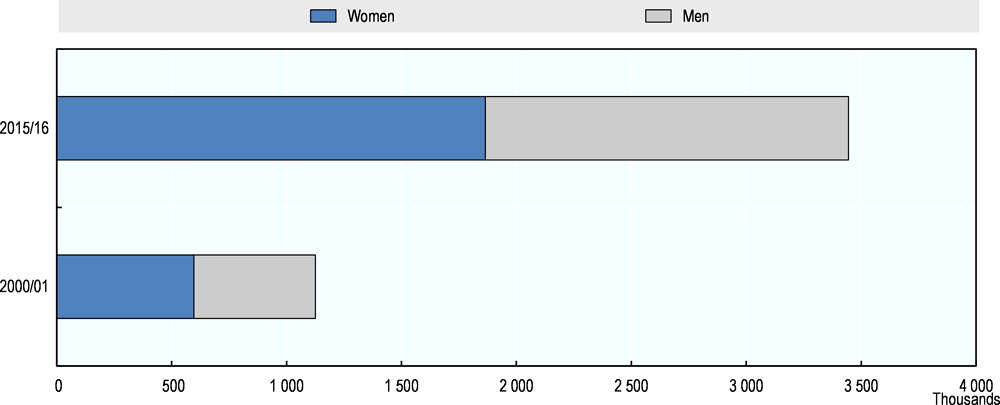
Among Romanian emigrants in the OECD area in 2015/16, women (1.89 million) outnumbered men (1.57 million), as shown in Figure 1.4. In 2000/01, women (597 000) already outnumbered men (529 000), but the share of women increased slightly from 53% in 2000/01 to 54% in 2015/16. This implies that women contributed more strongly to the increase in the overall number of Romanian emigrants: the number of women grew by 213% between 2000/01 and 2015/16, while the number of men grew by 197%.
Source: OECD Database on Immigrants in OECD Countries (DIOC) 2000/01 and 2015/16, www.oecd.org/els/mig/dioc.htm.
While women have consistently made up the majority of the Romanian diaspora in OECD countries, the share of women among Romanian emigrants was lower than that of a number of main origin countries and neighbouring countries (see Figure 1.5). Among the main origin countries for emigrants in the OECD, the Philippines, the Russian Federation, Germany and China had higher shares of women. Figure 1.5 also shows that shares of women among the emigrant populations of some of Romania’s neighbouring countries were higher: over 60% of emigrants from Ukraine and Moldova were women, while the share of women among Bulgarian emigrants was comparable to the share for Romanian emigrants. No neighbouring country had an emigrant population with a majority of men in 2015/16, with all having a share of women over 51% (see Annex Table 1.A.3).

Source: OECD Database on Immigrants in OECD Countries (DIOC) 2000/01 and 2010/11, www.oecd.org/els/mig/dioc.htm.
Nine out of ten Romanian emigrants are of working age, up from only three out of four in 2000
Romanian emigrants who are of working age (i.e. between 15 and 64 years old) may be the most likely to play an economic role in the development of Romania, because they are available for jobs in Romania if they return or because they have acquired skills and networks through their current economic activities. In 2015/16, 92% of adult Romanian emigrants in the OECD area were of working age, as shown in Figure 1.6. Those aged 15-24 accounted for 11%, while those aged 25-64 made up 81%. Because many in the former age group might still be in education, prime working age includes those between 25 and 64 years old. Within the group of prime working age Romanian emigrants, younger age groups predominated: age groups 25-34 and 35-44 each represented 27% of Romanian emigrants, respectively, while age groups 45-54 and 55-64 represented 18 and 9%, respectively.
The predominance of younger age groups underscores a process of rejuvenation among Romanian emigrants between 2000/01 and 2015/16. The share of working-age Romanian emigrants rose by 15 percentage points, from 77% in 2000/01. The share of Romanian emigrants aged 65 and above shrank accordingly, from almost a quarter in 2000/01 to close to 8% in 2015/16. This rejuvenation process has been more pronounced for women, among whom the share in working ages increased more (+16 percentage points) than among men (+14 percentage points). In comparison to emigrants from the other main origin countries or from neighbouring origin countries, the age distribution of Romanian emigrants is one of the youngest (see Annex Table 1.A.2 and Annex Table 1.A.3). Among the main emigrant populations in OECD countries, only that of China had a higher proportion aged 15-24 (16%), and only that of Turkey had a larger share aged 25-64 (82%). Moldova and Bulgaria had similar shares aged 25-64, but slightly larger proportions in the 15-24 age group.

Note: The base quantity does not include Romanian emigrants aged below 15.
Source: OECD Database on Immigrants in OECD Countries (DIOC) 2000/01 and 2015/16, www.oecd.org/els/mig/dioc.htm.
A fifth of Romanian emigrants arrived recently
Emigrants who arrived in their respective destination country within the past five years can be considered recent emigrants. They reflect more recent migration waves and usually are more mobile than settled migrants, often staying only for a few years before returning or moving on. Among Romanian emigrants, DIOC data show that 20% were recent emigrants in 2015/16, up slightly from 19% in 2000/01. Shares of recent emigrants are lower for Ukraine, Serbia and Moldova but higher for Hungary and Bulgaria (see Annex Table 1.A.3). About 51% of recent Romanian migrants were women in both 2000/01 and 2015/16.
Distribution across destination countries
Ten countries host over 93% of Romanian emigrants in the OECD
The overwhelming majority of all Romanian emigrants (93%) observed in the OECD area in 2015/16 resided in only ten countries (see Table 1.1). Italy alone hosted almost a third of all Romanian emigrants in the OECD area: at over 1 million, the number of Romanian emigrants in Italy was considerably higher than in any other country. Large numbers of Romanian emigrants also resided in Germany (680 000) and Spain (573 000). These three countries together accounted for two thirds of Romanian emigrants in the OECD area in 2015/16. Another five countries, each of which hosted more than 100 000 Romanian emigrants, accounted for an additional 23% of the Romanian diaspora: the United Kingdom (225 000), the United States (160 000), Hungary (154 000), Canada (130 000) and France (105 000). Israel, Austria and Belgium each hosted over 50 000 Romanian emigrants in 2015/16, while Ireland, Sweden, Greece and Denmark each recorded between 20 000 and 30 000 Romanian emigrants. As far as the available data allow, Annex Table 1.A.4 lists the numbers of Romanian emigrants across OECD countries, indicating further notable destination countries each with over 10 000 Romanian emigrants: Switzerland, Portugal, Australia, the Netherlands and Norway.
Close to 90% of all Romanian emigrants in OECD countries are in Europe
In 2000/01, European OECD countries already hosted the vast majority of Romanian emigrants (70%), according to DIOC data. While the total number of Romanian emigrants in non-European OECD countries increased by 16 000 (or about 5%) between 2000/01 and 2015/16, the number grew by almost 2.3 million – an almost three-fold increase – in European OECD countries. As a result, the share of Romanian emigrants residing in Europe increased further and approached 90% (corresponding to 3.1 million) in 2015/16. This shift has, not altered, however, the weight of the ten main destination countries: collectively, they accounted for 90% of all Romanian emigrants in the OECD in 2000/01, as much as in 2015/16.
While the Romanian emigrant populations in the United States and Canada experienced increases, the large absolute growth in the Romanian emigrant populations in Italy, Spain, Germany and the United Kingdom allowed European OECD countries to maintain their predominance (see Figure 1.7). Another factor in the predominance of European destinations for the Romanian emigrant population was the decline of almost 35% (-41 000) that occurred in Israel, reflecting the fact that emigration to Israel mainly consisted of one large wave decades ago (see Box 1.3). Excluding Israel, the Romanian emigrant population of non-European OECD countries increased by 27%, or more than 57 000.
The number of Romanian emigrants in Italy increased the most in the period of Romania’s accession to the European Union
Figure 1.7 depicts how the numbers of Romanian emigrants changed in the main destination countries between 2000/01 and 2015/16. Levels in most of these countries grew considerably, but they rose most sharply in the United Kingdom, where the number of Romanian emigrants increased more than 33-fold over this period. This extremely high growth rate is partly the product of the small population of Romanian migrants in the United Kingdom in 2000/01 (less than 7 000), but the absolute growth of 218 000 was the fourth highest for all OECD destinations. Numbers of Romanian emigrants in Italy and Spain also grew sharply between 2000/01 and 2015/16: the Romanian diaspora increased 13-fold in Italy and tenfold in Spain. These large relative increases corresponded to the largest absolute increases for all OECD countries over this period, as the numbers of Romanian emigrants in Italy and Spain increased by 958 000 and 522 000, respectively. Germany recorded the next largest increase in Romanian emigrants, of 293 000 or 75% of its 2000/01 level.
At the end of World War II, approximately 350 000 Jews lived in Romania, the second-largest Jewish population in Europe at that time. Many Romanian Jews emigrated to Israel in the second half of the 20th century. Israel promoted the immigration of Jews and their families through the “Law of Return”, which entitled them to receive Israeli citizenship upon arrival (OECD, 2011[6]). Despite general restrictions on emigration, the Romanian government allowed Romanian Jews to leave for Israel, and between 1948 and 1951 about 120 000 had emigrated, with almost 90 000 leaving between 1950 and 1951 alone (Levy, 1998[7]). While the Romanian government changed its policy on Jewish emigration in 1952, further policy evolutions led to the departure for Israel of an additional 150 000 Romanian Jews between 1952 and 1989 (Oltean, 2011[8]) in return for economic aid from Israel (Ioanid, 2005[9]). While Romania was initially hesitant to allow the emigration of high-skilled Jews, the educational level of Romanian Jewish immigrants in Israel increased dramatically after the Romanian government lifted these restrictions and surpassed that of native Israelis by the 1980s (Cohen, 2009[10]).
A number of other countries recorded significant increases. The numbers of Romanian emigrants almost quintupled (+83 000) in France and more than doubled (+56 000) in Austria. At lower absolute levels, the Romanian diaspora of Canada increased by 62% (+34 000) while that of the United States increased by a third (+34 000).
Given the new mobility opportunities that Romania’s 2007 accession to the European Union created, the increases in the numbers of Romanian emigrants in many EU countries are not surprising. DIOC data from 2005/06 and 2010/11 help clarify the timing of the dynamics of the Romanian diaspora (Figure 1.8). Over 50% of the increase in Romanian emigrants in Italy (+483 000) took place during the period of Romania’s EU accession (between 2005/06 and 2010/11). This growth in the number of Romanian emigrants in Italy accounted for 46% of the increase across all OECD countries during this period. The number of Romanian emigrants in Spain rose during this period by 265 000 or 51% compared to 2000/01, accounting for a quarter of the period’s total increase across all OECD countries. Hungary also saw an increase of over 170 000 between 2005/05 and 2010/11 in the number of Romanian emigrants living there.
While the 2007 accession clearly played a role in the growth of the Romanian diaspora living in Italy, Spain and Hungary, DIOC data also show significant increases in Romanian emigrants in EU countries in other periods. Between 2000/01 and 2005/06, the number of Romanian emigrants living in Spain rose by almost 300 000, a six-fold increase compared to the level of 2000/01. This increase was the largest in Spain in the entire 15-year period between 2000/01 and 2015/16 and accounted for 57% of the total growth of Romanian emigrants in Spain.
Germany, the United Kingdom and France saw the most growth in their Romanian diasporas in the most recent period. The largest increase in the number of Romanian emigrants living in Germany (+220 000) occurred between 2010/11 and 2015/16, accounting for 75% of the growth in this country over the full 15-year period. After growing by about 70 000 between 2000/01 and 2010/11, the population of Romanian-born persons living in the United Kingdom increased by 200% or almost 150 000 between 2010/11 and 2015/16. This increase accounted for almost 70% of the total growth of the Romanian diaspora in the United Kingdom between 2000/01 and 2015/16. In France, almost 60% of the increase (+48 000) in the Romanian diaspora occurred in the most recent five-year period. In contrast, the increase of 330 000 Romanian emigrants in Italy, while the largest absolute increase among all OECD countries between 2010/11 and 2015/16, only accounted for a third of the total growth in Italy over the full 15-year period. The Romanian diaspora in Spain actually shrank by 42 000 during the most recent five-year period, as did the population of Romanian emigrants living in Hungary (-17 000).
Outside of the EU, growth in the numbers of Romanian emigrants in was unevenly distributed over the 15-year period. The Romanian diaspora in the United States grew by 40 000 between 2000/01 and 2005/06 but lost almost 6 000 over the following decade. In contrast, the Romanian emigrant population in Canada grew consistently. While the largest share of the growth in Canada occurred between 2000/01 and 2005/06 (66%), almost 30% of the increase in the number of Romanian emigrants in Canada came between 2010/11 and 2015/16. The Romanian diaspora in Israel declined consistently over the 15-year period but almost half (-19 300) of these losses occurred between 2005/06 and 2010/11.
Source: OECD Database on Immigrants in OECD Countries (DIOC) 2000/01 and 2015/16, www.oecd.org/els/mig/dioc.htm.
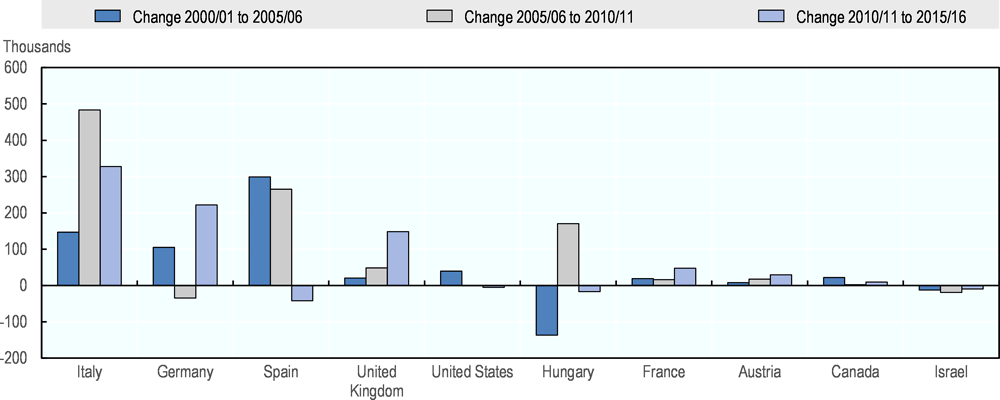
Source: OECD Database on Immigrants in OECD Countries (DIOC) 2000/01, 2005/06, 2010/11 and 2015/16, www.oecd.org/els/mig/dioc.htm.
A high share of recent emigrants (i.e. those who arrived within the previous five years) often reflects rapid increases in the number of Romanian emigrants, as shown in Table 1.1. Almost 60% of Romanian emigrants in the United Kingdom had arrived within the previous five years in 2015/16, reflecting the sharp increase that occurred between 2010/11 and 2015/16. Germany and France also recorded high growth in the most recent five-year period and had shares of recent emigrants approaching one third. In contrast, recent emigrants only accounted for 9% of Romanian emigrants in Italy and 10% in Spain in 2015/16, underscoring the fact that growth in the Romanian diasporas in these countries mainly took place in the decade prior to 2010. Indeed, the shares of the recently arrived among Romanian emigrants in both Italy and Spain approached 40% in 2010/11, while the share of recent emigrants in Germany was only 10%. The data on duration of stay also reflect the uniqueness of the population of Romanian emigrants in Israel, less than 1% of whom had arrived within the past five years.
The number of Romanian emigrants was large enough to make up a significant share of the total foreign-born population in a number of OECD countries in 2015/16 (see Annex Table 1.A.4). In Hungary, over 40% of the foreign-born population were born in Romania, reflecting territorial changes and longstanding patterns of mobility between the two neighbouring countries. In Italy, Romanian emigrants represented 19% of the foreign-born population, while they accounted for 11% in Spain. The corresponding shares in 2000/01 were 3% for Spain and 4% in Italy, reflecting the magnitude of the increase in Romanian emigration towards these two countries. In 2015/16, Romanian emigrants also accounted for large shares of the foreign born in Austria (6%), Germany (6%) and Israel (5%). The share of Romanian emigrants among the foreign-born surpassed 2% in Greece, Ireland, Belgium, Denmark, the United Kingdom, Portugal, the Slovak Republic and Canada. Among the top ten destinations of Romanian emigrants, the Romanian diaspora failed to constitute at least 2% of all foreign-born residents in only the United States and France, due to larger emigrant populations from other countries.
Where emigrants from the same country are sufficiently frequent, such as in the many OECD countries where Romanian emigrants make up a significant share of the foreign-born population, a community centred on the expatriate identity may emerge. Such communities support emigrants by providing goods and services known from the country of origin, but they might slow down the acquisition of the host country language and integration more generally. Chapter 3 considers social ties of Romanian emigrants as one indicator of their integration, and Chapter 4 examines their labour market performance.
Who lives where?
Differences between destination countries
Notable differences exist across the main destination countries in the composition of the Romanian emigrant population by age and gender (see Figure 1.9 and Annex Table 1.A.4). At 58%, the share of women in 2015/16 was highest in Italy. The share of women exceeded 50% in all of the other main destination countries except the United Kingdom, where the share of women was almost 49%, and exceeded 55% in Hungary, Israel and Austria. Outside of the ten principal destinations, Greece, Switzerland and the Netherlands had Romanian emigrant populations with shares of women that surpassed 60%. While the share of women thus varied, they were the majority in almost all main destination countries.
Romanian emigrants in the age group 15-24 made up less than a fifth of all Romanian emigrants in all of the main destination countries. Emigrants in this age group were slightly more frequent in the United Kingdom and France, where they respectively accounted for 16% and 15% of all Romanian emigrants (see Figure 1.9 and Annex Table 1.A.5). By contrast, Romanian emigrants aged 15-24 made up less than 2% in Israel and only 5% in Hungary (see Figure 1.9 and Annex Table 1.A.5). Romanian emigrants aged 65 and above accounted for a share of 66% in Israel and also made up substantial shares in Hungary (23%), the United States (18%), Germany (17%) and Canada (15%), reflecting migration patterns prevailing in the late 20th century (Sandu, 2005[2]). Romanian emigrants of working age (15 to 64) made up the largest majorities in the Italy (87%), Austria (87%), Spain (86%) and the United Kingdom (84%). Annex Table 1.A.5 presents detailed figures by age group and shows that children (aged below 15 years) are relatively frequent in the United Kingdom (12% of Romanian emigrants) and France (11%).

Note: The underlying figures can be found in Annex Table 1.A.4 and Annex Table 1.A.5.
Source: OECD Database on Immigrants in OECD Countries (DIOC) 2015/16, www.oecd.org/els/mig/dioc.htm.
An alternative approach to differences between destination countries is to examine whether the ranking of destination countries differs across groups of Romanian emigrants. For example, do women emigrate to a different set countries than men? This does not appear to be the case: the set of ten main destination countries in 2015/16 was the same for men and women, according to the DIOC data, and their rankings of these ten countries did not differ at all.
There are more pronounced differences between the rankings of destination countries for recent emigrants and settled emigrants. In 2015/16, the largest number of recent Romanian emigrants resided in Germany and the United Kingdom, followed by Italy. Spain and Belgium. Among settled migrants, however, Italy and Spain ranked first and second, and Germany was in the third position ahead of the United States and Hungary. At the same time, the set of the ten main destination countries differed by only two countries between recent and settled emigrants: Israel and Canada were not among the ten main destination countries of recent Romanian emigrants. Instead, Belgium was in the fifth position in the ranking for recent Romanian emigrants, hosting approximately 34 000, while Denmark was in the ninth position on the ranking of destinations for settled emigrants, with almost 15 000. Chapter 2 of this review examines further trends and developments among Romanian emigrants.
Regional distribution of Romanian emigrants in main destination countries
National data sources make it possible to study the location of Romanian emigrants in the three main destination countries and to map their regional distribution. These data sources are the 2015-16 Labour Force Survey (Rilevazione sulle Forze di Lavoro) in Italy, the 2016 Labour Force Survey (Encuesta de población activa) in Spain, the 2016 Register of Foreigners (Ausländerzentralregisters) in Germany, the 2015/16 Quarterly Labour Force Survey in the United Kingdom and the 2016 American Community Survey in the United States. Census data from 2011 at the regional level provided by Eurostat allow a comparison with the geographical distribution of the general population and the overall foreign-born population.
Data from the Italian Labour Force Survey allow examination of the regional distribution of Romanian emigrants residing in this country (see Figure 1.10). These data show that Romanian emigrants are particularly concentrated in the regions of Lazio (over 200 000, or 18% of Romanian emigrants residing in Italy) and Lombardy (about 150 000 or 14% of the total) in the north of the country. More than 100 000 Romanian emigrants are also in Piemonte (13% of the total) and Veneto (11%). This geographical distribution differs from that of the general population of Italy and the foreign-born population. Romanian emigrants are more concentrated in the region of Lazio, which hosts 9% of the general population and 11% of all emigrants. The share of Romanian emigrants is also higher in Piemonte, which represents 7% of the general population and only 8% of emigrants. While Lombardy is the second largest region of residence for Romanian emigrants in Italy, they are less concentrated there than emigrants in general, as 21% of the foreign-born in Italy live in this region.
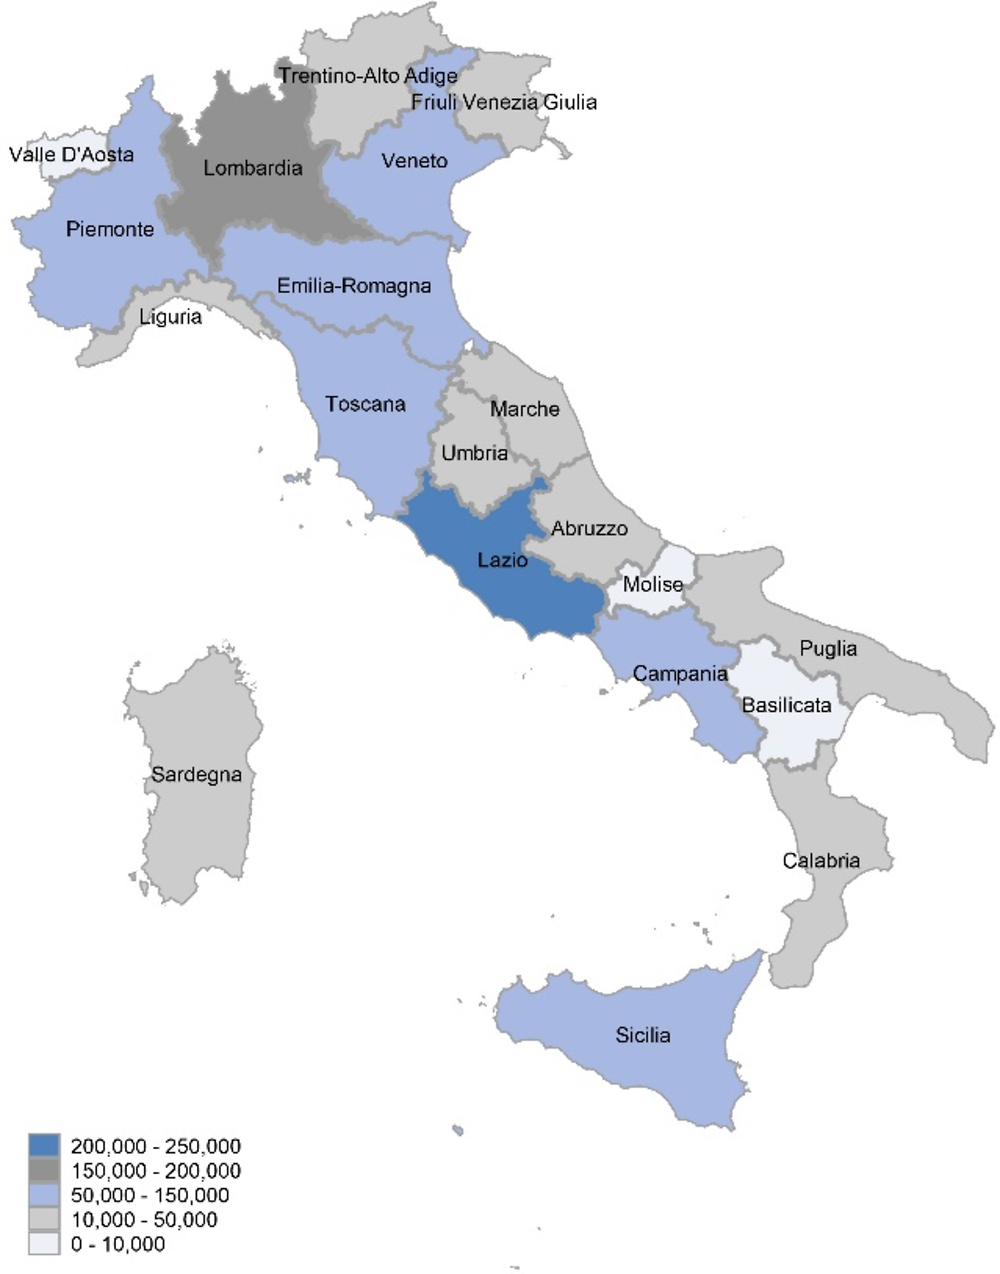
Note: NUTS-2 regions. This map is for illustrative purposes and is without prejudice to the status of or sovereignty over any territory covered by this map.
Source: Labour Force Survey, 2016.
The Spanish Labour Force Survey contains data on the autonomous community of residence of Romanian emigrants (Figure 1.11). The autonomous communities of Madrid and Valencia each host approximately 115 000 Romanian emigrants, or about 40% of the total between them. The autonomous communities of Andalusia and Catalonia are each home to around 76 000 Romanian emigrants, and together account for 26% of all Romanian emigrants in Spain. Almost 10% of Romanian emigrants live in Castilla-La Mancha (59 000) and 9% in Aragón (51 000). No other autonomous community exceeds 5%. Romanian emigrants are more concentrated in the autonomous community of Madrid than the general population (14%) and all foreign-born residents of Spain (18%). The autonomous community of Valencia likewise hosts smaller shares of the general population (11%) and the foreign-born population (14%) than its share of Romanian emigrants. Andalusia is disproportionately home to Romanian emigrants, as it has lower shares of the general (18%) and foreign-born (13%) populations. The concentration of Romanian emigrants is much higher in Castilla-La Mancha relative to the total and foreign-born populations, the shares of which are less than 5%. In contrast, despite the fact that Catalonia hosts a sizable share of Romanian emigrants (13%), both the general population (16%) and emigrants in general (20%) are more concentrated there.

Note: NUTS-2 regions. This map is for illustrative purposes and is without prejudice to the status of or sovereignty over any territory covered by this map.
Source: Labour Force Survey, 2016.
The register of foreigners in Germany makes it possible to study the regional distribution of Romanian citizens living in this country (see Figure 1.12). A quarter of Romanians (about 135 000) live in Bavaria, while Baden-Württemberg (118 000) and North Rhine-Westphalia (102 000) account for 21% and 19%, respectively, of the Romanian population in Germany. Approximately 10% (53 000) of Romanian citizens live in Hesse. Compared to the general and foreign population, Romanian emigrants are far more concentrated in Bavaria: only 16% of both the overall foreign population and the general population live in this federal state. Romanian citizens are also more concentrated in Baden-Württemberg, which accounts for 16% of foreigners and 13% of the general population (13%), and Hesse, where 8% of the general population and 9% of foreigners liv. In contrast, Romanians are less concentrated in North Rhine-Westphalia, which hosts 22% of the total population and 25% of foreigners.
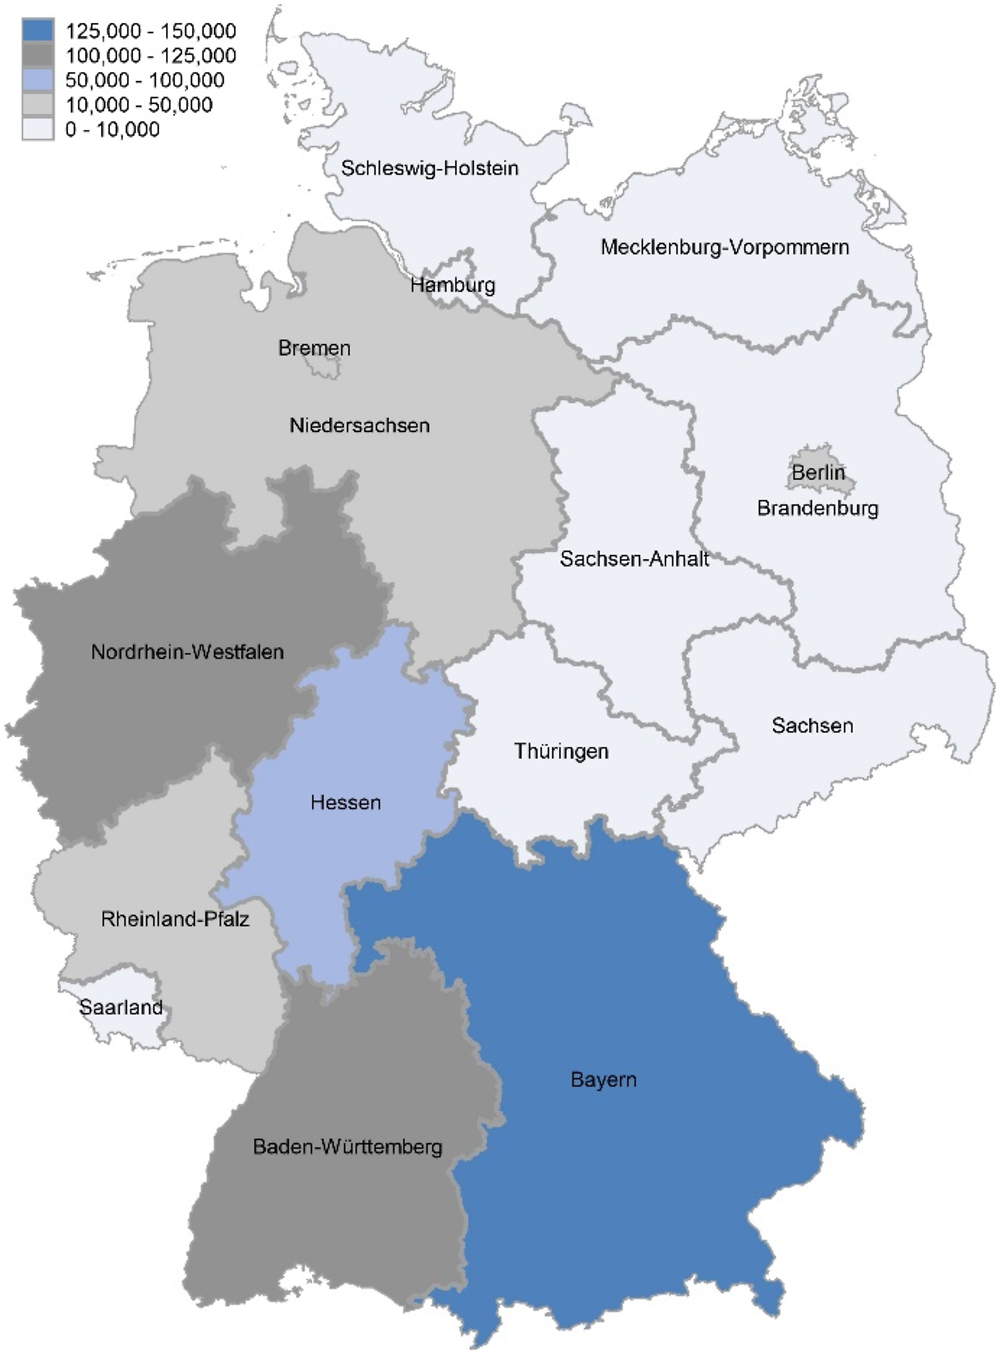
Note: NUTS-1 regions. This map is for illustrative purposes and is without prejudice to the status of or sovereignty over any territory covered by this map.
Source: Foreigners Register, 2016.
The Quarterly Labour Force Survey includes data on the country or English region of residence of Romanian emigrants in the United Kingdom (Figure 1.13). Almost 100 000 Romanian emigrants in the United Kingdom reside in the London region, close to 40% of the total. The neighbouring South East region hosts almost 15% of the total, or more than 37 000 Romanian emigrants. The East Midlands region accounts for about 13% of all Romanian emigrants in the United Kingdom, or almost 32 000. These three regions alone comprise more than two thirds of the Romanian emigrant population in the United Kingdom. Taken together, the English regions host more than 90% of this population. About 7 000 Romanian emigrants live in Wales, 6 500 in Scotland and 3 400 in Northern Ireland. Romanian emigrants in the United Kingdom are more geographically concentrated than the overall foreign-born population and the native-born population. About 37% of the foreign-born population of the United Kingdom live in the London region, compared to only 10% of the native-born population. Lower shares of native-born (14%) and foreign-born (13%) also reside in the South East region. In contrast, almost 12% of the native-born population and 8% of the foreign-born population live in the North West region, compared to only 3% of Romanian emigrants. The native-born population is relatively less concentrated in England, with Scotland, Wales and Northern Ireland accounting for 17%.
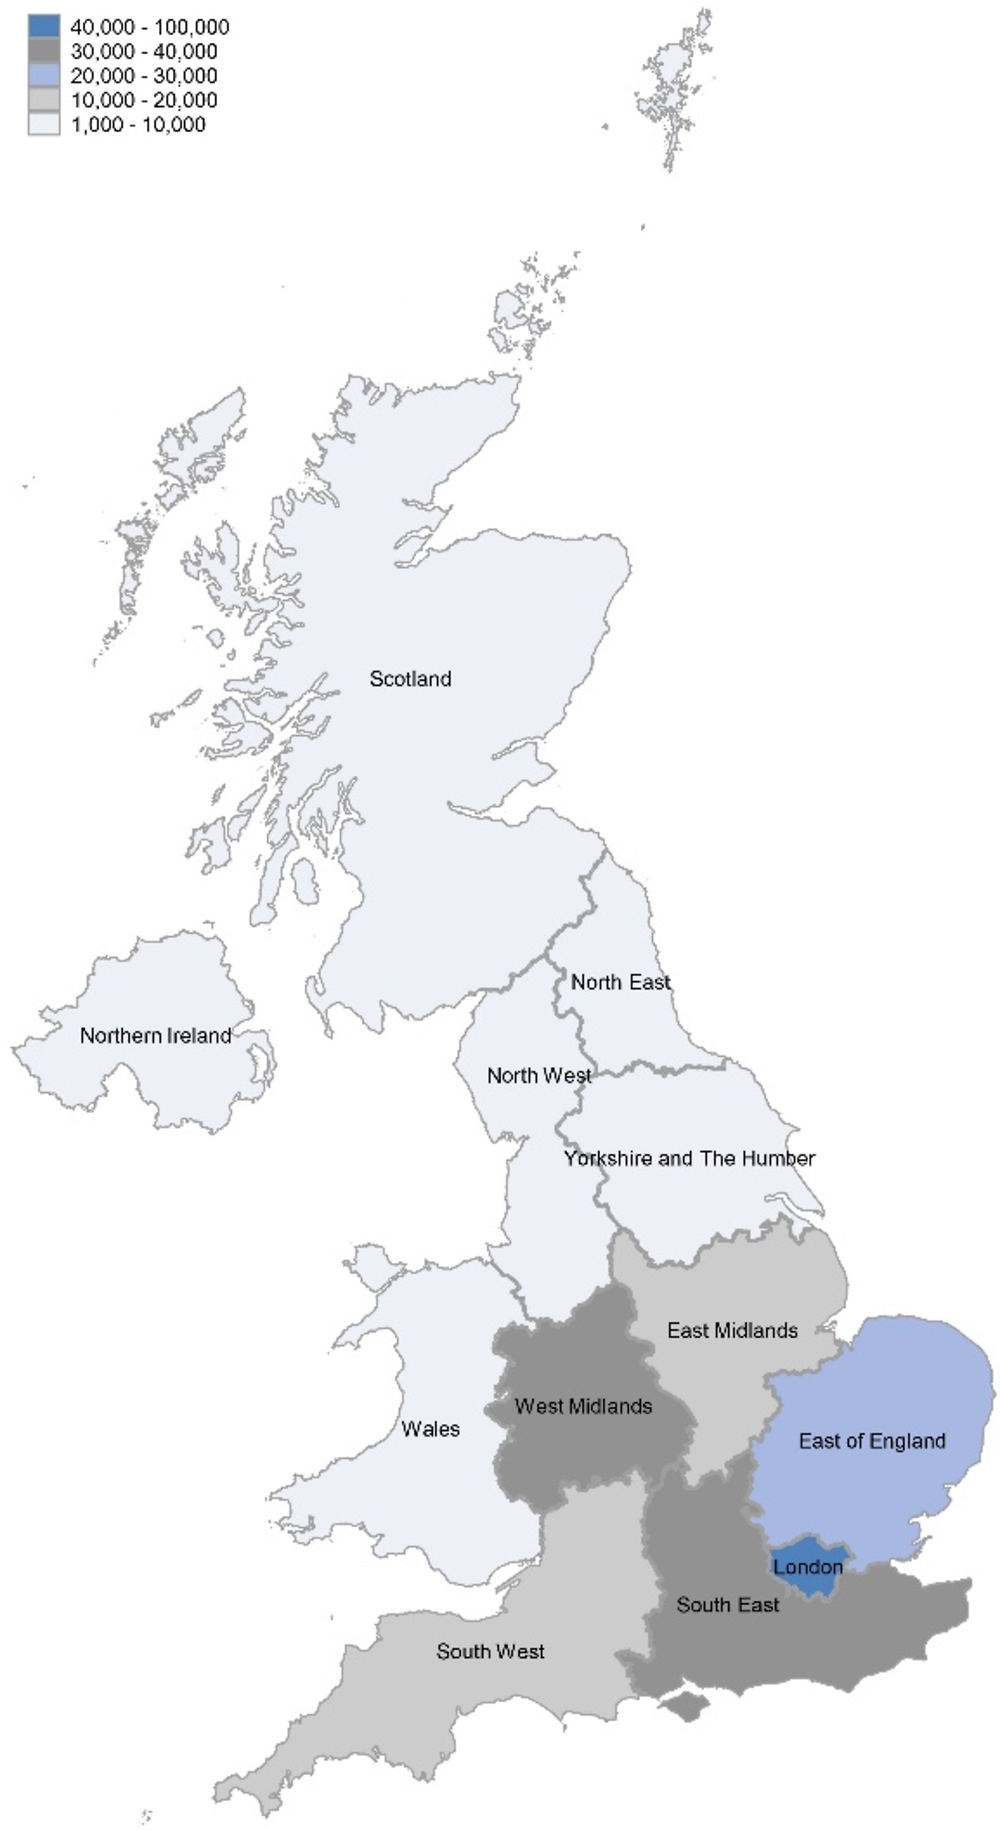
Note: This map is for illustrative purposes and is without prejudice to the status of or sovereignty over any territory covered by this map.
Source: Quarterly Labour Force Survey, 2015/16.
The American Community Survey allows a mapping of Romanian emigrants residing in the United States (Figure 1.14). The states of California (24 300) and New York (21 000) are home to the largest numbers of Romanian emigrants and together account for 28% of the total Romanian emigrant population in the United States. The states of Illinois and Florida each host about 8% of the Romanian emigrants living in the United States, while Michigan is home to 6%. These five states comprise almost half of the Romanian diaspora in the United States. Romanian emigrants are, however, somewhat less concentrated than the general foreign-born population in the United States, as almost a quarter of foreign-born reside in California compared to 15% of Romanian emigrants. Only 10% of foreign born live in the state of New York, though, so Romanian emigrants are more concentrated there. The native-born population is also less concentrated in these two states (10% in California and 5% in the state of New York).

Note: This map is for illustrative purposes and is without prejudice to the status of or sovereignty over any territory covered by this map.
Source: American Community Survey, 2016.
The American Community Survey contains more-detailed information on the place of residence of Romanian emigrants. The Public-Use Microdata Areas (PUMAs) are statistical geographic areas that contain at least 100 000 people and are built on census tracts and counties. Combining PUMAs allows identification of the counties of residence of Romanian emigrants in the United States. More than 40% of Romanian emigrants in California live in two counties in the south of the state: 23% of Romanian emigrants in California live in Los Angeles County, while 19% live in Orange County. Almost 70% of Romanian emigrants in New York state live in New York City, with over 9 000 residing in Queens alone. In Illinois, 45% of Romanian emigrants are residents of Chicago, while 34% live in Cook County. Romanian emigrants in Florida are concentrated in Broward County (29% of the state total), while more than a quarter of those in Michigan live in Oakland County.
Most Romanian emigrants cite employment as the reason for their migration
For Romanians emigrants in the EU (except Denmark, Germany, Ireland and the Netherlands), the motive for migration can be determined from the 2014 ad-hoc module of the European Labour Force Survey (see Box 1.2). Figure 1.15 shows the main reason for migration given by Romanian emigrants in main European destination countries and in the European Union as a whole. These self-declared reasons do not correspond to admission categories or permits, but also include responses from those who arrived as irregular migrants. These distributions do not necessarily reflect the motives that brought Romanian emigrants to the respective destination country, but rather the motives of those who still resided in the destination country in 2014. Chapter 2 presents the available information on migration flows to the main destination countries.

Note: Figures are based on the main reason that Romanian-born respondents in the respective destination country indicate for their last migration. This information is not available for Denmark, Ireland, the Netherlands and Germany, which are therefore not included in the EU average. The category “family” includes accompanying family, family reunification and family formation.
Source: Labour Force Survey (Eurostat) ad-hoc module 2014 on the labour market situation of migrants and their immediate descendants.
Almost two thirds of Romanian emigrants across the European Union cited employment as the reason for their migration (Figure 1.15). While 13% of Romanian emigrants declared that they migrated for employment and had a job before leaving, almost 50% migrated for employment but did not have a job prior to departure. Romanian emigrants in the United Kingdom (75%), Italy (67%) and Spain (63%) were overwhelmingly likely to cite employment reasons, but there were differences between these countries related to whether or not emigrants had a job prior to departure. More than a quarter of Romanian emigrants in the United Kingdom migrated for employment and had a job before arriving there, while half migrated there for employment reasons without a job. Having a job prior to departure was somewhat frequent among Romanian emigrants in Belgium (16%) even though all employment reasons accounted for less than 50% of responses. In contrast, smaller shares of Romanian migrants in Italy (13%) and Spain (11%) had a job prior to departure. While employment was by far the first motivation for migration among Romanian emigrants in these two countries, more than 80% of them arrived without jobs. Less than half of Romanian emigrants in Austria, Greece and Hungary cited employment reasons.
Family was the second most frequent reason given for migration among Romanian emigrants, cited by 31% across the European Union (Figure 1.15). The highest share was in Austria, where more than half (57%) of Romanian emigrants indicated family as the reason for their migration. The proportion migrating for family reasons was close to the average in Italy, Spain, Belgium and Hungary. In contrast, less than a fifth of Romanian emigrants in the United Kingdom and Greece cited family reasons.
More than 90% of the Romanian emigrants in the European Union (see Figure 1.15) cited either family or labour as their main reason for migrating. Accordingly, other motives including humanitarian reasons and unknown motives only account for small shares. Less than 5% of Romanian emigrants in Italy, Austria, Spain, Belgium or the United Kingdom cite “other” motives for their migration, while over a third in Hungary and Greece report “other” or “unknown” reasons. Small shares of Romanian emigrants in the United Kingdom (6%) and Belgium (5%) cited study as the main reason for migration, but the share with study as a motive was less than 2% for the European Union as a whole.
The number of international students from Romania is growing slowly
The total number of international students from Romania enrolled at the tertiary level in OECD countries approached 33 000 in 2016. The number of international students from Romania has increased by 3% since 2013, when it was just over 32 000. By far the largest group of international students from Romania – over 8 000 in 2016 – was enrolled in Italy, followed by 7 200 in the United Kingdom and 3 300 in France (see Figure 1.16). Denmark and Germany each hosted approximately 2 500 Romanian tertiary students, while over 1 000 Romanian students were enrolled in Hungary, the Netherlands, Austria and the United States. The same data for previous years show that numbers of international students from Romania increased in Italy (by 23%, from 6 500 in 2013) and the United Kingdom (by 12%, from 6 400 in 2013), but declined in France (by 7%, from 3 500 in 2013). The number of Romanian-born students enrolled at the tertiary level increased in Denmark (+27%) and the Netherlands (+40%), but declined in Germany (-5%), Austria (-17%) and the United States (-23%). The number of Romanian students enrolled in Spain decreased sharply between 2013 and 2016, from almost 2 200 to 900 (-57%).

Note: In the case of the United States, figures refer to students who are normally resident outside the United States (non-residents).
Source: International Students Database, UNESCO-OECD-Eurostat (UOE) database on education, https://doi.org/10.1787/edu-data-en.
Internationally mobile Romanian students in OECD countries accounted for less than 6% of total Romanian tertiary enrolments in 2016. While Romanian students enrolled in OECD countries outnumbered those from neighbouring countries in 2013, the number of Ukrainian students grew by 80% to surpass the number of Romanian students in 2016. Furthermore, the relative growth in internationally mobile students in OECD countries was higher for all of Romania’s neighbouring countries with the exception of Bulgaria.
The majority of Romanian emigrants are not citizens of their host country
The vast majority of Romanian emigrants likely retained Romanian citizenship after it was acquired at birth in Romania. In the available cross-country data sets, however, Romanian citizenship is often only recorded when an emigrant does not also hold the citizenship of the host country or – in the case of the European Labour Force Survey – of another EU country (see Box 1.2). Only more detailed data for particular destination countries offer information on multiple citizenships. While the total number of Romanian citizens who reside outside Romania therefore cannot be established, some insights can be obtained on the citizenship of those who were born in Romania.
According to DIOC data for 2015/16, only 974 000 Romanian-born persons, or 29% of all Romanian emigrants aged 15 and above, were citizens of the OECD country where they resided (see Figure 1.17). For 25 000 Romanian emigrants (less than 1% of the total) it is unknown whether or not they were citizens of their host country. This includes Romanian emigrants in Ireland. About 2.3 million Romanian emigrants (70%), however, did not hold the citizenship of their host country in 2015/16.
Romanian emigrants who do not have the citizenship of their host country likely only hold Romanian citizenship. Additional information in the DIOC data allows testing of this hypothesis for seven countries (Finland, France, Luxembourg, Norway, Sweden and Switzerland) that together host a total of 166 000 Romanian emigrants in 2015/16: 32% of Romanian emigrants in these countries were citizens of their host country, 65% appeared to hold no other citizenship than that of Romania, and only 3% were citizens of a country that is neither Romania nor their host country.
Romanian emigrants were less likely to hold host-country citizenship than emigrants from neighbouring countries or emigrants in general. Among emigrants from Romania’s neighbours, 36% held the citizenship of their host country. The nationality gap was even larger between Romanian emigrants and the overall population of foreign-born residents of the OECD, as 50% of the latter were nationals of their host countries in 2015/16. These differences are mostly likely imputable to the fact that Romania has been part of the European Union since 2007, and as such there is comparatively little to be gained by acquiring the nationality of another EU country (Dronkers and Vink, 2012[11]).
Comparatively few Romanian emigrants are citizens of Spain or Italy
Indeed, variation across the main destination countries of Romanian emigrants shows that holding host-country citizenship is likely related to the period of emigration and whether or not the destination country is a member of the EU. Across the main destination countries, the share of Romanian emigrants who held the citizenship of their destination country in 2015/16 was highest in in Israel (95%), Canada (89%), Hungary (87%), the United States (76%) and Germany (54%) (see Figure 1.17). As Sandu (2005[2]) points out, the main destinations of Romanian emigrants before 1990 were North American countries, Germany, Hungary and Israel, exactly the countries where Romanian emigrants are most likely to have acquired citizenship. Thus, acquisition of citizenship is probably partly a product of a longer stay in these countries among a larger share of Romanian emigrants. In the case of Germany and Hungary, the re-emigration of ethnic Germans (Aussiedler) and Hungarians in the 1990s (Sandu, 2005[2]) also probably increased the share of Romanian-born in those countries that have host-country citizenship. Finally, the almost-universal acquisition of citizenship in Israel is related to the fact that immigrating Jews normally obtain Israeli citizenship on arrival (see Box 1.3).
In contrast, Romanian emigrants are less likely to hold the citizenship of destination countries that are also EU members and to which Romanian emigration has mainly occurred in the last ten years. In 2015/16 in the main destination countries, the share of Romanian emigrants with the nationality of their country of residence was lowest in Spain (2%), the United Kingdom (5%) and Italy (7%). As explored above, the numbers of Romanian emigrants in these countries has only increased substantially since 2000, with the sharpest increases taking place in Italy between 2005/06 and 2010/11 and in the United Kingdom between 2010/11 and 2015/16. Not only have Romanian emigrants in these countries likely not resided there long enough to qualify for naturalisation, but their status as EU citizens also makes acquisition of another EU citizenship relatively less attractive (Dronkers and Vink, 2012[11]). Differing legal requirements for naturalisation may also dissuade Romanian emigrants from acquiring citizenship in some destination countries. Spanish law, for example, requires not only ten years of residence for the naturalisation of EU citizens, but also does not allow EU citizens (with the exception of Portuguese) to hold dual citizenship (Finotelli, La Barbera and Echeverría, 2018[12]). The requirement that naturalised citizens renounce their prior nationality may deter Romanian emigrants from seeking Spanish citizenship.
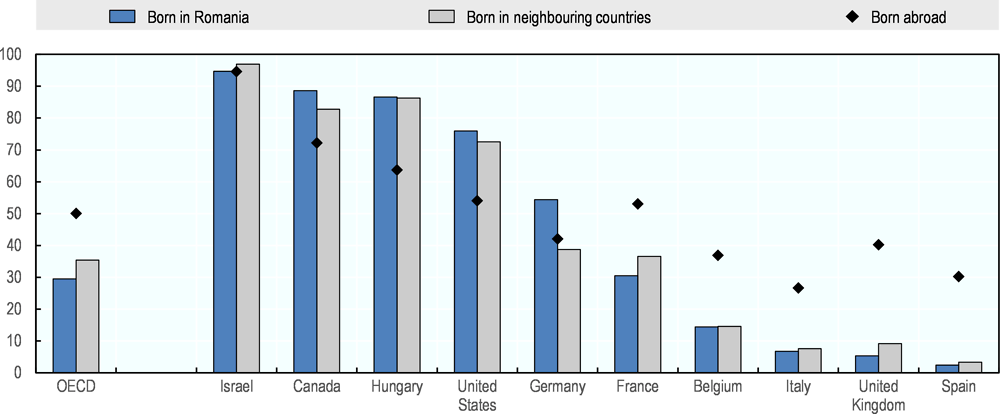
Source: OECD Database on Immigrants in OECD Countries (DIOC) 2015/16, www.oecd.org/els/mig/dioc.htm.
Despite the low share of Romanian emigrants with host-country nationality in many EU countries, data on recent acquisitions of nationality show that recent policy changes and challenges to the stability of the EU may result in changing naturalisation decisions. Figure 1.18 shows that the annual number of acquisitions of nationality of Romanian citizens across OECD countries increased by 30% between 2005 and 2016, based on data from the International Migration Database (see Box 1.2 for a description). There has been a negative trend in acquisitions of nationality in the United States, Canada and Hungary, countries where Romanian emigrants are more likely to have host-country nationality. The number of acquisitions of nationality declined by 80% and 40% in Canada and the United States, respectively, between 2005 and 2006. In Hungary, a large temporary spike in 2011-13 was followed by a return to a negative trend, and acquisitions of nationality fell by 33% between 2005 and 2016. The 2011-13 spike is related to an amendment to the Hungarian citizenship law that came into effect in January 2011 that introduced a simplified and preferential naturalisation procedure for persons of Hungarian descent (OECD, 2012[13]). About 103 000 people acquired Hungarian citizenship in 2011 as the result of the simplified procedure (OECD, 2013[14]), almost 16 000 of whom were Romanians.
In contrast to the negative trend in North America and Hungary, acquisitions of nationality among Romanians increased between 2005 and 2016 in a number of EU countries. The sharpest increase was in Italy, where annual acquisitions of nationality rose from 2 800 in 2006 to an average of almost 13 700 in 2015-2016, an increase of 370%. Acquisitions of nationality also rose to over 2 000 per year in Germany (+178% to 3 800) and the United Kingdom (+229% to almost 2 000). France (+80% to 1 700 in 2016) and Spain (a sevenfold increase to 1 200 in 2016) also recorded significant increases in the number of acquisitions of nationality among Romanians (see Annex Table 1.A.6 for figures on all main destination countries).
These increases in the acquisition of EU host-country nationality among Romanians reflect larger trends in naturalisation in the EU. Research has pointed to rising rates of naturalisation among EU migrants in their EU host countries and has linked this trend to growing insecurity of EU citizenship in the wake of the Euro crisis (Graeber, 2016[15]). Romanians may be reacting to this insecurity surrounding EU citizenship in a similar way, by increasingly seeking to acquire the citizenship of their host country when possible. The Brexit referendum of June 2016 in the United Kingdom, which supported an exit from the EU, presents another challenge to the status of EU citizenship to which Romanians must react. Initial scholarship on the results of the referendum has suggested that Brexit may entail a loss of rights for EU citizens living in the United Kingdom (Mindus, 2017[16]). This loss may further drive Romanian emigrants there to seek British citizenship or to leave the United Kingdom for another country (Lulle, Moroşanu and King, 2018[17]), but comprehensive data are not yet available to comment on this possibility. In the case of Italy, the requirements for naturalisation are less restrictive for EU citizens than non-EU citizens (for example, four years of residence compared to ten years), which may also encourage Romanians to naturalise (Finotelli, La Barbera and Echeverría, 2018[12]).
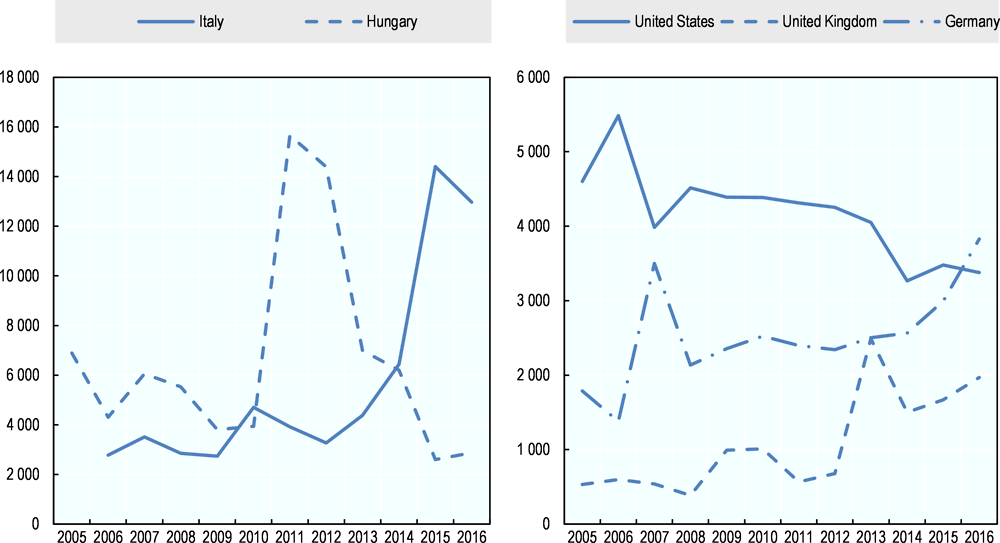
Note: Figures for Italy in 2005 are not available. Figures for all main destination countries are provided in Annex Table 1.A.6.
Source: OECD International Migration Database, https://doi.org/10.1787/data-00342-en.
Acquisition of host-country nationality differs by destination and age
This section explores how Romanian emigrants who are citizens of their host country differ from those who are not. Additional information from the DIOC data, albeit available only for eight destination countries, offers further details on the citizenship of Romanian emigrants in 2015/16 (see Figure 1.19). Among Romanian emigrants in France, almost 5% had obtained French citizenship at birth in Romania, so that they were likely born to parents who were French citizens. The corresponding share was almost 3% in the United States and 2% in Switzerland, but insignificant shares of Romanian emigrants in the remaining countries declared having the citizenship of their host country at birth. The majority of Romanian emigrants in Canada (88%), Hungary (87%) and the United States (73%) obtained citizenship through naturalisation. While naturalised citizens also accounted for almost half of the Romanian emigrants in Sweden, corresponding shares in Switzerland (27%), France (26%), Norway (11%) and Luxembourg (7%) were lower. Small shares of Romanian emigrants in Switzerland (16%) and Luxembourg (10%) declared having the nationality of a third country.
Finally, it is possible to differentiate the information in Figure 1.19 by age group, as shown in Annex Figure 1.A.1. For each country, Romanian emigrants who still hold only Romanian nationality (i.e. they are not citizens of the host or a third country) tend to be between 25 and 44 years old. In Canada, France, Switzerland and the United States, the largest group of Romanian emigrants who were born with the citizenship of the host country were between 15 and 24 years old, while the largest corresponding group in Norway and Sweden were 65 years old or older. Romanian emigrants who acquired host-country citizenship are mostly evenly distributed across age groups in most countries, with those between 15 and 24 years old somewhat less likely than those in other age groups to have acquired citizenship. This lower level of acquisition of nationality is likely due to these younger migrants having spent less time in the destination countries. In Luxembourg, the 45-54 age group dominates the group of Romanian emigrants who acquired host-country citizenship, while Romanian emigrants in Hungary who acquired Hungarian citizenship tend to be older (65+). Romanian emigrants who are citizens of a third country tend to be between 25 and 44, with the exception of Hungary where they are overwhelmingly 65 or over. Some of these differences may reflect different policy approaches to naturalisation in destination countries as well as differences in the demographic composition of Romanian emigrants.
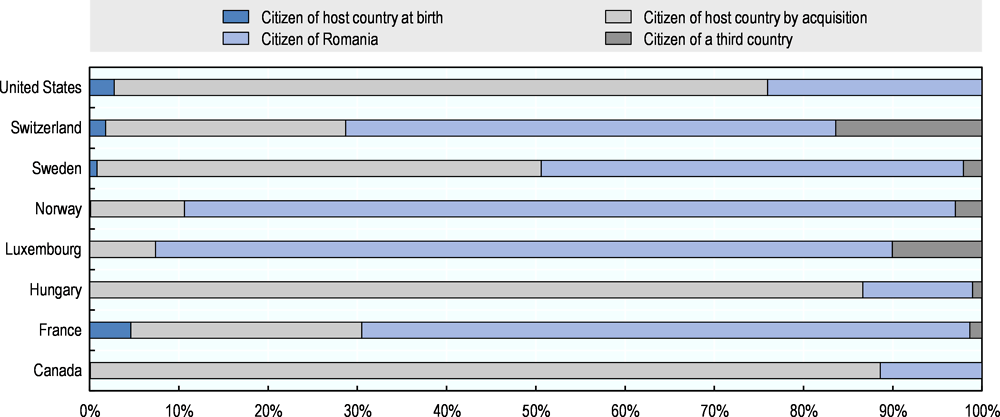
Note: This information is available in DIOC only for the eight countries shown. Romanian emigrants aged 15 and above.
Source: OECD Database on Immigrants in OECD Countries (DIOC) 2015/16, www.oecd.org/els/mig/dioc.htm.
A growing population of descendants of Romanian emigrants
For the purposes of this review, the descendants of Romanian emigrants include persons who were born outside Romania but had at least one Romanian-born parent. Unfortunately, there is no internationally comparable data source on this population. Many surveys do not collect data on the place of birth of the native-born, making it impossible to estimate numbers of descendants of the foreign-born. It is possible, however, to compile totals from a variety of data sources in a limited number of OECD countries (the EU, Italy, Spain, the United Kingdom and the United States) to arrive at a conservative estimate of at least 630 000 descendants of Romanian emigrants.
Cross-country EU data show an older population of descendants of Romanian emigrants concentrated in a small number of countries
Among the available cross-country data sources, only the special module of the European Labour Force Survey (EU LFS) provides information on parents’ country of birth (see Box 1.2). These data can identify descendants of Romanian emigrants who were born in the EU country where they reside and can thus constitute a lower bound for the total number of descendants of Romanian emigrants in the EU. In 2014, this population reached approximately 125 000 persons aged 15 to 64.
The EU LFS data show that descendants of Romanian emigrants were mostly of mixed parentage, over the age of 24, female, and concentrated in a small number of countries. Among the identifiable second-generation Romanian emigrants in the European Union, close to 30 000 persons (representing a quarter) had parents who were both born in Romania. In the case of roughly 43 000 persons (38%), only the father was born in Romania; in the case of 42 000 (36%), only the mother was born there. Only about a fourth (26%) were aged from 15 to 24, while almost 90 000 were aged from 25 to 64. The data from the special module of the EU LFS do not include those younger than 15. If they were counted towards the total, the share of those younger than 24 would become larger. Over half (53%) of the descendants of Romanian emigrants in the EU in 2014 were women. This population was concentrated in Hungary (about 40%) and Austria (about a fifth), and there were relatively few descendants of Romanian emigrants in Italy (6%), Spain (1%) or the United Kingdom (less than 1%).
National data sources in more recent countries of destination show a younger, more widespread population of descendants of Romanian emigrants
The geographic concentration of descendants of Romanian emigrants in the 2014 EU LFS points to a major limitation of the data source: as the survey includes only those aged 15 and above, it does not capture children of Romanian emigrants born since 1999. This is especially problematic in light of the increase since 2000 in the numbers of Romanian emigrants living in new destination countries such as Italy, Spain and the United Kingdom; their children are not included in the EU LFS-derived estimate of the number of descendants of Romanian emigrants.
Data on births in Italy, Spain and the United Kingdom show that there may indeed be a sizable population of descendants of Romanian emigrants under the age of 15 (Figure 1.20). From a low of under 1 000 in 1999 and 2000, births to Romanian mothers in Italy and Spain rose quickly and attained 5 000 in both countries in 2004. Births to Romanian mothers in Spain peaked in 2008 and have since declined to an average of about 11 300 per year between 2009 and 2016. Romanian births in Italy peaked in 2012 at almost 16 500 and have averaged almost 15 700 per year since then.
No data on births to Romanian mothers in the United Kingdom are available prior to 2012, when Romania entered the list of the ten most common countries of birth of mother for mothers not born in the United Kingdom. With 4 400 births, Romania was ninth on the list in 2012 and has since moved rapidly up to third place in 2017 with 13 700 births. While births to Romanian mothers in the United Kingdom were 60% lower than those in Spain in 2012, the number in the United Kingdom exceeded the number in Spain in 2016.
Cumulating these yearly birth totals allows the calculation of rough estimates of the size of the population of descendants of Romanian emigrants in each country. From 1999 to 2016, there were 170 000 Romanian births in Italy and 144 000 births to Romanian mothers in Spain. Between 2012 and 2017, there were almost 50 000 births in the United Kingdom to Romanian mothers.
Taken together, births to Romanian mothers in these countries totalled almost 364 000. While not all of these children survived or remained in their country of birth, it is likely that these children, all of whom were under age 15 in 2014, constitute a sizable population of descendants of Romanian emigrants. Furthermore, these individuals are much younger than the population of descendants of Romanian emigrants as captured by the EU LFS and are concentrated in a different set of countries, underscoring the demographic and geographic transitions likely taking place within the Romanian second generation in the EU.
Data on births by nationality are available at the regional level in Italy. These data show that the ranking of Italian NUTS-2 regions by share of Romanian births is largely the same as the ranking of these regions by the share of the overall population. For example, the region of Lazio hosted the largest share (18%) of Romanian emigrants in Italy in 2015/16. This region also saw the largest share of Romanian births at about 21%, corresponding to an annual average of 3 200 births per year between 2010 and 2016. Lombardia was the region with the second-highest share of both Romanian emigrants and births and accounted for about 16% of births, or an annual average of 2 500. The regions of Piemonte (14% of Romanian births) and Veneto (11%) were third and fourth in both rankings. While the region of Emilia Romagna was ranked sixth in the share of Romanian emigrants, it had the fifth-highest share of Romanian births (7%), jumping ahead of the region of Toscana (6%). For the top five regions for Romanian births, the share of births was higher than the share of Romanian emigrants. The top five regions account for slightly more than two thirds of all Romanian births in Italy.

Note: Data refer to mothers born in Romania in the United Kingdom and in Spain for 2007 to 2016. Data refer to mothers with Romanian nationality in Spain for 1999 to 2006. Data refer to country of foreign citizenship in Italy. No data available for Romanian-born mothers in the United Kingdom prior to 2012.
Source: Italy: Istituto Nazionale di Statistica (Istat), Live births: Country of foreign citizenship, 1999-2016. Spain: Instituto Nacional de Estadística (INE), Vital Statistics/Birth Statistics, 1999-2016. United Kingdom: Office for National Statistics, Live births by parents’ country of birth, 2017.
It is likewise possible to study the regional distribution of Romanian births in Spain as the province of birth to foreign mothers is recorded in the data. Much like in the case of Italy, the ranking of Spanish provinces in terms of their shares of Romanian births closely matches the ranking of provinces by their shares of Romanian emigrants. The autonomous community of Madrid not only hosts the highest share of Romanian emigrants but is also the place of almost a quarter of Romanian births in Spain, a share that is five percentage points higher than its proportion of Romanian emigrants. The autonomous community of Valencia, with the second-highest share of Romanian migrants, retains its ranking for Romanian births with 16% of the total. The autonomous communities of Andalucía (13% of Romanian births), Cataluña (13%), and Catilla-La Mancha (11%) retain the third through fifth spots in the ranking. These five autonomous communities account for more than three quarters of all Romanian births in Spain.
Additional national data sources of specific destination countries can help establish total numbers and some characteristics of their populations of descendants of Romanian emigrants. A specialized survey of foreign families in Italy in 2011-12 (Condizione e Integrazione dei Cittadini Stranieri) permits another estimation of the number of descendants of Romanian emigrants in Italy. These data show that there were almost 115 000 individuals born in Italy with at least one parent born in Romania. While this total initially seems at odds with the estimates from the EU LFS data and the Italian birth data, further examination of the age distribution of this population shows it to be consistent with these other sources. Only about 4 000 individuals, or less than 4% of the total, were above 15 years of age, an estimate on the same order of magnitude as the EU LFS estimate of the total number of descendants of Romanian emigrants in Italy (6 000). In contrast, the survey data estimate about 112 000 descendants of Romanian emigrants between 0 and 14 years of age. This total is consistent with the cumulative number of Romanian births between 1999 and 2012 (107 000). Approximately 45% of descendants of Romanian emigrants in Italy were female and 40% had acquired Italian citizenship.
The descendants of Romanian emigrants in the United States are mostly women and concentrated in the older age groups. The Current Population Survey (CPS) produces an estimate of 138 000 descendants of Romanian emigrants in the United States in 2016. Women accounted for more than half (56%) of this population. While the majority of children of Romanian emigrants were over 30 years old, the age distribution shows a bimodal concentration at both younger and older ages. Almost a quarter of children of Romanian emigrants (about 40 000 individuals) were under 15 years old, and more than a third (34%) were 65 years old or older with a quarter over the age of 80. The regional distribution of descendants of Romanian emigrants in the United States mirrors the distribution of Romanian emigrants, with high shares in the states of Florida (28%), Illinois (12%), Michigan (10%), California (7%) and New York (7%). The shares of descendants of Romanian emigrants in California and New York are lower than these states’ shares of Romanian emigrants, and Florida’s share correspondingly higher, but the limited sample size of this population in the CPS probably underlies some of these discrepancies.
The descendants of Romanian emigrants, while difficult to measure accurately given the limitations of available data sources, constitute a growing population in countries of more-recent Romanian emigration. As a result, the majority of this population is likely quite young (under 15 years old), with Romanian births since 1999 in Italy, Spain and the United Kingdom representing upwards of 60% of the estimate of 630 000 descendants of Romanian emigrants in OECD countries. The estimate of the total number of children of Romanian emigrants is likely to be conservative, however, as it does not include several countries with sizable populations of Romanian emigrants, such as Germany, Hungary and Canada. The inclusion of additional countries would not only likely increase the estimate of the total number of descendants of Romanian emigrants, but could also have an effect of the estimated age distribution. The estimates presented here should thus be interpreted with caution. Chapter 3 presents further characteristics of the descendants of Romanian emigrants.
Conclusions
In conclusion, emigrants from Romania represented the sixth largest group of emigrants in OECD countries in 2015/16, and the largest group of emigrants from Romania’s neighbouring region. Between 2000/01 and 2015/16, their number grew by 2.3 million to reach 3.4 million. Most of this growth (1.1 million emigrants) occurred between 2005/06 and 2010/11. The demographic composition of Romanian emigrants has evolved: while the share of women has remained stable at 51%, a rejuvenation process can be observed among the emigrants with more than 90% of them of working age. European OECD countries accounted for 90% of all Romanian emigrants in the OECD area in 2015/16, and 67% resided in Italy, Germany or Spain. The growth in their numbers was especially high in Italy, Spain and the United Kingdom, largely driven by young and recent emigrants, although the growth occurred in different periods in each country. Most Romanian emigrants are not citizens of their host country, and naturalisations in European Union countries such as Italy, Germany and the United Kingdom have recently risen strongly, while they have fallen in the United States and Hungary. The number of the second generation of Romanian emigrants in EU countries likely approaches 630 000 in total, with a sizable share under 15 years old.
References
[5] Arslan, C. et al. (2015), “A New Profile of Migrants in the Aftermath of the Recent Economic Crisis”, OECD Social, Employment and Migration Working Papers, No. 160, OECD Publishing, Paris, https://doi.org/10.1787/5jxt2t3nnjr5-en.
[10] Cohen, Y. (2009), “Migration Patterns to and from Israel”, Contemporary Jewry, Vol. 29/2, pp. 115-125, https://doi.org/10.1007/s12397-009-9012-0.
[11] Dronkers, J. and M. Vink (2012), “Explaining access to citizenship in Europe: How citizenship policies affect naturalization rates”, European Union Politics, Vol. 13/3, pp. 390-412, https://doi.org/10.1177/1465116512440510.
[12] Finotelli, C., M. La Barbera and G. Echeverría (2018), “Beyond instrumental citizenship: the Spanish and Italian citizenship regimes in times of crisis”, Journal of Ethnic and Migration Studies, Vol. 44/14, pp. 2320-2339, https://doi.org/10.1080/1369183X.2017.1345838.
[15] Graeber, J. (2016), “Citizenship in the shadow of the Euro crisis: explaining changing patterns in naturalisation among intra-EU migrants”, Journal of Ethnic and Migration Studies, Vol. 42/10, pp. 1670-1692, https://doi.org/10.1080/1369183X.2016.1162353.
[9] Ioanid, R. (2005), The ransom of the Jews: the story of the extraordinary secret bargain between Romania and Israel, Ivan R. Dee, Chicago.
[7] Levy, R. (1998), “Ana Pauker and the mass emigration of Romanian Jewry, 1950–1952”, East European Jewish Affairs, Vol. 28/1, pp. 69-86, https://doi.org/10.1080/13501679808577871.
[17] Lulle, A., L. Moroşanu and R. King (2018), “And then came Brexit: Experiences and future plans of young EU migrants in the London region”, Population, Space and Place, Vol. 24/1, p. e2122, https://doi.org/10.1002/psp.2122.
[3] Matei, M. (2018), Report of the National Correspondent for Romania to the OECD Continuous Reporting System on Migration (SOPEMI).
[1] Mereuta, C. (2013), “Mobilising migrants skills and resources in Romania”, in Coping with Emigration in Baltic and East European Countries, OECD Publishing, Paris, https://doi.org/10.1787/9789264204928-9-en.
[16] Mindus, P. (2017), European Citizenship after Brexit, Springer International Publishing, Cham, https://doi.org/10.1007/978-3-319-51774-2.
[14] OECD (2013), International Migration Outlook 2013, OECD Publishing, Paris, https://doi.org/10.1787/migr_outlook-2013-en.
[13] OECD (2012), International Migration Outlook 2012, OECD Publishing, Paris, https://doi.org/10.1787/migr_outlook-2012-en.
[6] OECD (2011), “International Migration to Israel and its Impact”, in International Migration Outlook 2011, OECD Publishing, Paris, https://dx.doi.org/10.1787/migr_outlook-2011-9-en.
[4] OECD (2008), A Profile of Immigrant Populations in the 21st Century: Data from OECD Countries, OECD Publishing, Paris, https://doi.org/10.1787/9789264040915-en.
[8] Oltean, A. (2011), “The Jews of Romania and their Immigration to Israel. 1948-1953.”, Eurolimes 11, pp. 41-55, https://www.ceeol.com/search/article-detail?id=293425 (accessed on 6 February 2019).
[2] Sandu, D. (2005), “Dynamics of Romanian Emigration After 1989: From a Macro- to a Micro-Level Approach”, International Journal of Sociology, Vol. 35/3, pp. 36-56, https://doi.org/10.1080/00207659.2005.11043153.
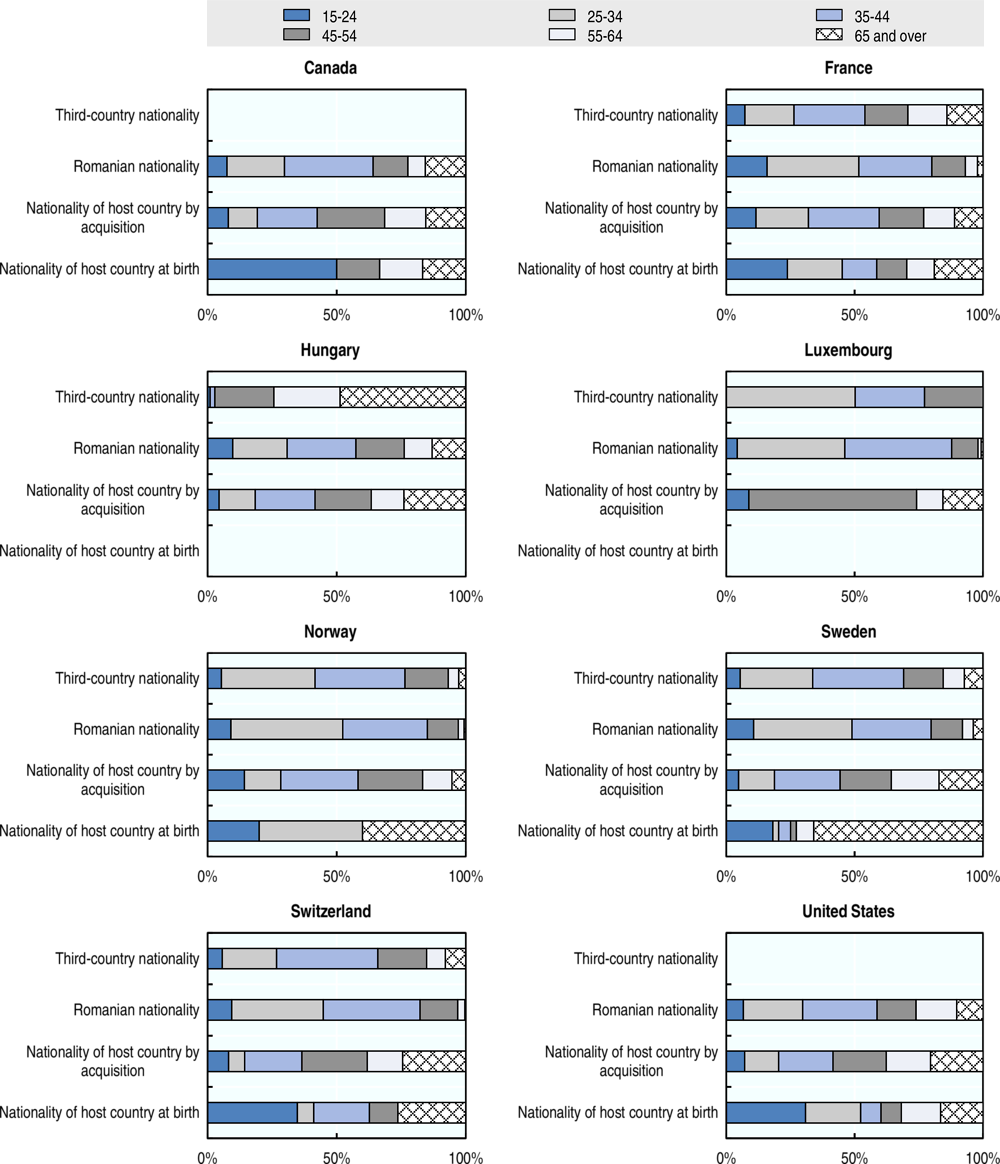
Note: This information is available in DIOC only for the eight countries shown. Romanian emigrants aged 15 and above
Source: OECD Database on Immigrants in OECD Countries (DIOC) 2015/16, www.oecd.org/els/mig/dioc.htm.