Spending responsibilities across levels of government
More than 59% of public spending in the areas of housing and community amenities, environmental protection and culture and recreation fall under the responsibility of SNGs.
The share of SNG expenditure in public expenditure by economic function reflects the distribution of responsibilities across levels of government. However, such an assignment does not imply that SNGs have full autonomy in exercising them.
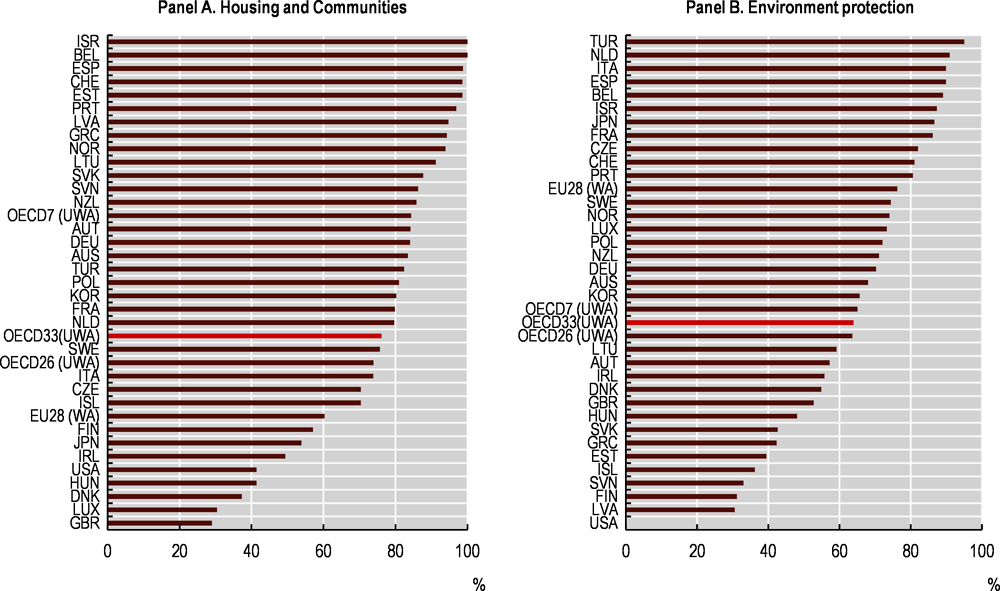
SNGs in OECD member countries carry out a large share of the total public spending related to housing and community amenities, a sector that represents one of their key assigned responsibilities. In 2017, SNGs accounted for 76% of total public spending (unweighted average) in housing and community amenities (Figure 5.3); it exceeded 80% in half of the 33 OECD countries (Figure 5.4, panel A) and was even above 95% in Belgium, Estonia, Israel, Portugal, Spain and Switzerland.
The share of SNG spending in total public environmental protection spending was also sizable in 2017 and reached close to 64% (Figure 5.3). Environmental protection covers activities related to waste management, sewerage, parks and greens spaces, which are often devolved to local governments or undertaken by decentralised functional bodies (e.g. water boards in the Netherlands). The importance of SNG environmental spending was particularly high in the Netherlands and Turkey, where it accounted for more than 90% of total public environmental expenditure (Figure 5.4, panel B).
SNG spending on recreation, culture and religion also accounted for a large share (59%) of total public expenditure in that sector, with a ratio above 90% in Belgium, Germany, Japan and Switzerland.
Education is a shared competency across levels of government in a relatively equal manner. As a share of total public spending on education, subnational expenditure on education represented 48%. In many countries, SNGs are in charge of the construction and maintenance of education infrastructures, and the financing of school-related activities, especially at the primary level. SNGs are also often in charge of the payment of salaries for administrative staff and teachers, although they act more as paying agents with little discretion over such budget.
In the health sector, SNG spending represented 24.5% of public expenditure in the OECD. It exceeded 84% of total public health spending in Spain, Sweden and Switzerland where SNGs undertake broad responsibilities for planning and delivering healthcare services, especially in primary care centres at the municipal level, and hospital and specialised medicine at the provincial/regional levels. Yet, the health sector remains highly centralised in other countries, such as Greece, Ireland and New Zealand where SNG health expenditure accounted for less than 1% of total public health expenditure in 2017.
In the sector of economic affairs, SNGs accounted for approximately 34% of public spending. SNG economic affairs spending is highest in federal countries, reaching more than 60% in Australia, Belgium, Germany and the United States. Among unitary countries, Japan stood out as SNGs accounted for more than 53% of total economic affairs spending in 2017.
SNG spending on social protection accounted for 14% of total public spending in that sector. In most OECD countries, social protection and benefits are mainly provided by the central government, social security bodies or by insurance institutions. To date, defence and public order-related functions remain highly centralised in most OECD countries.
General government includes four sub-sectors: central/federal government and related public entities; state governments (e.g. states in the United States, länder in Germany, cantons in Switzerland, etc.) and related public entities; local government, i.e. regional and local governments and related public entities; and social security funds. Data are consolidated within the four sub-sectors. Subnational government is defined as the sum of state governments and local/regional governments.
Definitions of expenditure, expenditure by economic function are developed in Annex D.
Sources
OECD (2020a), National Accounts Statistics (database), OECD, Paris, https://doi.org/10.1787/na-data-en.
OECD (2020b), “Subnational government finance”, OECD Regional Statistics (database), OECD, Paris https://doi.org/10.1787/region-data-en.
Estimates from IMF Government Statistics for Australia and Chile.
Reference years and territorial level
2018: National accounts; Levels of government; 2017: JPN, NZL, TUR.
Further information
OECD (2020), Subnational Governments in OECD Countries: Key Data (brochure), OECD, Paris.
Figure notes
Figure 5.3 and Figure 5.4: OECD averages are presented as weighted (WA) and unweighted (UWA) average of OECD countries. The OECD average is calculated for 33 countries (no data for Canada, Chile and Mexico). For the United States, data showed in the function “Housing and community amenities” include the “environment protection” function data. OECD7 and OECD26 refer respectively to the averages for OECD federal countries and OECD unitary countries. The total of general government spending is non-consolidated.