Chapter 2. Micro-level impact of social assistance on inclusive growth
Social assistance programmes are a key component of social protection investments that are likely to affect inclusive growth, especially given that they are non-contributory and target the poor. Yet, besides cash transfers, empirical evidence on their impact on inclusive growth remains insufficiently documented. Through a review of the empirical literature and new empirical analysis for Brazil, Germany, Ghana and Indonesia, this chapter examines the impacts of various social assistance programmes on a range of microeconomic outcomes conducive to inclusive growth that are captured in household surveys. Programmes analysed span lifecycle stages, countries and household income levels. Results make a strong case for investments in social assistance as a driver of inclusive growth but indicate that programme design and implementation, and heterogeneity of benefit levels, matter. Some aspects are difficult to measure in quantitative analysis and deserve greater attention in future data collection and research.
Progressivity of social assistance
Social assistance in the form of cash transfer programmes have rapidly expanded in low- and middle-income countries in recent years and have become central in poverty reduction and social protection strategies in many countries. Social assistance schemes currently cover 31% of the global population (World Bank, 2018[1]): some 130 low- and middle-income countries have implemented at least one non-contributory unconditional cash transfer (UCT) programme, while about 63 have at least one conditional cash transfer (CCT) programme (Bastagli et al., 2016[2]).
Still, a large share of the target population lacks access to social assistance. It covers less than 15% of the sub-Saharan African population, benefiting only about 9% of the poorest households (see Table 1.1 in Chapter 1).
New empirical evidence presented in this report is based on four country studies: Brazil, Germany, Ghana and Indonesia. The social assistance programmes analysed include three CCT programmes, a child benefit programme and a cash transfer programme for poor students (Table 2.1).
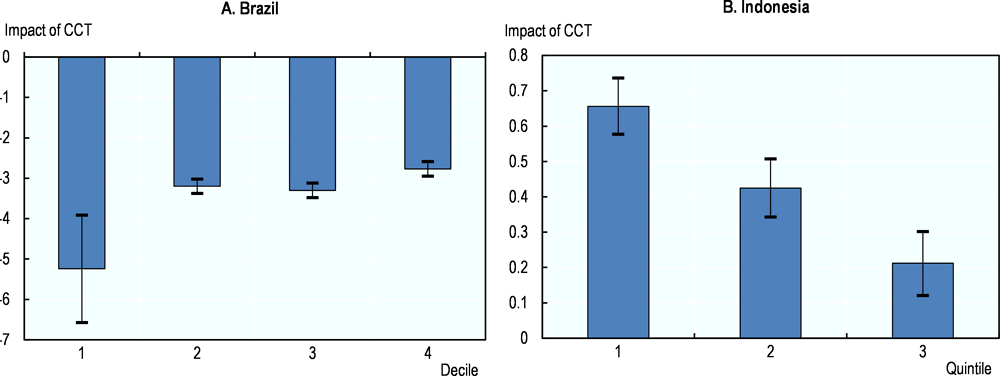
These programmes have slightly different targets, which affects the selection of households included in the analysis. The three CCT programmes analysed target poorer populations in their respective countries. CCT income as a share of total household income is higher in poorer households, indicating a certain degree of success in targeting. In Brazil, CCTs represent 32% of income among households in the first decile and less than 10% of income among those in the second to fifth deciles (Figure 2.1A). Households above the fifth decile are ineligible and therefore excluded from the analysis.
In Ghana, Livelihood Empowerment Against Poverty (LEAP) cash transfers account for 28% of total household income in the first quintile and 8% in the fifth quintile (Figure 2.1B). The latter constitutes a small but not negligible share of households in the survey sample; the analysis therefore includes all households in the survey.
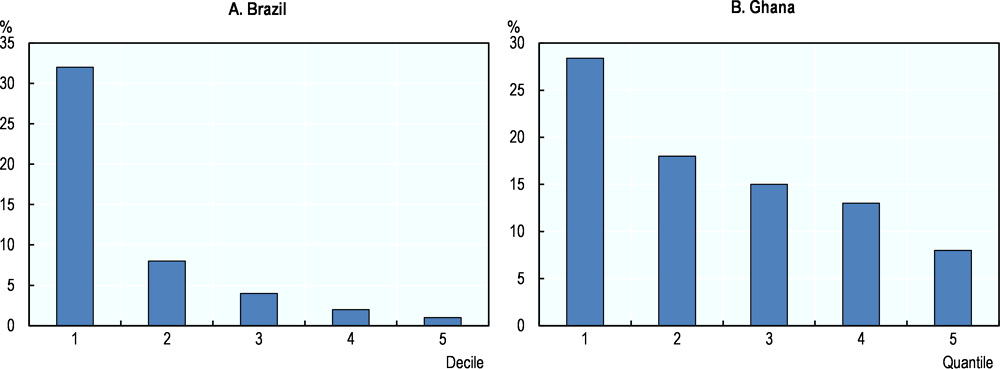
Note: CCT income share for the sixth to tenth deciles in Brazil is zero due to ineligibility.
Source: Authors’ calculations based on data (2011-15) from Pesquisa Nacional por Amostra de Domicilios (Brazilian National Household Sample Survey), ibge.gov.br/estatisticas-novoportal/sociais/saude/9127-pesquisa-nacional-por-amostra-de-domicilios.html, and household evaluation data (2010-16) from Ghana’s Livelihood Empowerment Against Poverty programme.
Analysis of Indonesia’s Programme Keluarga Harapan (PKH) cash transfer programme and Bantuan Siswa Miskin (BSM) scholarship for poor students programme uses programme participation (i.e. whether households received social assistance transfers or not). Households in the first quintiles are substantially more likely to receive CCT income and scholarship benefits (Figure 2.2): one in three (33%) receives CCT income and one in four (26%) receives scholarships, compared with 4% and 2% among households in the fifth quintile. Analysis of the PKH and BSM thus focuses on the first three quintiles.
Germany’s child benefit targets all households with children, regardless of income level. Analysis therefore includes all households in the German Socio-Economic Panel survey with at least one child. The level of benefit varies for children past the second child (see Annex 2.A).
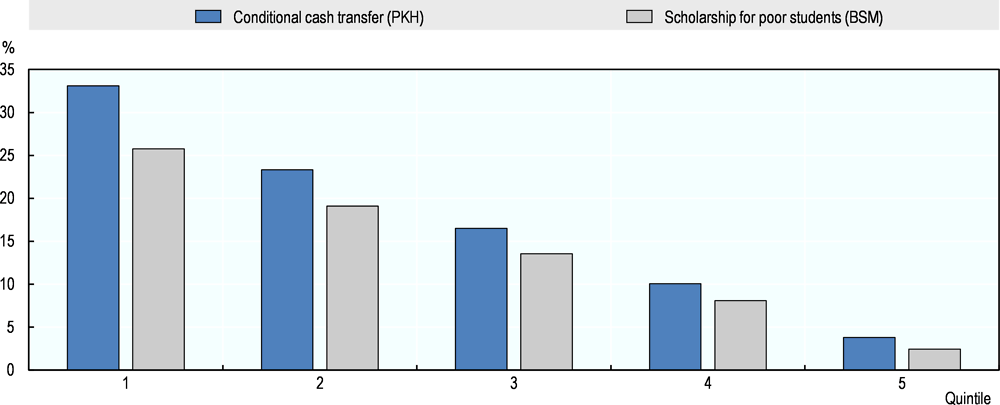
Note: Quintiles are calculated based on income.
Source: Authors’ calculations based on data from the 2016 Indonesian National Socio-Economic Survey (SUSENAS), https://microdata.bps.go.id/mikrodata/index.php/catalog/SUSENAS.
Impact of social assistance on micro drivers of growth
While social assistance covers all lifecycle stages, most evaluations have focused on programmes targeting children, youth and working-age individuals, which is reflected in the analysis below. Some evidence addresses programmes for the elderly.
Impact of social assistance on children and youth
Many children and youth suffer from poverty, social exclusion and lack of access to necessary goods and services (ILO, 2017[3]). Social assistance can play an important role in lifting children out of poverty, reducing child labour, and improving health, nutrition and education outcomes.
Cash transfers seem to spur investments in schooling
Existing empirical literature supports theoretical expectations regarding the impact of social assistance on education outcomes (see Chapter 1). Two extensive literature reviews show a positive link between cash transfers and school attendance, with stronger impacts in the case of conditionality (Bastagli et al., 2016[2]; Baird et al., 2013[4]). Findings give ample support to the expectation that, since liquidity- and credit-constrained households tend to underinvest in education, social protection benefits can positively affect education outcomes. The reviews also suggest that conditionalities have an effect by themselves (Box 2.1). However, impacts on learning, critical in disrupting intergenerational poverty, are weaker. A few recent studies shed light on cash transfers’ long-term impacts and propose that some outcomes, such as learning, might change due to long periods of exposure. However, evidence for the hypothesis remains limited. Other studies have also evidenced that unconditional cash transfer programmes can significantly increase secondary school-age enrolment and spending on school inputs, thus refuting common perceptions (Peterman, Yablonski and Daidone, 2018[5]; Baird et al., 2014[6]; Kilburn et al., 2017[7]; Handa et al., 2016[8]).
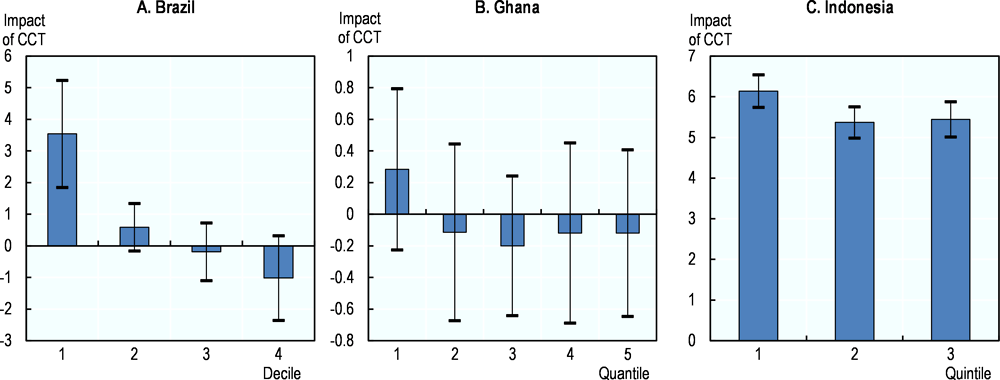
New empirical evidence presented in this report also points to CCTs’ positive effect on school attendance. Increased household income from Bolsa Família, Brazil’s flagship social assistance programme, increases school enrolment rates among children and youth up to age 25 (Figure 2.3A). The effect holds in all but the fourth decile. The effect is largest among age groups above age 14, since attendance by younger groups is almost universal.
Indonesia’s PKH CCT has similar effects on school attendance. Receiving a PKH positively affects the first three quintiles, with a stronger effect in the first two (Figure 2.3B). Estimations are statistically significant at a 5% level in the three quintiles. These results are in line with previous findings that the PKH significantly improves elementary school attendance (Hadna, Dyah and Tong, 2017[9]).
Ghana’s LEAP CCT is an important income source for the poorest households to cover education expenditures. Basic public education is partly subsidised, but financial access is still an issue (NDPC, 2015[10]). Until recently, families had to pay substantial sums for higher than basic education, i.e. senior high and tertiary education. Analysis shows that increased income from LEAP significantly increases the likelihood that a child or youth (aged 3-24) in the lowest quintile attends school. Separate analysis of youth aged 12-24, the group most prone to dropout, found similar results. The survey question of school attendance was restricted to the current school year. An additional indicator on dropout – children and youth who ever attended school but are currently out of school – was also analysed for both age groups. As with attendance, LEAP did not have an impact on dropout among households in higher income groups but was very important for the lowest quintile.
The increasing popularity and implementation in developing countries of CCTs have prompted debate over the role and effectiveness of conditionality – primarily whether explicit conditions and their enforcement affect the benefit’s performance and thus whether CCTs are more effective than UCTs (Bastagli et al., 2016[2]). Both transfers employ means testing, such as targeting mechanisms and eligibility criteria; debate revolves around the conditions on which benefits are contingent (Pellerano and Barca, 2017[11]).
Empirical evidence suggests that CCTs tend to be somewhat more successful than UCTs in achieving education and health outcomes (Bastagli et al., 2016[2]). The extent and significance of the effect, however, depends on programme design and implementation. In developing countries, only CCT programmes with strong monitoring and enforcement mechanisms had a more significant impact on school enrolment rates than UCTs (Baird et al., 2013[4]). Moreover, stronger conditions than attendance, such as graduation, have a larger effect on secondary education enrolment and attendance (Barrera-Osorio et al., 2008[12]; Saavedra and Garcia, 2012[13]). Overall, conditionality plays an important role in education outcomes, as long beneficiaries perceive them as enforceable. CCT programmes without proper monitoring have been shown to have a smaller impact than equivalent unconditional schemes that were strongly labelled (Bastagli et al., 2016[2]).
CCTs tend to have a larger positive impact than UCTs on hospital births, prenatal care visits and use of medical services. However, it is not clear whether this is due to conditionality and, unlike education outcomes, the effect depends not on enforcement but awareness (Bastagli et al., 2016[2]; IEG, 2014[14]). Several studies highlight the role of communication, perceptions and messaging. As conditionalities can have unanticipated effects, encouraging participants to take certain actions may be more effective.
Conditionality also implies costs for beneficiaries. Poorer households (the main target) that are located far away from health clinics may have higher time and transport costs to comply with compulsory health checks. Poorer households also often have more children, requiring more frequent visits. Studies also highlight CCTs’ particular impacts on women, who are typically made the main beneficiaries: in some cases, CCTs may reinforce traditional gender roles and increase women’s work burden.
Conditionality also implies implementation costs related to enforcement and awareness raising (Pellerano and Barca, 2017[11]). The elements that enable conditionality to have a significant impact on outcomes imply higher costs and an increased administrative burden in terms of implementation. The role and efficiency of conditionality depends on both policy design and the institutional context of each country (Pellerano and Barca, 2017[11]).
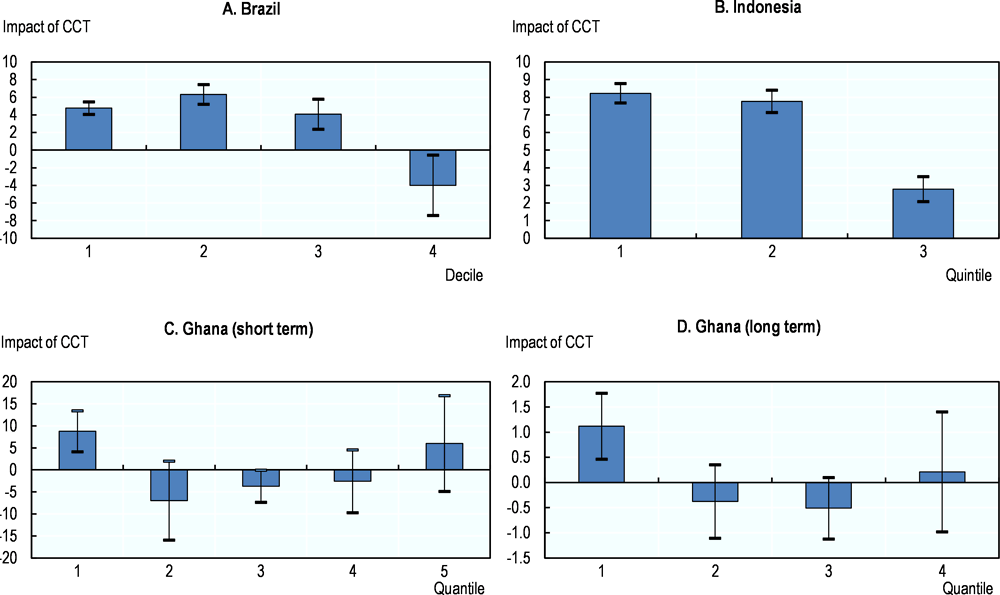
Notes: Blue bars indicate coefficient values; black error bars indicate 95% confidence intervals. If zero is within the confidence interval, the coefficient is considered not statistically significant. For Brazil, school enrolment is estimated for youth aged 14-25. and for Indonesia, school attendance is estimated for youth aged 5-18 LEAP impact evaluations were carried out twice after the programme started in 2008: 2012 (short-term impact) and 2016 (long-term impact).
Source: Authors’ calculations based on data from Pesquisa Nacional por Amostra de Domicilios (Brazilian National Household Sample Survey) (2011-15), ibge.gov.br/estatisticas-novoportal/sociais/saude/9127-pesquisa-nacional-por-amostra-de-domicilios.html, household evaluation data (2010-16) from Ghana’s Livelihood Empowerment Against Poverty programme, and data from the 2016 Indonesian National Socio-Economic Survey (SUSENAS), https://microdata.bps.go.id/mikrodata/index.php/catalog/SUSENAS.
Educational attainment (years of schooling obtained) is another outcome important for future labour market outcomes. Analyses for Brazil and Indonesia show that CCTs have a positive impact on educational attainment among the poorest children and youth (first decile in Brazil; first quintile in Indonesia) (Figures 2.4A and 2.4B). The effect, however, is negative for children in the second to fourth deciles in Brazil, although not statistically significant. In Indonesia, the effect is positive in the second quintile and negative in the third.
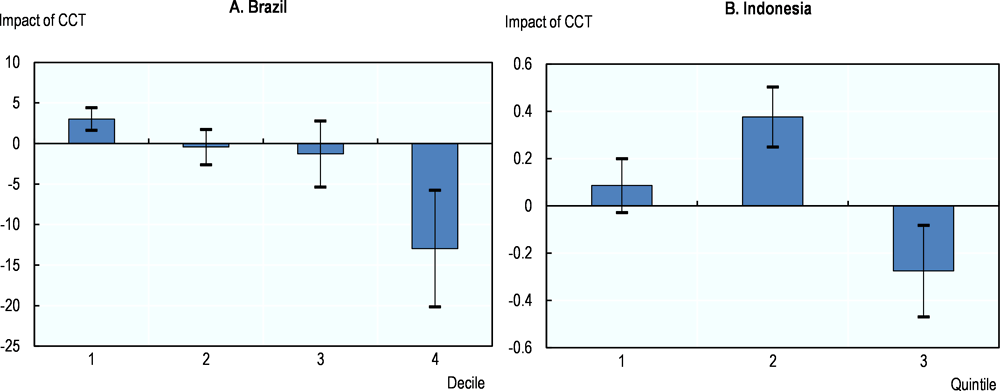
Note: Blue bars indicate coefficient values; black error bars indicate 95% confidence intervals. If zero is within the confidence interval, the coefficient is considered not statistically significant.
Source: Authors’ calculations based on data from Pesquisa Nacional por Amostra de Domicilios (Brazilian National Household Sample Survey) (2011-15), ibge.gov.br/estatisticas-novoportal/sociais/saude/9127-pesquisa-nacional-por-amostra-de-domicilios.html, and data from the 2016 Indonesian National Socio-Economic Survey (SUSENAS), https://microdata.bps.go.id/mikrodata/index.php/catalog/SUSENAS.
Conditional cash transfers appear to have the strongest effect on poor students
These results show that the effect of CCTs on education outcomes are strongest among children in poorer households in Brazil, Ghana and Indonesia. In Brazil, the magnitude of the effect on attendance is strongest in the first two deciles, while CCTs have a positive effect on attainment in the first decile. In Ghana and Indonesia, the effect on school attendance is strongest in the poorest income groups, while the same holds for educational attainment in Indonesia.
CCTs thus appear most important to outcomes among poorer income groups, likely because the poorest households are typically more credit constrained, and additional income can play a big role in making schooling affordable. Results also point to the importance of CCTs in disrupting intergenerational poverty and their role in affecting the future labour market opportunities of the poorer part of the population, which can ultimately contribute to more inclusive growth.
Scholarships tend to impact positively on educational attainment of the poorest students
Indonesia’s Bantuan Siswa Miskin (BSM), renamed Program Indonesia Pintar (PIP), is another education-focussed social assistance programme introduced in 2008 to cover indirect education costs (e.g. transport, uniforms), which can be a major barrier to access for lower-income households. Benefits are paid to poor households unable to pay elementary, junior high or senior high school tuition fees.
Estimations show that the BSM has a strong positive impact on attendance and attainment. The effect is statistically significant in all income groups, with the strongest effect in the first quintile for both outcomes, implying that the scholarship is particularly important for the poorest students. This is in line with previous evidence showing that the BSM raises education spending and reduces child labour in households at the bottom of the welfare distribution (De Silva and Sumarto, 2015[15]). Similarly, a study on Cambodia showed that a three-year scholarship for poor students upon completing elementary school significantly increased educational attainment. However, the study found no evidence that the scholarships affect test scores, employment or earnings (Filmer and Schady, 2014[16]). Hence, scholarships for poor students can have positive effects on enrolment and attainment but do not automatically lead to better educational achievement or labour market outcomes.
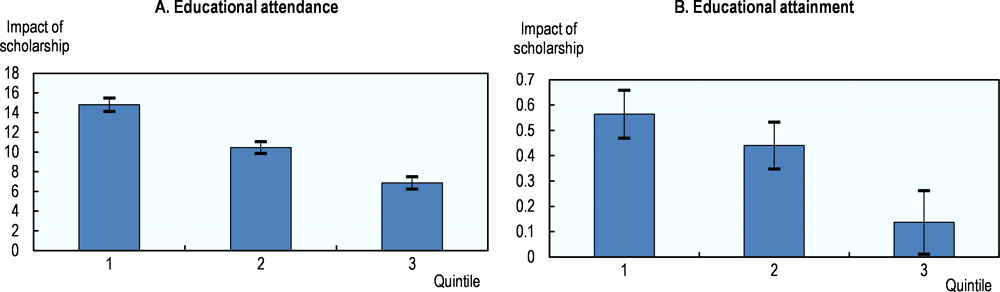
Note: Blue bars indicate coefficient values; black error bars indicate 95% confidence intervals. If zero is within the confidence interval, the coefficient is considered not statistically significant.
Source: Authors’ calculations based on data from the 2016 Indonesian National Socio-Economic Survey (SUSENAS), https://microdata.bps.go.id/mikrodata/index.php/catalog/SUSENAS.
Overall, the new empirical analysis of social assistance in developing countries points to positive impacts on school attendance and educational attainment, in line with previous empirical findings for both CCT and UCT programmes (Bastagli et al., 2016[2]).
Conditional cash transfers are likely to reduce child labour
Additional CCT income may also reduce the necessity for children to contribute to household income, reducing child labour within and outside households. Transfers linked to or conditional on children attending school are likely to have an even stronger effect on child labour. About half of reviewed studies found that cash transfers showed a reduction effect on child labour participation (working or not working); all that investigated labour intensity (hours worked) found a reduction effect (Bastagli et al., 2016[2]). A majority of studies reporting a negative relationship between cash transfers and child labour participation concerned Latin American programmes, while no studies in sub-Saharan Africa found a significant impact.
The new empirical analysis of CCTs’ impact on child labour in Brazil shows that Bolsa Família significantly reduces the likelihood that a child aged 4-13 works (Figure 2.6). The effect is about the same in all four deciles analysed but slightly stronger in the first to third deciles.
Notes: Blue bars indicate coefficient values; black error bars indicate 95% confidence intervals. If zero is within the confidence interval, the coefficient is considered not statistically significant. Child labour is defined as children aged 3-14 who work.
Source: Authors’ calculations based on data from Pesquisa Nacional por Amostra de Domicilios (Brazilian National Household Sample Survey) (2011-15), ibge.gov.br/estatisticas-novoportal/sociais/saude/9127-pesquisa-nacional-por-amostra-de-domicilios.html.
Conditional cash transfers may not reduce early pregnancy
Last, CCTs can affect children and youth through impacts on early pregnancy. Delaying childbearing is an important factor in improving young women’s education and health outcomes and, in the long term, disrupting intergenerational poverty. Cash transfer income can reduce financial dependency and delay marriage and childbearing decisions (Bastagli et al., 2016[2]). CCTs can also have an indirect effect on early pregnancy through positive effects on educational attainment.
However, analysis of Bolsa Família shows that the CCT income has no effect on the likelihood of early pregnancy (Figure 2.7). The effect is negative for girls in the poorest quintiles but not statistically significant in any of the estimations. Hence, even if CCT programmes have positive effects on school attendance, their positive effect on other child and youth outcomes cannot be assumed. A study on two Colombian CCT programmes with crucial design differences showed that the type of conditions matter: conditioning on educational attainment had no reduction effect, while a renewal condition based on performance and a permanent loss of the benefit if the attendance condition is not fulfilled reduced early pregnancy (Cortés, Gallego and Maldonado, 2016[17]).
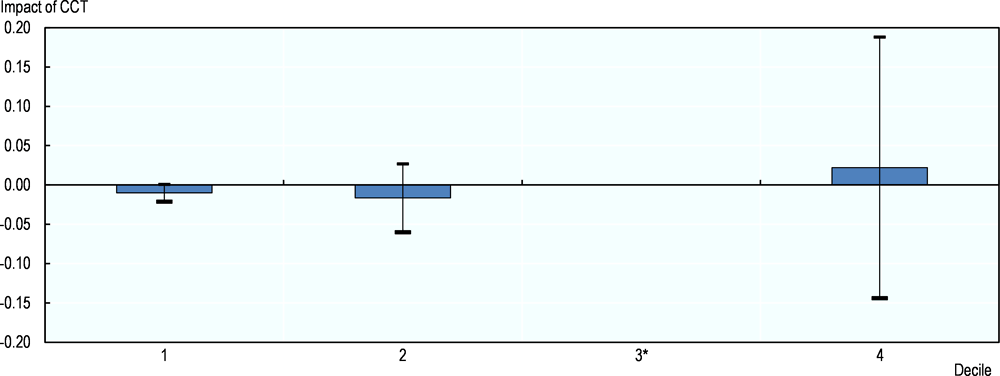
* Decile 3 is excluded from analysis due to too few observations.
Notes: Blue bars indicate coefficient values; black error bars indicate 95% confidence intervals. If zero is within the confidence interval, the coefficient is considered not statistically significant. Bars show the effects of a 10% increase in household income from CCTs. Early pregnancy is defined as girls younger than age 16 who have ever had a child.
Source: Authors’ calculations based on data from Pesquisa Nacional por Amostra de Domicilios (Brazilian National Household Sample Survey) (2011-15), ibge.gov.br/estatisticas-novoportal/sociais/saude/9127-pesquisa-nacional-por-amostra-de-domicilios.html.
Universal child benefits seem to have no or limited effects on education
Universal child benefits, or family cash benefits, are cash transfers to cover the cost of children, reduce child poverty and improve long-term opportunities for children. They exists in almost all countries with developed welfare; 31 of 34 Organisation for Economic Co-operation and Development countries had a child benefit system in 2015 (OECD, 2016[18]).
Child benefits can affect well-being through two main channels: 1) the increase in income can allow households to buy more goods and services for children; and 2) child transfers can reduce stress and improve relationships in households, improving emotional well-being (Laetitia and Mao Takongmo, 2018[19]). Child benefits are most often universal and not based on income or employment conditions. Their effect thus likely differs from other redistribution programmes, such as CCTs, that target poor and vulnerable households.
A study of the impact of universal child benefits in Canada finds no evidence that the programme improves child and parent outcomes at the aggregate level but does show modest positive impacts on households with low education and on girls (Laetitia and Mao Takongmo, 2018[19]).
Analysis for this report looks at the impact of child benefits on educational outcomes in Germany. Child benefits, together with parental allowance and maternity benefits, are among the main components of German family policy. Child benefits’ two main purposes are to ensure the minimum subsistence level of children and to boost fertility rates.
The analysis includes the ten years surrounding the 1996 child benefit reform (e.g. 1992-2001) to increase the sample size. Results do not show any statistical impact of child benefits for either outcome variable analysed: secondary school attainment and attending the best secondary school track, gymnasium (grammar school). Child benefits may need to be higher to have perceptible effects in a developed country with a sophisticated welfare state and close to universal benefits and services. This is consistent with results showing that child benefit income mainly has a major impact on disadvantaged families, while universal benefits do not seem to affect household well-being (Gaitz and Schurer, 2017[20]; Deutscher and Breunig, 2018[21]).
Impact of social assistance on working-age individuals and the elderly
Social protection can play an important role in ensuring income security for working-age individuals and the elderly, affecting their well-being and that of household members dependent on their income. During working age, social assistance programmes can affect both labour and employment outcomes, such as participation and intensity, and other outcomes, such as fertility rates and entrepreneurship.
Conditional cash transfers appear to have mixed effects on employment
The impact of cash transfers on labour force participation and employment holds substantial interest for researchers and policy makers. The empirical literature shows relatively weak support for the hypothesis that social assistance dramatically reduces incentives to work. Overall, there is no systematic evidence that cash transfers discourage work and lead to dependency (Peterman, Yablonski and Daidone, 2018[5]; Banerjee et al., 2017[22]; Baird, McKenzie and Özler, 2018[23]).
Modest transfers tend not to be strongly associated with changes in labour supply in either participation or intensity (hours worked). Evidence for the most studied social assistance programmes, CCTs and UCTs, is mixed. In a review of eight studies on CCTs’ impact on labour supply, only one found a negative impact on participation, while a reduction in hours worked was found in a few countries, including Uruguay and Brazil (Kabeer and Waddington, 2015[24]). Another review of the effect of CCTs and UCTs found that, of eight studies, three pointed to an increase in participation and one to a decrease. Of eleven studies reporting on hours worked, three found a decrease (one reported decreases among older people). Sixteen studies specifically addressed female participation, and four found a significant positive impact (Bastagli et al., 2016[2]). Thus, evidence in the empirical literature on the link between CCTs and labour market outcomes is inconclusive but indicates that 1) modest transfers do not have strong impacts on employment outcomes; and 2) any significant impact found may be negative or positive.
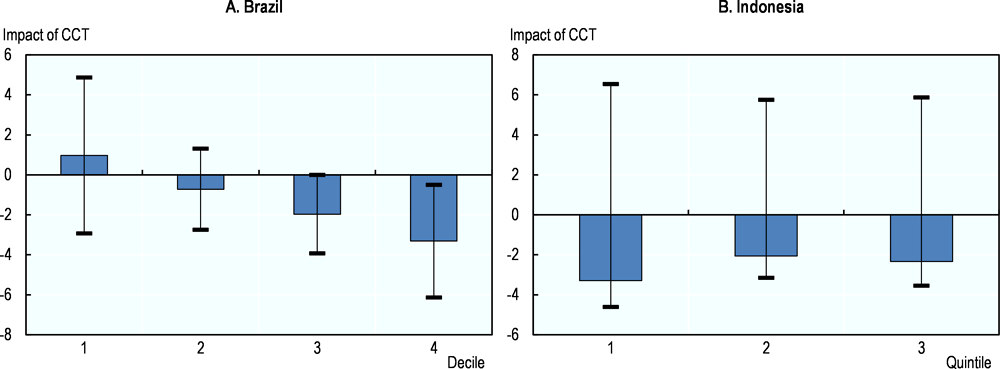
New empirical evidence on CCTs’ impact on employment in Brazil and Indonesia presented in this study is also mixed. In Brazil, receiving CCT income from Bolsa Família leads to an increase in employment among men in the two lowest deciles, although the effect is only statistically significant in the second decile. In the third and fourth deciles, the effect is negative and statistically significant (Figure 2.8A). By contrast, in Indonesia, receiving a CCT is associated with lower employment among men in the lower income groups and with higher employment in the third quintile (Figure 2.8B).
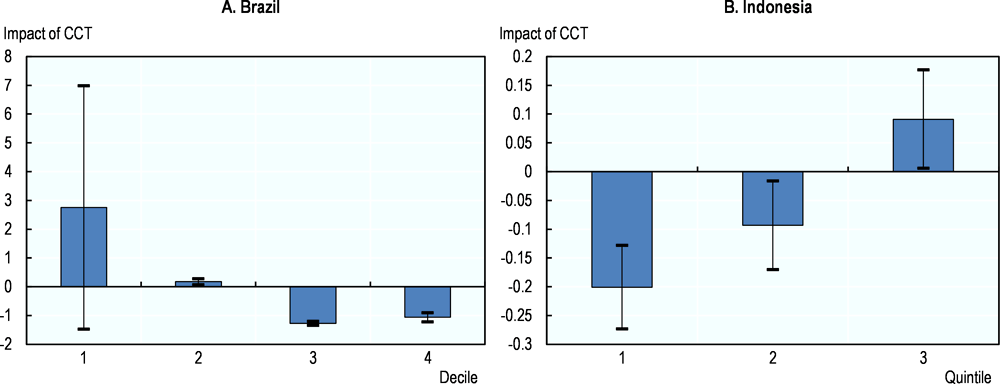
Notes: Blue bars indicate coefficient values; black error bars indicate 95% confidence intervals. If zero is within the confidence interval, the coefficient is considered not statistically significant. Employment is defined as individuals aged 16-64 who work at least one paid hour per week or are employed but on vacation or other paid leave.
Source: Authors’ calculations based on data from Pesquisa Nacional por Amostra de Domicilios (Brazilian National Household Sample Survey) (2011-15), ibge.gov.br/estatisticas-novoportal/sociais/saude/9127-pesquisa-nacional-por-amostra-de-domicilios.html, and data from the 2016 Indonesian National Socio-Economic Survey (SUSENAS), https://microdata.bps.go.id/mikrodata/index.php/catalog/SUSENAS.
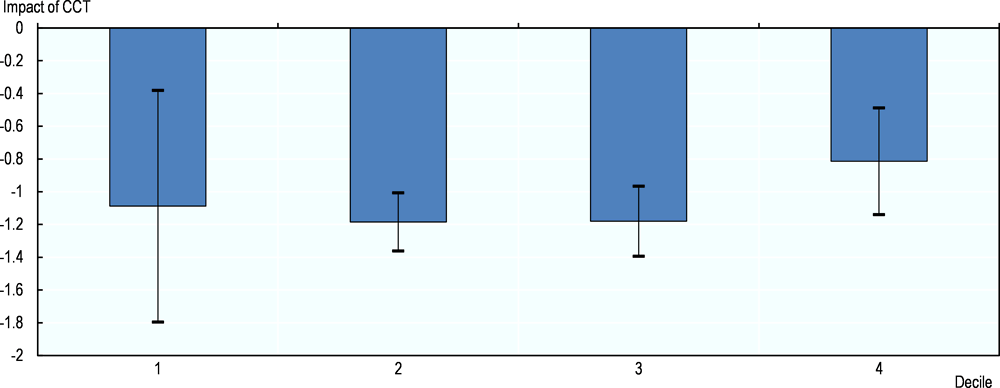
The impact of CCTs on female employment is more consistent across income groups but, again, in opposite directions between the two countries. In Brazil, CCT income has a clear negative impact on female employment in all deciles, with a stronger effect in the third and fourth deciles (Figure 2.9A). This is consistent with some literature showing that, because women are often the main recipients of CCT income, time spent fulfilling conditions may hamper labour market participation. In Indonesia, however, CCT income increases female employment in all income groups (Figure 2.9B).
Both previous literature and new evidence thus paint a mixed picture of CCTs’ impact on labour supply. Literature reviews of outcomes of the same CCT programme in different studies confirm this. For instance, a review of eight studies on the effect of Bolsa Família on adult employment found a positive impact in five cases and a negative impact in one (for female heads of households). Three out of five studies reported a small decrease in hours worked per week (two studies only concerned women) (Batista De Oliveira and Soares, 2012[25]).
Note: Blue bars indicate coefficient values; black error bars indicate 95% confidence intervals. If zero is within the confidence interval, the coefficient is considered not statistically significant.
Source: Authors’ calculations based on data from Pesquisa Nacional por Amostra de Domicilios (Brazilian National Household Sample Survey) (2011-15), ibge.gov.br/estatisticas-novoportal/sociais/saude/9127-pesquisa-nacional-por-amostra-de-domicilios.html, and data from the 2016 Indonesian National Socio-Economic Survey (SUSENAS), https://microdata.bps.go.id/mikrodata/index.php/catalog/SUSENAS.
Conditional cash transfers tend to have positive or no effects on investments in small businesses
Additional income from cash transfers can help households overcome liquidity and credit constraints and better cope with risks, thereby encouraging investments in business activities and entrepreneurship. Previous studies on the impact of cash transfers on non-agriculture business investments show mixed results. Four of nine studies in a review found a significant increase either in the share of households involved in non-farm enterprises or in total household expenditure on business-related assets and stocks, four found no effect, and one found a decrease in business investments from cash transfers (Bastagli et al., 2016[2]).
From the new empirical evidence on CCTs’ impact on the probability of owning businesses, business owners and the self-employed are very heterogeneous, from self-employed street vendors lacking other employment opportunities to entrepreneurs generating new ideas, products and jobs. Separate analyses were therefore carried out for small, informal businesses and larger, registered businesses in Brazil and Indonesia. Data in Ghana do not allow for the distinction.
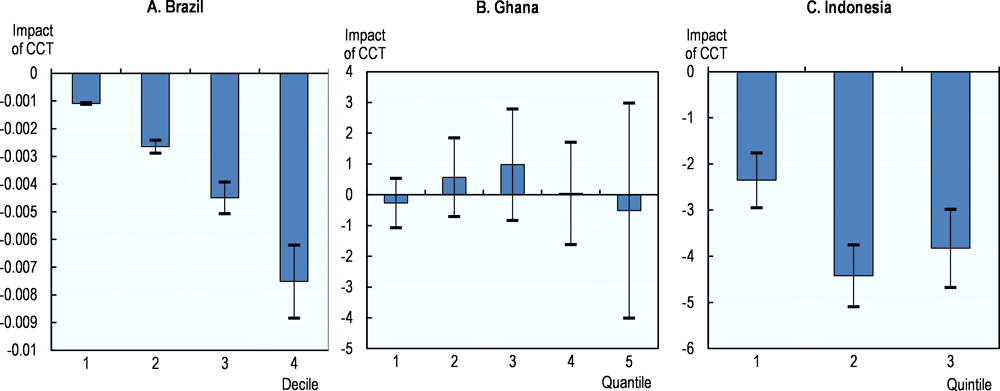
Brazil defines starting a business as households that created one in the year preceeding the interview. Business start-up includes both the self-employed and employers who have been at the activity for one year or less. CCT income has a positive and statistically significant effect on starting small, unregistered businesses in the first two deciles (Figure 2.10A). No effect was found in higher income groups: the coeffients are negative but not statistically signficant.
Previous studies investigating the impact of LEAP income on business investments in Ghana show that beneficiaries invest in livelihood diversification, with a significant number engaging in non-farm businesses and livestock raising (Handa et al., 2014[26]; Handa and Park, 2012[27]). LEAP was introduced in 2008. Analysis for this report focuses on non-agriculture business start-up in the two years preceding subsequent surveys, i.e. a binary response on whether households commenced non-farm enterprises in 2010-12 (short-term impact) and 2014-16 (long-term impact). Although the coefficient for the lowest quintile is positive, results show no statistically significant impact of LEAP income on business start-up in all income groups in either the short or long term (Figure 2.10B).
Indonesia analysis looks at business ownership among self-employed individuals without employees (vs. start-ups in Brazil and Ghana). CCT income has a positive and statistically significant impact on business investments in all income groups (Figure 2.10C).
Notes: Blue bars indicate coefficient values; black error bars indicate 95% confidence intervals. If zero is within the confidence interval, the coefficient is considered not statistically significant. Results for Ghana are evaluated for 2014-16 (long-term impact). Independent variables used are: household created an informal business in the 12 months before the survey (Brazil); household created a business in the 12 months before the survey (Ghana); at least one household member is self-employed with temporary staff (Indonesia).
Source: Authors’ calculations based on data from Pesquisa Nacional por Amostra de Domicilios (Brazilian National Household Sample Survey) (2011-15), ibge.gov.br/estatisticas-novoportal/sociais/saude/9127-pesquisa-nacional-por-amostra-de-domicilios.html, household evaluation data (2010-16) from Ghana’s Livelihood Empowerment Against Poverty programme, and data from the 2016 Indonesian National Socio-Economic Survey (SUSENAS), https://microdata.bps.go.id/mikrodata/index.php/catalog/SUSENAS.
Conditional cash transfers do not seem to impact investments in formal businesses
Separate analyses were conducted in two countries for more formal business activities (probability of having started a registered business in the 12 months before the survey in Brazil and probability of running a business with employees in Indonesia). Business ownership is here defined as the self-employed or business owners who pay social security tax in Brazil and as self-employed household members with permanent staff in Indonesia. Analysis of CCTs’ impact on formal business activities shows a positive but not statistically significant result in the first income group in Brazil (Figure 2.11A), while the effect in the second to fourth deciles is negative and statistically significant only in the fourth. Indonesia shows a negative but not statistically significant effect in all income groups (Figure 2.11B). The positive impact on informal business activities among poorer households does not hold for larger or more formal businesses, which have greater potential to contribute to economic growth and job creation.
Notes: Blue bars indicate coefficient values; black error bars indicate 95% confidence intervals. If zero is within the confidence interval, the coefficient is considered not statistically significant. Businesses included in the analysis are defined as those that are registered (Brazil) and businesses with employees (Indonesia).
Source: Authors’ calculations based on data from Pesquisa Nacional por Amostra de Domicilios (Brazilian National Household Sample Survey) (2011-15), ibge.gov.br/estatisticas-novoportal/sociais/saude/9127-pesquisa-nacional-por-amostra-de-domicilios.html, and data from the 2016 Indonesian National Socio-Economic Survey (SUSENAS), https://microdata.bps.go.id/mikrodata/index.php/catalog/SUSENAS.
Conditional cash transfers can reduce fertility rates
Cash transfers may affect other individual and household outcomes, including fertility. Regular cash transfers for children can encourage larger households, to increase the transfer amount, particularly if 1) transfers are on a per-child basis, instead of a lump sum household benefit; and 2) the programme remains open to subsequent children. Concerns that cash transfers (especially UCTs) may increase fertility rates and negatively affect population control programmes have been put forward in policy discussions in low-income countries, where fertility rates tend to be high. However, little existing empirical evidence supports these concerns. In fact, studies show that, in many cases, the opposite is true: cash transfers lead to a statistically significant decrease in number of pregnancies among beneficiaries (Bastagli et al., 2016[2]). As regards UCTs, recent studies have shown that the common perception according to which these transfers tend to increase fertility do not withstand rigorous evaluation (Peterman, Yablonski and Daidone, 2018[5]; Palermo et al., 2016[28]). New evidence for this report on CCTs’ impact on fertility in Brazil, Ghana and Indonesia corroborates these results.
While Brazil’s population will peak around 2030, it currently has a low total fertility rate (around 1.8). Higher fertility may spur macroeconomic growth. For poor families, however, higher fertility means more mouths to feed and may perpetuate poverty traps. Analysis of the impact of Bolsa Família income on fertility focuses on whether women aged 20-49 have had a child in the last two years. Results show that the benefit significantly reduced fertility overall and in all income groups (Figure 2.12A). All results are statistically significant. This is in line with previous literature on the benefit’s impact on number of children in beneficiary households (Simões and Soares, 2012[29]).
In Ghana, concerns that cash transfers may have negative effects on population control programmes and programmes that promote quality of life for poor mothers are common in the policy discourse. However, analysis of the impact of LEAP income on number of children born in a household in the two years before the survey shows no statistically significant relationship in any income group (Figure 2.12B).
The total fertility rate in Indonesia is 2.4, above the replacement level of 2.1. As in Ghana, a relatively common concern is that targeted cash transfers incentivise poor families to have more children. Estimations of the impact of CCT participation on fertility, however, show the opposite: receiving PKH CCTs is associated with reduced fertility (presence of children under age 1) in all income groups (Figure 2.12C).
Consistent with previous literature, these results run counter to concerns that CCT income increases fertility rates. If anything, they reduce them.
Note: Blue bars indicate coefficient values; black error bars indicate 95% confidence intervals. If zero is within the confidence interval, the coefficient is considered not statistically significant.
Source: Authors’ calculations based on data from Pesquisa Nacional por Amostra de Domicilios (Brazilian National Household Sample Survey) (2011-15), ibge.gov.br/estatisticas-novoportal/sociais/saude/9127-pesquisa-nacional-por-amostra-de-domicilios.html, household evaluation data (2010-16) from Ghana’s Livelihood Empowerment Against Poverty programme, and data from the 2016 Indonesian National Socio-Economic Survey (SUSENAS), https://microdata.bps.go.id/mikrodata/index.php/catalog/SUSENAS.
Scholarships for poor students seem to have positive spillover effects on household food consumption and investments
Education scholarships can have impacts beyond labour supply and education outcomes. Cash transfers targeting poorer households can address liquidity and credit constraints, allowing households to increase consumption and invest in productive assets and business activities. Results based on PIP student scholarship data for Indonesia show the programme’s positive impact on labour supply, self-employment and food consumption in all income groups, with the exception of self-employment in the first quintile (Figure 2.13). However, overall results are positive and statistically significant, in line with the PKH CCT programme results shown above, indicating that cash transfers for education may free up household financial resources for other investments and help boost household welfare and, indirectly, economic growth and wealth redistribution.
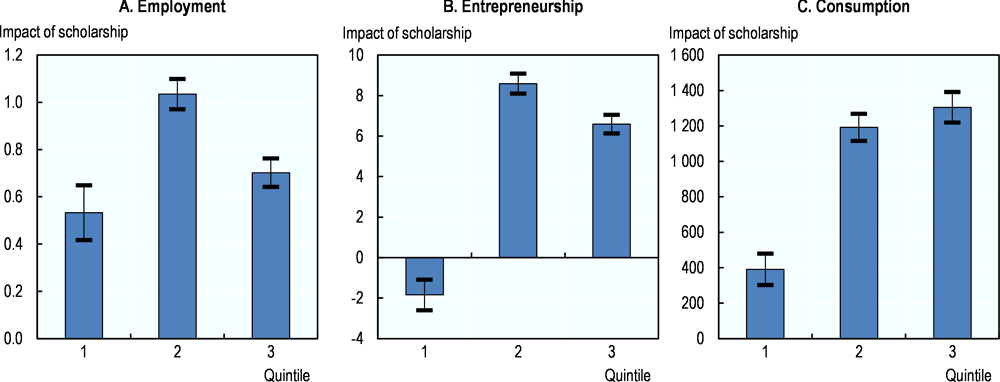
Note: Blue bars indicate coefficient values; black error bars indicate 95% confidence intervals. If zero is within the confidence interval, the coefficient is considered not statistically significant. Food consumption is defined as household per capita caloric intake.
Source: Authors’ calculations based on data from the 2016 Indonesian National Socio-Economic Survey (SUSENAS), https://microdata.bps.go.id/mikrodata/index.php/catalog/SUSENAS.
Social pensions can boost household consumption and investments
Since coverage of contribution-based pension schemes remains low in low- and middle-income countries (see Chapter 3), social pensions have increasingly become a way to expand coverage and address old-age poverty and vulnerability. They also have impacts on other outcomes, such as household consumption and investments. A study shows that social pensions in the People’s Republic of China increase consumption and agricultural investments among rural households, particularly the poor, although they have no effect on savings (Zheng and Zhong, 2016[30]). A study in South Africa shows that social pensions received by women have a large impact on health outcomes (weight and height) of girls but no impact for boys (Duflo, 2003[31]).
Empirical evidence also shows that cash transfers are effective in raising living standards. In Zambia for instance, UCTs have far-reaching effects both on food security and consumption as well as on a range of productive outcomes, and generate large income multipliers through investment in non-farm activity and agricultural production (Palermo et al., 2016[28]).
References
[47] ADB (2012), Republic of Indonesia: Updating and Improving the Social Protection Index, Asian Development Bank, Mandaluyong, Philippines, http://www.adb.org/projects/documents/india-updating-and-improving-social-protection-index-tacr.
[6] Baird, S. et al. (2014), “Conditional, unconditional and everything in between: a systematic review of the effects of cash transfer programmes on schooling outcomes”, Journal of Development Effectiveness, https://doi.org/10.1080/19439342.2014.890362.
[4] Baird, S. et al. (2013), Relative Effectiveness of Conditional and Unconditional Cash Transfers for Schooling Outcomes in Developing Countries: A Systematic Review, No.8, Campbell Systematic Reviews, The Campbell Collaboration, Oslo, https://doi.org/10.4073/csr.2013.8.
[23] Baird, S., D. McKenzie and B. Özler (2018), “The effects of cash transfers on adult labor market outcomes”, IZA Journal of Development and Migration, https://doi.org/10.1186/s40176-018-0131-9.
[22] Banerjee, A. et al. (2017), “Debunking the stereotype of the lazy Welfare recipient: Evidence from cash transfer programs”, World Bank Research Observer, https://doi.org/10.1093/wbro/lkx002.
[12] Barrera-Osorio, F. et al. (2008), “Conditional cash transfers in education design features, peer and sibling effects evidence from a randomized experiment in Colombia”, NBER Working Paper Series, No. 13890, National Bureau of Economic Research, Cambridge, MA, http://www.nber.org/papers/w13890.
[2] Bastagli, F. et al. (2016), Cash Transfers: What Does The Evidence Say? A Rigorous Review of Programme Impact and of the Role of Design and Implementation Features, Overseas Development Institute, London, https://doi.org/10.13140/RG.2.2.29336.39687.
[25] Batista De Oliveira, L. and S. Soares (2012), “O que se sabe sobre os efeitos das transferencias de renda sobre a oferta de trabalho”, Texto para Discussao, No. 1738, Instituto de Pesquisa Econômica Aplicada, Brasília, http://repositorio.ipea.gov.br/bitstream/11058/1161/1/TD_1738.pdf.
[17] Cortés, D., J. Gallego and D. Maldonado (2016), “On the design of educational conditional cash transfer programs and their impact on non-education outcomes: The case of teenage pregnancy”, The B.E Journal of Economic Analysis & Policy, Vol. 16/1, De Gruyter, Berlin, pp. 219-58, https://doi.org/10.1515/bejeap-2014-0162.
[15] De Silva, I. and S. Sumarto (2015), “How do educational transfers affect child labour supply and expenditures? Evidence from Indonesia of impact and flypaper effects”, Oxford Development Studies, Vol. 43/4, Routledge, Abingdon-on-Thames, England, pp. 483-507, https://doi.org/10.1080/13600818.2015.1032232.
[21] Deutscher, N. and R. Breunig (2018), “Baby bonuses: Natural experiments in cash transfers, birth timing and child outcomes”, Economic Record, Vol. 94/304, John Wiley & Sons, Inc., Hoboken, NJ, pp. 1-24, https://doi.org/10.1111/1475-4932.12382.
[31] Duflo, E. (2003), “Grandmothers and granddaughters: Old-age pensions and intrahousehold allocation in South Africa”, The World Bank Economic Review, Vol. 17/1, Oxford University Press, Oxford, England, pp. 1-25, https://doi.org/10.1093/wber/lhg013.
[45] FAO (2013), Qualitative Research and Analyses of the Economic Impacts of Cash Transfer Programmes in Sub-Saharan Africa, Food and Agriculture Organization of the United Nations, Rome, http://www.fao.org/publications.
[41] Federal Republic of Germany (2018), Kindergeld 2018, Bundeszentralamt fur Steuern, Ministry of Finance, Federal Republic of Germany, https://con.arbeitsagentur.de/prod/apok/ct/dam/download/documents/KG2-MerkblattKindergeld_ba015394.pdf.
[35] Federative Republic of Brazil (2018), Manual do Pesquisador – Programa Bolsa Família, Ministerio do Desenvolvimiento Social, Federative Republic of Brazil, Brasília, https://aplicacoes.mds.gov.br/sagirmps/ferramentas/docs/manual_do_pesquisador_gestao_bolsa_familia_semlogo.pdf.
[34] Federative Republic of Brazil (2018), Presidência da República. Decreto nº 9.396, de 30 de maio de 2018, Federative Republic of Brazil, Brasília, http://portal.imprensanacional.gov.br/materia/-/asset_publisher/Kujrw0TZC2Mb/content/id/16782572/do1-2018-06-01-decreto-n-9-396-de-30-de-maio-de-2018-16782568 (accessed on 9 August 2018).
[16] Filmer, D. and N. Schady (2014), “The medium-term effects of scholarships in a low-income country”, Journal of Human Resources, Vol. 49/3, University of Wisconsin Press, Madison, WL, pp. 663-94, https://doi.org/10.3368/jhr.49.3.663.
[20] Gaitz, J. and S. Schurer (2017), “Bonus skills: Examining the effect of an unconditional cash transfer on child human capital formation”, IZA Discussion Papers, No. 10525, IZA Institute of Labor Economics, Bonn, http://www.iza.org (accessed on 3 October 2018).
[52] Glennerster, R. and K. Takavarasha (2013), Running randomized evaluations: a practical guide, Princeton University Press, Princeton.
[9] Hadna, A., K. Dyah and K. Tong (2017), “Evaluation of poverty alleviation policy: Can conditional cash transfers improve the academic performance of poor students in Indonesia?”, Cogent Social Sciences, Vol. 3/1, Taylor & Francis, Abingdon-on-Thames, England, https://doi.org/10.1080/23311886.2017.1295548.
[8] Handa, S. et al. (2016), “The impact of Zambia’s unconditional child grant on schooling and work: results from a large-scale social experiment”, Journal of Development Effectiveness, https://doi.org/10.1080/19439342.2016.1206605.
[27] Handa, S. and M. Park (2012), Livelihood Empowerment Against Poverty Program Ghana Baseline Report, University of North Carolina, Chapel Hill, NC, https://transfer.cpc.unc.edu/wp-content/uploads/2014/09/LEAP_Evaluation_Baseline_Report_Dec_2012.pdf (accessed on 8 November 2018).
[26] Handa, S. et al. (2014), Livelihood Empowerment Against Poverty Program Impact Evaluation, University of North Carolina, Chapel Hill, NC, https://assets.publishing.service.gov.uk/media/57a089ad40f0b649740001f2/LEAP_Impact_Evaluation_FINAL2014march17.pdf (accessed on 8 November 2018).
[32] IDB (2015), “How does Bolsa Familia work? Best practices in the implementation of transfer programs in Latin America and the Caribbean”, Technical Note, No. IDB-TN-856, Inter-American Development Bank, Washington, DC, https://publications.iadb.org/en/publication/17411/how-does-bolsa-familia-work-best-practices-implementation-conditional-cash.
[14] IEG (2014), Social Safety Nets and Gender: Learning From Impact Evaluations and World Bank Projects, Independent Evaluation Group, World Bank Group, Washington, DC, https://ieg.worldbankgroup.org/evaluations/social-safety-nets-and-gender-learning-impact-evaluations-and-world-bank-projects.
[3] ILO (2017), World Social Protection Report 2017–19: Universal Social Protection to Achieve the Sustainable Development Goals, International Labour Organization, Geneva, Switzerland, https://www.ilo.org/wcmsp5/groups/public/---dgreports/---dcomm/---publ/documents/publication/wcms_604882.pdf (accessed on 10 September 2018).
[38] ILO (2016), Child Benefits in Central and Eastern Europe- A Comparative Review, International Labour Organization, Geneva, Switzerland, http://www.ilo.org/budapest/what-we-do/publications/WCMS_532424/lang--en/index.htm.
[37] IPEA (2013), Programa Bolsa Família uma década de inclusão e cidadania, Secretaria de Assuntos Estratégicos da Presidencia da República, Federative Republic of Brazil, Brasília, http://www.mds.gov.br/webarquivos/publicacao/bolsa_familia/Livros/Bolsa10anos_Sumex_Port.pdf.
[24] Kabeer, N. and H. Waddington (2015), “Economic impacts of conditional cash transfer programmes: A systematic review and meta-analysis”, Journal of Development Effectiveness, Vol. 7/3, Taylor & Francis, Abingdon-on-Thames, England, pp. 290-303, https://doi.org/10.1080/19439342.2015.1068833.
[7] Kilburn, K. et al. (2017), “Short-term impacts of an unconditional cash transfer program on child schooling: Experimental evidence from Malawi”, Economics of Education Review, https://doi.org/10.1016/j.econedurev.2017.06.002.
[19] Laetitia, L. and C. Mao Takongmo (2018), “The impact of universal child benefits on family health and behaviours”, Research in Economics, Vol. 72/4, Elsevier Ltd., Amsterdam, pp. 415-27, https://doi.org/10.1016/J.RIE.2018.07.006.
[36] Mathers, N. and R. Slater (2014), Social Protection and Growth: Research Synthesis, Department of Foreign Affairs and Trade, Commonwealth of Australia, Canberra, https://dfat.gov.au/about-us/publications/Pages/social-protection-and-growth-research-synthesis.aspx (accessed on 19 September 2018).
[10] NDPC (2015), Implementation of the Ghana Shared Growth and Development Agenda (GSGDA), 2010- 2013 : Annual Progress Report, National Development Planning Commission, Accra, https://searchworks.stanford.edu/view/10169361 (accessed on 3 October 2018).
[18] OECD (2016), OECD Family Database: Child Benefit Policy Structures, OECD Publishing, Paris, http://www.oecd.org/els/family/IN1_2_Child_benefit_policy_structures.pdf (accessed on 8 November 2018).
[39] OECD (2016), Society at a Glance 2016: OECD Social Indicators, OECD Publishing, Paris, https://dx.doi.org/10.1787/9789264261488-en.
[28] Palermo, T. et al. (2016), “Unconditional government social cash transfer in Africa does not increase fertility”, Journal of Population Economics, https://doi.org/10.1007/s00148-016-0596-x.
[11] Pellerano, L. and V. Barca (2017), “Chapter 13:The conditions for conditionality in cash transfers: Does one size fit all?”, in What Works for Africa’s Poorest, Practical Action Publishing Ltd, Rugby, England, https://doi.org/10.3362/9781780448435.013.
[5] Peterman, A., J. Yablonski and S. Daidone (2018), “Myth-busting? How research is refuting common perceptions”, Innocenti Research Briefs 2017-18, https://www.unicef-irc.org/publications/912-myth-busting-how-research-is-refuting-common-perceptions-about-unconditional-cash.html.
[43] Republic of Ghana (2018), Dashboard, website, Livelihood Empowerment Against Poverty.Ministry of Gender, Children and Social Protection, Government of the Republic of Ghana, Accra, http://leap.gov.gh/dashboard/ (accessed on 13 August 2018).
[46] Republic of Ghana (2018), Payments, website, Livelihood Empowerment Against Poverty. Ministry of Gender, Children and Social Protection., Government of the Republic of Ghana, Accra, http://leap.gov.gh/management/payments/ (accessed on 13 August 2018).
[44] Republic of Ghana (2015), Ghana National Social Protection Policy, Ministry of Gender, Children and Social Protection, Government of the Republic of Ghana, Accra, http://mogcsp.gov.gh/index.php/mdocs-posts/ghana-national-social-protection-policy/.
[49] Republic of Indonesia (2018), Regulation of the Social Ministry of the Republic of Indonesia Number 1 Year 2018 about Program Keluarga Harapan, Government of the Republic of Indonesia, Jakarta, http://peraturan.go.id/kementerian-sosial-nomor-%201%20tahun%202018-tahun-2018.html.
[51] Republic of Indonesia (2016), Tanya Jawab Kartu Indonesia Pintar, website, Ministry of Education and Culture, Government of the Republic of Indonesia, Jakarta, http://indonesiapintar.kemdikbud.go.id/.
[40] Riphahn, R. and F. Wiynck (2017), “Fertility effects of child benefits”, IZA Discussion Paper, No. 10757, IZA Institute of Labor Economics, Bonn, http://www.iza.org/en/publications/dp/10757/fertility-effects-of-child-benefits (accessed on 15 November 2018).
[13] Saavedra, J. and S. Garcia (2012), “Impacts of conditional cash transfer programs on educational outcomes in developing countries A meta-analysis”, RAND Labour and Population Working Paper Series, No. WR-921-1, RAND Corporation, Santa Monica, CA, http://www.rand.org/pubs/working_papers/WR921-1.html.
[29] Simões, P. and R. Soares (2012), “Efeitos do Programa Bolsa Família na fecundidade das beneficiárias”, Revista Brasileira de Economia : RBE, Vol. 66/4,Associação Brasileira de Estatística, São Paulo, pp. 533-56, http://www.scielo.br/pdf/rbe/v66n4/v66n4a04.pdf (accessed on 08 November 2018).
[33] STN (2016), Gasto Social do Governo Central 2002 a 2015, Secretaria Do Tesouro Nacional, Federative Republic of Brazil, Brasília, http://www.fedepsp.org.br/superior/gasto_social_01_02.pdf.
[1] World Bank (2018), ASPIRE: The Atlas of Social Protection- Social Safety Net Expenditure Indicators (database), World Bank Group, Washington, DC, http://datatopics.worldbank.org/aspire/indicator/social-expenditure (accessed on 1 August 2018).
[48] World Bank (2017), Towards a comprehensive, integrated, and effective social assistance system in Indonesia, World Bank Group, Washington, DC, http://documents.worldbank.org/curated/en/535721509957076661/Towards-a-comprehensive-integrated-and-effective-social-assistance-system-in-Indonesia.
[42] World Bank (2016), “Ghana: Social Protection Assessment and Public Expenditure Review”, World Bank Group, Washington, DC, http://documents.worldbank.org/curated/en/776791491300371576/Ghana-Social-protection-assessment-and-public-expenditure-review.
[50] World Bank (2012), Bantuan Siswa Miskin Cash Transfers for Poor Students: Social Assistance Program and Public Expenditure Review 5, World Bank Group, Washington, DC, http://documents.worldbank.org/curated/en/776791491300371576/Ghana-Social-protection-assessment-and-public-expenditure-review.
[30] Zheng, H. and T. Zhong (2016), The impacts of social pension on rural household expenditure: Evidence from China, Taylor & Francis, Abingdon-on-Thames, England, https://doi.org/10.1080/17487870.2015.1041524.
This annex provides a brief description of social assistance in the countries under study, in particular of the programmes covered in the empirical analysis.
Brazil
Despite large expenditure on social protection, Brazil spends only 1.4% of gross domestic product (GDP) on social assistance, which covers only 23.7% of the population (World Bank, 2018[1]). Schemes tend to target the poorest quintiles; however, coverage rates are significantly lower in Brazil than in the rest of Latin America and Caribbean (Annex Table 2.A.1). Nonetheless, social assistance programmes have had a significant equalising effect in Brazil, reducing the Gini coefficient by 2.8%, the poverty headcount ratio by 10.9% and the poverty gap by 23.6% in 2015 (World Bank, 2018[1]).
The federal government created Brazil’s flagship CCT, Bolsa Família, in 2003, which has since benefited over 14 million low-income households (IDB, 2015[32]). It represents a large share of social assistance expenditure but a small share of overall social protection spending: Brazil spent an equivalent to approximately 0.45% of GDP on the scheme in 2015 (STN, 2016[33]).
The programme targets households in poverty or extreme poverty: according to the National Decree No. 9.396 of 30 May 2018, those with a monthly per-capita income below BRL 178 (Brazilian real) (USD 48.7 [United States dollar]) and BRL 89 (USD 24.4)1, respectively (Federative Republic of Brazil, 2018[34]). The scheme grants several types of benefits based on household per-capita income or composition, which are conditional on health and education requirements (Annex Table 2.A.2). Households in extreme poverty are entitled to the Basic Benefit (BB) of BRL 89 per month per household, irrespective of composition. Households remaining below the extreme poverty line after all entitled benefits are eligible to receive the Benefit to Overcome Extreme Poverty (BSP), a top-up to guarantee a monthly per-capita income of BRL 89 (Federative Republic of Brazil, 2018[35]).
Households below the poverty line are also entitled to Variable Benefits (BV) of BRL 41 per pregnant or lactating woman and/or per child under age 15, and to the Variable Youth Benefit (BVJ) of BRL 48 per youth aged 16-18 (Federative Republic of Brazil, 2018[34]). These last two benefits are conditional on maintaining a minimum of school attendance, acquiring all vaccinations and receiving prenatal care (IDB, 2015[32]; Federative Republic of Brazil, 2018[35]). Entitlement to these benefits is not automatic; even if eligibility is met, households are still subject to the amount of benefits allocated per municipality through quotas calculated every ten years based on demographic censuses.
Bolsa Família has had a large effect on equality, helping 36 million people escape poverty, reducing income inequality by 13% in a decade and reducing the Gini coefficient by 21% after one year of implementation (Mathers and Slater, 2014[36]; IDB, 2015[32]). Moreover, the CCT has improved the education of the low-income population, keeping 16 million children and youth in school (IPEA, 2013[37]).
Germany
Despite being a relatively low expenditure compared with the overall social protection budget, the 2.17% of GDP allocated to social assistance is within the regional average and covers 100% of children through child benefits (ILO, 2017[3]). Benefits have ensured the minimum subsistence level of children and increased fertility rates: due to social assistance transfers, 2013 showed a 50% reduction in child poverty (ILO, 2016[38]) and 1995-2015 showed a rise in the fertility rate, from 1.25 to 1.5 (OECD, 2016[39]).
Child benefits date to 1935, but the current integrated system was established through a reform allowing households to choose cash transfers (Kindergeld) or tax deductions (Kinderfreibetrag). The reform came into effect in January 1996, affecting all families with children, irrespective of their date of birth, and introducing significant increases to benefit levels alongside the structural changes. Child-related transfers increased for almost all households, the magnitude of the increase varying by income level and number of children (Annex Figure 2.A.1). In 1995, parents of a single child received a child benefit of EUR 48 per month (euro) (EUR 576 per year) and could deduct EUR 2 824 from taxable income, which accrued savings of EUR 0 to EUR 1 497 per year, depending on their tax rate. After the 1996 reform, parents of a single child either received EUR 135 per month (EUR 1 625 per year) or could deduct EUR 4 241 from income tax. The latter was therefore favourable for parents with a tax rate higher than 38.3%.
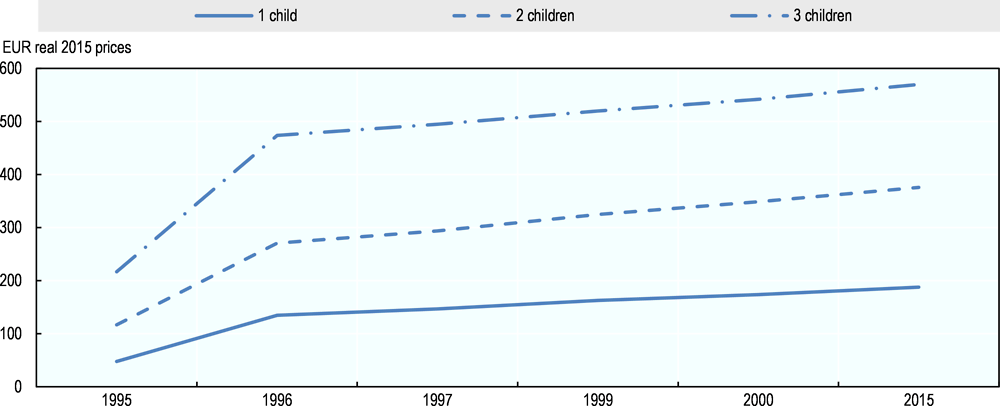
Notes: Figure displays total value of child benefits based on number of children in 2015 constant euro. In 1995, total benefit value for households with more than one child varied by income: EUR 96-138 for two children; EUR 144-289 for three children; EUR 192-454 for four children. Figure displays mean values.
Source: Author’s calculations based on Riphahn and Wiynck (2017[40]), “Fertility effects of child benefits”, IZA Discussion Paper, www.iza.org/en/publications/dp/10757/fertility-effects-of-child-benefits.
Kindergeld is a monthly UCT provided to all parents or guardians of young people under age 18 (or, exceptionally, those under age 25 enrolled in vocational training) (ILO, 2016[38]). The monthly stipend per child depends on order of birth: EUR 194 for each of the first two children, EUR 200 for the third child and EUR 225 for each subsequent child (Federal Republic of Germany, 2018[41]).
Ghana
Social assistance expenditure and coverage in Ghana are low even by regional standards: equivalent to 0.6% of GDP and covering 1.4% of the total population (World Bank, 2016[42]; 2018[1]). Following the trend in sub-Saharan Africa, although social assistance programmes aim to target the poor and vulnerable, coverage rates are significantly higher in the wealthiest quintile than in the poorest (Annex Table 2.A.3).
LEAP is one of five flagship social protection programmes in Ghana. It is one of the main social assistance programmes and the only cash transfer scheme, amounting to an equivalent of 0.03% of GDP in terms of expenditure (World Bank, 2016[42]). Piloted in 2008 with 30 000 beneficiary households in 21 districts, it has expanded to 213 044 households in 216 districts in a decade (Republic of Ghana, 2018[43]). It falls under the mandate of the National Protection Strategy, and aims to support basic human needs and to serve as a springboard out of poverty (Republic of Ghana, 2015[44]). Although LEAP intends to tackle poverty, not all of the extremely poor are eligible to receive the cash transfer, as only households with members that fall into certain social categories can benefit (Annex Table 2.A.4). One medium-term priority is to extend eligibility criteria to all of the poor and link the scheme to additional benefits (Republic of Ghana, 2015[44]).
Currently, eligibility extends to households with members who are either older than age 65 without support, people with disabilities with no productive capacity, orphaned and vulnerable children, or pregnant or mothers with infants (World Bank, 2016[42]). The transfer is unconditional for the elderly and people with disabilities; for children and mothers, it is dependent on soft conditions, such as school enrolment and postnatal clinic attendance (Annex Table 2.A.4). The grant is paid in six instalments per year, and its value varies according to number of eligible household members, from GHS 64.0 (Ghanaian cedi) per payment for one member, GHS 76.0 for two, GHS 88.0 for three and up to GHS 106.0 for four or more (a range of USD 13.4 to USD 22)2 (Republic of Ghana, 2018[46]).
Indonesia
The largest share of social protection expenditure in Indonesia goes to social assistance programmes, corresponding to 0.7% of GDP (World Bank, 2018[1]). Although this is below the regional average of 1.2% of GDP, social assistance coverage is more extensive in Indonesia than in East Asia and Pacific (Annex Table 2.A.5). These programmes have had a significant effect on inequality and poverty reduction, resulting in a 4.6% decrease in the Gini coefficient and a 38.2% decline in the poverty gap (World Bank, 2018[1]).
PKH, a household-based CCT, is one main social assistance scheme. Piloted in 2007, it became a national programme to alleviate short-term poverty and increase investments in health and education (ADB, 2012[47]). Although allocated only 8.5% of social assistance expenditure, it is the most effective in Indonesia. By 2016, it covered 6 million households, providing benefits to 30.5% of the poor and 12.6% of the vulnerable, and led to a 22.0% increase in growth monitoring check-ups and a 10.0% increase participation rate in high school (World Bank, 2017[48]).
Eligibility is based on household income and composition: those classified poor or extremely poor with at least one member who is either under age 21, people with disabilities pregnant or lactating, or over age 60 (Annex Table 2.A.6). Transfers are paid on a quarterly basis and dependent on completion of relevant health, education or social welfare conditions (World Bank, 2017[48]). In 2017, the value of the benefit changed from variable based on household composition to fixed at, currently, IDR 1 890 000 (Indonesian rupiah) (USD 129)3 per year per household (Republic of Indonesia, 2018[49]). Households receive the benefit for up to six years, as long as they remain eligible and comply with conditions. Those still under the poverty line after this period are eligible for the transfer for an additional three years (World Bank, 2017[48]).
Launched in 2008 as Bantuan Siswa Miskin (BSM), PIP is another key social assistance scheme aimed to reduce the costs of accessing education through cash transfers to poor students. It has led to an unprecedented 4.6% increase in high school enrolment (World Bank, 2012[50]). It is the third-largest social assistance programme by expenditure and coverage, receiving 16.8% of the social assistance budget and reaching over 19.5 million students (World Bank, 2017[48]).
The scheme targets enrolled students or school-age children aged 6-21 from the poorest 25% of households who either have a Kartu Indonesia Pintar (KIP card) or a Kartu Perlindungan Sosial/Kartu Keluarfa Sejahtera (KPS/KKS card), which make them automatically eligible for the PKH (Republic of Indonesia, 2016[51]). Eligible students verified by their schools are entitled to annual cash transfers corresponding to their education level: IDR 450 000 for elementary, 750 000 for junior high school and IDR 1 000 000 for senior high school (World Bank, 2017[48]).
Estimating the causal effect of social assistance and growth outcomes is challenging due to endogenity, stemming from three main sources: i) reverse causality, ii) sample selection and iii) omitted variables.
Estimating the impact of social assistance programmes on individual and household outcomes involves finding a credibly counterfactual, i.e. the value an outcome would have taken if a given individual or household who benefited from a social assistance programme had not benefited. However, data on this counterfactual value cannot be obtained since an individual/household is never observed having both received and not received social assistance at the same point in time.
There are different ways of estimating counterfactual outcomes, including random assignment, “quasi-experimental” methods like instrumental variables and regression discontinuity (RDD), and non-experimental methods such as regression techniques, matching, and double (or higher-order) differencing. Every estimation method has its strengths and weaknesses.
The main estimation method used to estimate the impact of social assistance on household and individual outcomes in this report is instrumental variables. A good instrument is uncorrelated with the outcome variable but related to the explanatory variable it is instrumenting. This design estimates impacts of social assistance programmes through statistical econometric models in two steps. The first is to predict program participation based on the instrumental variable. The second is to calculate the programme impact given the predicted value of the first equation. Identifying a good instrumental variable is however challenging. For example, individuals receiving social assistance may be more likely to require other family members to care for them and reduce labour force participation in the household, creating a false negative causal relation between household social assistance income and labour force participation. In addition, most cash transfer programmes with an aim to increase school attendance and attainment target the most vulnerable households, while vulnerable families are less likely to keep their children in school. If this is not taken into account in the evaluation of programme outcomes, the analysis may result in a spurious negative causal relation between cash transfer income and schooling.
An instrumental approach was used in all three countries with CCT programmes (Brazil, Ghana and Indonesia). In Brazil, the instrument used is municipality CCT benefit quota (using a proxy for municipality defined using a combination of state and sampling stratum due to lack of a municipality identifier in the survey). In Ghana, the methodological approach follow the approach by Glennerster and Takavarasha (2013[52]) by using the ex-ante treatment assignment as an instrument for the ex post treatment variable, the percentage of all income that is derived from LEAP benefits. This instrumental variable approach involves using a 2SLS method to get the estimates for the impact of the programme. In Indonesia, instrumental variables include household expenditure, household size, household head education, area of residence, housing conditions (e.g. floor, roof), and access to basic infrastructure services, equipment and ICT (e.g. water, sanitation, electricity, refrigerator, computer).
The analysis of the child benefit programme in Germany adopted a slightly different methodology. The estimation strategy made use of a change in the level of the child benefit over time. A major reform of child benefits came into effect on 1 January 1996 and affected all families with children. Prior to the reform, the family benefit system was twofold: child benefits (Kindergeld) and tax-exempt child allowances (Kinderfreibetrag) complemented each other and occurred simultaneously. The reform integrated both systems and since 1996, households have to choose between child benefits and tax deductions. At the same time, both benefits increased significantly in value. As a result, child-related transfers increased for almost all households, but the magnitude of the increase varied according to income level and the number of children. The empirical analysis uses a difference-in-differences strategy exploiting the heterogeneity of the reform's effects of the child benefit depending on household income and number of children. The strategy does however not allow for an estimation of the effects of the child benefits by income classification (e.g. decile or quintile) since income – or its proxy, education – is used to build treatment and/or control groups.
Notes
← 1. Based on an exchange rate of BRL 3.654 per USD for 2018 according to OECD National Accounts Statistics: https://data.oecd.org/conversion/exchange-rates.htm#indicator-chart.
← 2. Exchange rate: GHS 1 = USD 0.2079.
← 3. Exchange rate: IDR 1 = USD 0.000068.