Chapter 7. Bringing space to earth with data-driven activities
This chapter examines the growing volume and variety of satellite data and signals, and how they affect downstream applications such as weather and climate monitoring, earth observation and satellite positioning, navigation and timing. Trends in big data and digitalisation are also creating new opportunities. Building on advances in analytics and machine learning, innovative ecosystems of start-ups are using satellite data and signals in original ways and developing brand new products and services.
The statistical data for Israel are supplied by and under the responsibility of the relevant Israeli authorities. The use of such data by the OECD is without prejudice to the status of the Golan Heights, East Jerusalem and Israeli settlements in the West Bank under the terms of international law.
Introduction
Satellites produce increasing amounts of data and signals that can be commercially exploited. A significant share of these data comes from institutional programmes for earth observation, weather and climate monitoring and satellite navigation, many of which are free and open for everyone to use.
Furthermore, with the decreasing costs of producing and launching single satellites and commercial constellations, more and more organisations produce their own sets of data. The volume and variety of satellite data will significantly increase in the near future. Next-generation satellites and small satellite constellations will provide higher spatial resolution and increased spectral coverage combined with higher revisit times. All of these trends are opening ever more opportunities for start-ups developing new products and services based on data analytics and artificial intelligence.
This chapter examines some of these developments in greater detail, focusing on the growth in satellite data and signals and how this affects specific applications, notably weather and climate monitoring, earth observation and satellite navigation. A final section is devoted to the growth in activities building on data analytics and artificial intelligence.
Exponential growth in the availability of satellite data and signals
Satellites cover the entire earth’s surface, including highly isolated, hard-to-reach areas. Also, depending on the type of the orbit from which the satellite is rotating the earth, a satellite may return to the same spot of observation at roughly the same time every day, facilitating the systematic collection of data over time. Every day, earth observation satellites gather enormous amounts of information about the earth’s physical, chemical and biological systems for civil, military and commercial purposes.
There are some 135 civil institutional earth observation missions in orbit carrying instruments from almost 30 economies/agencies, as recorded by the Committee on Earth Observation Satellites (CEOS), the co-ordinating body for earth observation missions (CEOS, 2018[1]) (Figure 7.1). This does not include the more than 30 weather satellites constituting the core space infrastructure of the World Meteorological Organization’s Integrated Observing System (WIGOS) (WMO, 2019[2]). Agencies in the United States, the People’s Republic of China (hereafter “China”), Europe and France participate in the highest number of missions. Several national missions are joint operations with the military or public-private partnerships (CEOS, 2018[1]).
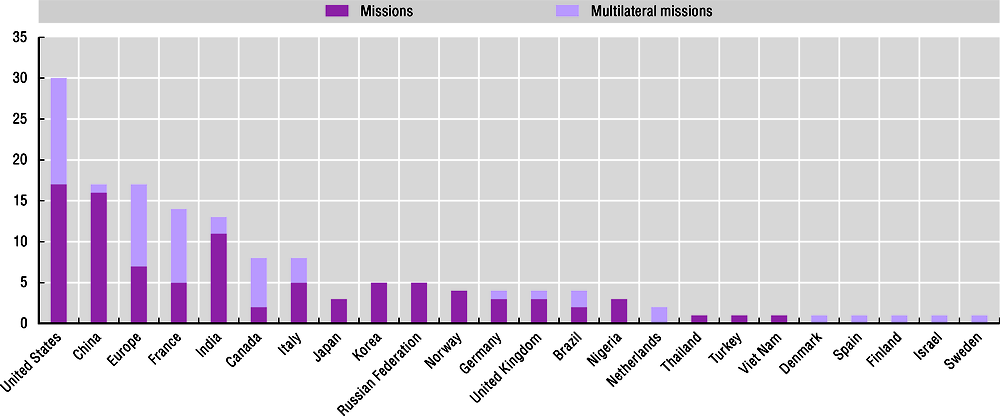
Note: Only includes missions recorded in the CEOS database and excludes weather satellites part of the World Meteorological Organization’s Integrated Global Observing System (WIGOS). Multilateral missions refer to missions including two or more countries/institutions and have multiple counts.
Source: Adapted from CEOS (2018[1]), “CEOS Database: Catalogue of satellite missions”, in CEOS Earth Observation Handbook, http://database.eohandbook.com/database/missiontable.aspx.
More than 30 missions are multilateral, with two or more economies contributing mission instruments. The United States, Europe and France participate in the highest number of multilateral missions (some 18, 10 and 9 multilateral missions, respectively).
Each mission flies one or several instruments, typically collecting multi-purpose land imagery (optical, multispectral, radar) or environmental observations (CEOS, 2018[1]). Several space agencies may each be responsible for the management of data generated by each instrument. For example, the Netherlands currently has two instruments in orbit, OMI (Ozone Monitoring Instrument) on the US satellite AURA, and TROPOMI (TROPOspheric Monitoring Instrument) on the European Sentinel-5P satellite. The Royal Netherlands Meteorological Institute processes and analyses the scientific data from these two instruments.
More than 100 earth observation missions are currently being prepared or considered for 2019-30, as shown in Figure 7.2, with some 26 foreseen launches in 2019 (CEOS, 2018[1]). It is important to note that the number of planned launches decrease over the time period, because of uncertainty in long-term mission planning, not because of less planned missions.
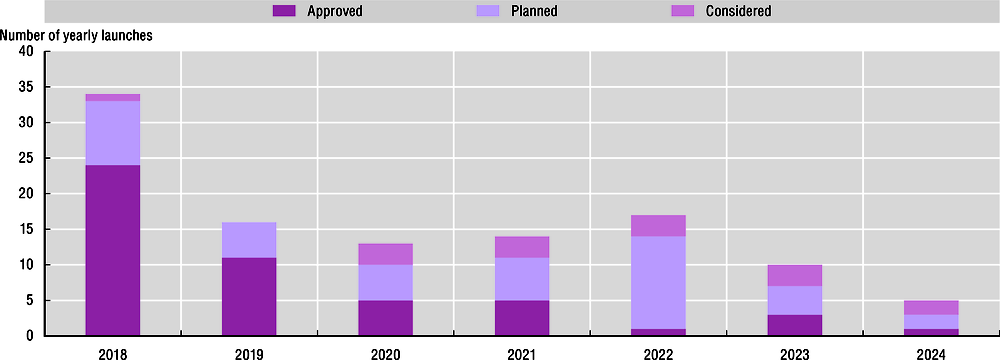
Note: Only includes missions recorded in the CEOS database and excludes weather satellites part of the World Meteorological Organization’s Integrated Global Observing System (WIGOS).
Source: Adapted from CEOS (2018[1]), “CEOS Database: Catalogue of satellite missions”, in CEOS Earth Observation Handbook, http://database.eohandbook.com/database/missiontable.aspx.
The growing number of satellites as well as the increasing performance, complexity and resolution of instruments are leading to an explosion in the volume of data generated by earth observation satellites. For example, a single Sentinel-1 satellite in the European Copernicus constellation is able to map the world once every 12 days (ESA, 2017[3]) and produces an estimated 1.5 petabytes (1015) of raw data per year (OECD, 2016[4]). Similarly, the future joint Indian/US mission NISAR scheduled for launch 2021 for dual frequency synthetic aperture radar observations, is expected to produce some 7.2 petabytes of data per year, or 19.9 terabytes every day (Murphy, 2017[5]). From 2012 to 2018, the data volume from some fifteen European and US satellite missions has grown from an annual 2 petabytes to now more than 12.5 petabytes (Schreier, 2015[6]). This is an important challenge for long-term data storage and handling, as more missions develop.
In terms of data policies for all these missions, governments have created a multitude of programmes and initiatives to encourage the commercial use of satellite data and signals, many of which are starting to bear fruit. This includes open data policies and the development of specific services and applications to make data more accessible to the public. This is not specific to the space sector. All across the OECD, governments work to enhance access to publicly funded data (Box 7.1).
Data access and sharing represents a growing priority for policymakers in the science, technology and innovation (STI) domain and beyond in our knowledge-based society. Enhanced access to publicly funded data for STI brings indeed a number of benefits, such as economic growth, improved transparency and accountability, while contributing to public trust in research.
A number of initiatives have been introduced at both international and national levels to promote enhanced access to and sharing of data. International initiatives are typically recommendations and guidelines on data access, data preservation, and interoperability (e.g. OECD Recommendation on Access to Research Data from Public Funding; the Findable, Accessible, Interoperable and Reusable (FAIR) Principles). There is also the European Commission Open Data and Public Sector Information Directive, which aims to facilitate the availability and re-use of public sector data.
As demonstrated by ongoing OECD work in the framework of the Committee for Scientific and Technological Policy (CSTP), many challenges need to be addressed when drafting data access policies for publicly funded data:
-
Balancing the benefits and risks of data sharing: The benefits of enhanced access to data need to be balanced against the issue of costs, privacy, security, IPR and preventing malevolent uses.
-
Ensuring that technical standards and practices keep up with the pace of technological progress: Technology development far outpaces standard-setting, creating regulatory gaps. Implementing the FAIR principles is an important initiative to close this policy gap.
-
Defining responsibility and ownership: New technologies (e.g. text and data mining) and public-private partnerships create new challenges in terms of IPR protection and “data privatisation”.
-
Formulating appropriate incentives and rewards that value data-sharing: More remains to be done to raise researchers’ awareness of open-government data and enhance the appeal of sharing access to data.
-
Creating business models and funding for enhanced data sharing: Costs are most often borne by data providers, while benefits accrue to users. Although shared access to data does not necessarily mean free data, in many research fields, data are expected to be provided free of charge at the point of use.
-
Building human capital and institutional capabilities to manage, create, curate and reuse data.
-
Developing legal frameworks for the exchange of sensitive data across borders: Sensitive datasets can be shared on a more restricted basis with trusted and certified users. International legal frameworks that ensure similar levels of legal protection for cross-border exchanges are missing.
Source: OECD (forthcoming), Enhanced Access to Publicly Funded Data for Science, Technology and Innovation, OECD Publishing, Paris.
Governments are taking steps to make earth observation data as accessible as possible to external users. This is not only a question of granting formal access, but also, increasingly, of finding technological solutions for storing, processing and sharing ever growing amounts of data. Data from several institutional missions are free and open to use for both research and commercial purposes (NASA, 2018[7]; ESA, 2018[8]). Indeed, when looking at instrument/mission combinations currently in orbit (including weather satellites), there is open access to data from 261 of 390 instruments, or almost 70% (as shown in Figure 7.3). Open access may in some cases require user registration or formal requests for data (advanced protocol), and there may also be some restrictions on the timeliness, size and formats of data downloads (CEOS, 2018[9]). Ninety-two instruments, or 24%, have restricted data access (CEOS, 2018[9]), providing exclusive national or regional access (e.g. the Russian Federation) or for commercial reasons (e.g. the Italian Cosmo-SkyMED constellation, the French SPOT and Pleiades satellites, German TerraSAR-X and TanDEM-X) (CEOS, 2018[9]). Restricted data repositories may still grant affordable conditional access to specific users (CEOS, 2018[9]). This is an improvement compared with data access of decommissioned instruments, where about 40% of instruments had restricted data access (CEOS, 2018[9]).
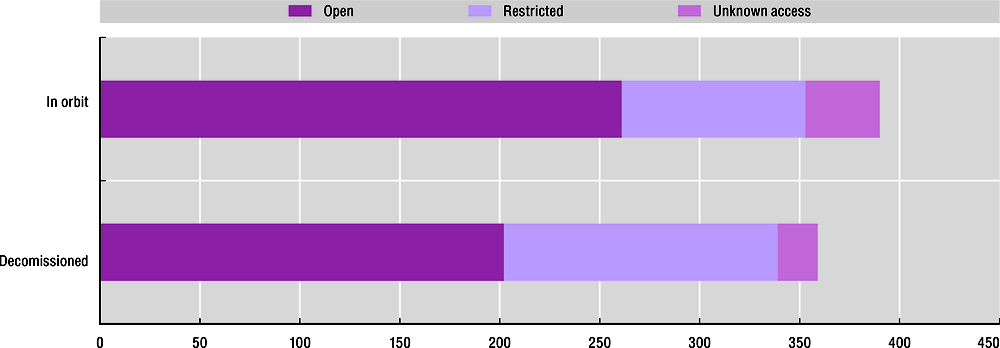
Source: Adapted from CEOS (2018[9]), CEOS virtualization environment (COVE) portal, http://www.ceos-cove.org/en/.
Earth observation data are processed and distributed via distribution centres at both the national and international level, such as the World Data Centre for Remote Sensing of the Atmosphere, hosted by the German Aerospace Center (DLR), ESA’s GEOSS Portal, or the NASA EOSDIS image archives (Schreier, 2015[6]; ESA, 2018[10]; Davies, 2015[11]).
The US National Oceanic and Atmospheric Administration (NOAA) is the owner and steward of enormous amounts of climate and earth observation data. Although most of NOAA’s data are open, only a small share have been easily accessible. This was the underlying rationale for launching the Big Data Partnership research project in 2015, where academic and commercial actors (Amazon Web Services (AWS), IBM, Google and University of Chicago’s Open Commons Consortium) partnered with NOAA to host and process selected datasets. The objective of the project was to evaluate ways to provide NOAA’s vast amounts of data to the public while at the same time enabling new economic opportunities (Wooldridge, 2016[12]).
One of NOAA datasets, NEXRAD Level II, compiles data from a ground-based network of weather radars that contributes to the “analysis and early detection of tornadoes, rain, ice, snow, flash floods, hail, and destructive wind”. Starting in 2015, the NEXRAD Level II 1991-2015 data archive, including more than 270 (compressed) terabytes and 180 million files, was transferred to AWS, Microsoft, and Google, with AWS the first provider to make the dataset available on the cloud. AWS also arranged a feed from real-time NEXRAD data, provided by the University Corporation for Atmospheric Research (UCAR). In this way, archived and real-time data could be accessed simultaneously, via the same mechanism.
Results were very positive. The project resulted in a doubling in the volume of accessed NEXRAD data between 2013 and 2016, while there was a 50% reduction in the volume of data delivered from NOAA servers. 80% of NEXRAD archive orders are now fulfilled by AWS. Among users, the Climate Corporation, one of the partnering organisations, found that the combined access to both real-time and archived data shortened research projects by several months and made it possible to carry out evaluations on larger datasets. Furthermore, new research opportunities were identified (e.g. bird migration, mayfly studies).
Source: Ansari et al. (2018[13]), “Unlocking the potential of NEXRAD data through NOAA’s big data partnership”, Bulletin of the American Meteorological Society, https://doi.org/10.1175/BAMS-D-16-0021.1.
Several countries have also taken extra steps to make data available for societal and commercial applications, by creating national data portals, for example the Geoscience Data Cube in Australia, satellittdata.no in Norway, Satellite Data Portal in the Netherlands, a digital data platform in New Zealand (Australian National Computational Infrastructure, 2018[14]; Norwegian Space Centre, 2018[15]; Netherlands Space Office, 2018[16]; Centre for Space Science Technology, 2017[17]). The Committee on Earth Observation Satellites and other partners supported the 2018 launch of the Africa Regional Data Cube. In Europe, five industrial consortia have been assigned by the European Union to provide scalable computing and storage platforms, so-called Data and Information Access Services, in order to facilitate the third-party access and use of Copernicus data (ESA, 2017[18]).
Zooming in on weather and climate monitoring
Satellite observations play an essential role in weather and climate monitoring. Geostationary satellites provide imagery to identify real-time weather patterns and perform short-term forecasts. Data from polar-orbiting satellites are increasingly used in numerical weather projection models. This increased use and reliance on satellite systems in weather and climate monitoring has a positive impact on weather forecast performance, and on the economy and society as a whole.
Weather
Satellite observations have been used in weather forecasting for more than 50 years. Today, satellite sensors (e.g. infrared and microwave sounders, imagers, GPS receivers for radio occultation) provide data on the state of the atmosphere and ocean surface and play an essential role in preparing weather analyses, forecasts, advisories and warnings, as well as monitoring the climate. For example, the European Centre for Medium-Range Weather Forecasts, an intergovernmental meteorological research organisation, reports that the number of satellite instruments that it actively uses in numerical weather prediction models has significantly increased in the last 10 years, from 12 to 50 between 2000 and 2013 (English et al., 2013[19]). In France, satellites provide 93% of data used in Météo-France’s Arpège model (OECD, 2014[20]).
Three main types of satellites provide data for weather and climate monitoring: geostationary and polar-orbiting weather satellites and selected environmental satellites. These weather satellites are operated by national agencies in China, France, India, Japan, Korea, the Russian Federation, the United States and EUMETSAT for Europe, and are co-ordinated by the World Meteorological Organization (WMO).
As of early 2019, there are 20 geostationary weather satellites orbiting the earth at an altitude of about 36 000 km (Table 7.1). The geostationary orbit follows the earth’s rotation, so that the satellite remains continuously fixed above the same position. The satellites’ positioning at different longitudes along the equator allows global coverage. Another 17 polar-orbiting weather satellites (at a much lower altitude, some 850 km) circle the earth in sun-synchronous orbit. Sun-synchronous satellites revisit a given spot on Earth every day at the same hour (e.g. “morning” or “afternoon” satellites), making some 14-15 orbits per day, depending on the satellite’s distance from Earth (Table 7.2). Beyond the technical aspects, the set-up of these geostationary weather satellites is a great example of a very practical international cooperation and coordination scheme that benefits billions of individuals, with information feeding into daily weather forecasts.
In addition, the WMO counts another 84 low-earth orbit satellites contributing to the WMO Integrated Global Observing System (WIGOS), measuring selected climate parameters (WMO, 2019[2]). 25% of these are bilateral or multilateral missions, with different countries contributing instruments. For instance, the National Aeronautics and Space Administration (NASA) in the United States is co-operating with the Japan Aerospace Exploration Agency (JAXA) on the GMP Core Observatory, while the French space agency, the Centre national d’études spatiales (CNES), is co-operating with India on two different missions (Megha-Tropiques and SARAL) (WMO, 2019[2]).
The value of satellite weather and climate observations has been subject to several cost-benefit analyses (for example Gray (2015[24]; EUMETSAT, 2014[25])). An effective weather service (including both space and terrestrial observations) has been found to bring numerous socio-economic benefits through lives saved, cost avoidances (flood and storm damage avoidance for property and infrastructure, etc.), efficiency gains (e.g. route planning optimisation for marine and air transport; improved capacity planning and anticipation of demand for the energy sector; improved planning and fertiliser use in agriculture, etc.) (Gray, 2015[24]; EUMETSAT, 2014[25]). A recent cost benefit analysis of the Chinese Public Weather Service, using willingness-to-pay methodology, found a very high national cost-benefit ratio of 1:26 (Yuan, Sun and Wang, 2016[26]) (see also Chapter 2).
The main contribution of weather satellites to weather forecasting is significantly improved forecast accuracy. For instance, according to the UK Met Office statistics on forecast sensitivity to observations, weather satellites (geostationary and polar-orbiting) contribute 64% to error reductions in one-day forecasts (EUMETSAT, 2014[25]). Polar-orbiting satellites play a particularly important role, contributing 58% to error reductions, in particular the Metop satellites (EUMETSAT) (24.5%), and the National Oceanic and Atmospheric Administration/Department of Defense (NOAA/DoD) satellites (20.5%) (EUMETSAT, 2014[25]).
Space weather observations allow the monitoring of the sun, and of planetary and interplanetary environments that may affect Earth, such as solar storm and coronal mass ejections (WMO, 2017[21]). These events can produce and project cosmic rays and energetic particles or cause geomagnetic storms, all of which can seriously affect space-based and/or ground-based human activities and infrastructure, causing electrical failure, blocking radio communications, modifying Global Navigation Satellite System (GNSS) signals, etc. Space weather forecasts make it possible to reduce or avoid damage, by diverting or cancelling flights and switching off or putting vulnerable infrastructure in safe mode.
One of the largest geomagnetic storms on record occurred in 1859, disabling telegraph systems in North America and Europe and producing auroras visible as far away from the poles as Hawaii and Queensland, Australia. A coronal mass ejection of similar magnitude, with potential catastrophic consequences, missed the earth by a week in 2012 (NASA, 2014[22]). Knowledge about the potential impact of future events is growing, as more and more countries (Canada, Netherlands, United Kingdom, United States) conduct studies in this domain.
The most recent severe space weather incident took place in Quebec in 1989, when Hydro Québec’s electrical grid was disabled, leaving six million people without electricity for nine hours (Canadian Space Agency, 2017[23]). Several minor events have damaged satellites and disrupted terrestrial electrical and communication networks. In 2005, a solar storm caused a 10-minute disruption to GPS navigation signals.
The World Meteorological Organisation currently lists six satellite missions for space weather observations. Five are US missions and one, the Solar and Heliospheric Observatory (SOHO), is a joint mission between NASA and the European Space Agency (WMO, 2019[2]). Most missions are located at the first Lagrange Point (L 1), some 1.5 million km from Earth in the direction of the sun, and a stable location from which to monitor solar activity. Another joint European-US mission, the Solar Orbiter, is planned for launch in 2020.
Both the European Centre for Medium-Range Weather Forecasts and the German meteorological service have carried out data denial simulations to estimate the impact of the loss of polar-orbiting satellites on short-range forecast accuracy. The European Centre for Medium-Range Weather Forecasts found that a simultaneous loss of both European and US satellites would cause a 15-20% reduction in accuracy (EUMETSAT, 2014[25]). The German meteorological service looked specifically at the impact on the accuracy of short-range forecasts of major (winter) storms. The simulations showed that the absence of satellite observations led to significant errors in determining the severity, location and evolution of the storm (EUMETSAT, 2014[25]).
Climate change monitoring
The need to study and monitor climate change has never been so important, as higher temperatures, rising sea levels, acidification of the ocean – with effects on marine ecosystems – and changing patterns of precipitation, and more extreme weather events are multiplying. The evidence feeds into policy making, as countries aim to achieve strong and inclusive economic growth while reorienting their economies towards development pathways with low greenhouse gas emissions and high resilience to the effects of climate change (OECD, 2017[27]).
International co-operation and co-ordination in monitoring climate variables is mainly carried out by three complementary bodies: the Committee on Earth Observation Satellites (CEOS), responsible for the co-ordination of the earth observation programmes worldwide; the Coordination Group for Meteorological Satellites (CGMS); and the Global Climate Observing System (GCOS), which co-ordinates and leads international climate data collection. A joint CEOS-CGMS Working Group on Climate was established in 2010 and is responsible for implementing the global architecture for climate monitoring from space (Joint CEOS/CGMS Working Group on Climate, 2017[28]; Joint CEOS/CGMS Working Group on Climate, 2018[29]).
To better monitor climate change, the Steering Committee of the GCOS has introduced a number of essential climate variables (ECV), which refer to the “physical, chemical or biological variables that critically contribute to the characterisation of Earth’s climate” (WMO, 2018[30]). Satellite data observations provide significant, and in some cases unique, contributions to more than half of the 50 ECVs that are currently in use (Table 7.4).
Many ECVs are further subdivided into so-called ECV “products”, which are associated with multiple climate data records based on satellite observations and measurements, generally provided by space agencies (e.g. CNES, NASA, JAXA), meteorological agencies (e.g. NOAA, Norwegian Meteorological Institute) or research organisations (e.g. Centre for Polar Observation and Modelling). For instance, the ECV for atmospheric water vapour has three ECV products: total column water vapour, tropospheric and lower-stratospheric water vapour, and upper tropospheric humidity, for which there are currently 59 climate data records. Climate data records can be based on the observations of multiple instruments and satellites, and potentially changing measurement approaches (Joint CEOS/CGMS Working Group on Climate, 2017[28]).
The Joint CEOS/CGMS Working Group on Climate has prepared an inventory of existing and planned climate data records to get an overview of existing resources and to identify gaps, based on inputs from ten CEOS and CGMS members. The inventory has identified a total of 495 existing records, with another 417 firmly planned and approved future records. Future climate data records can be planned for past, current and future satellite missions (Joint CEOS/CGMS Working Group on Climate, 2018[31]).
Most climate data records can be found for the atmospheric sphere (76% of existing products), followed by the oceanic sphere (13%) and the terrestrial sphere (11%), as is illustrated in Figure 7.4. The relatively low number of data records in the land category is due to several factors, including the low temporal resolution of satellite data and a relatively high risk of errors if satellite optical data are used in isolation (cloud cover, poor illumination at high latitudes). Furthermore, the limited availability of in situ data makes it difficult to properly estimate and assess uncertainty (Joint CEOS/CGMS Working Group on Climate, 2017[28]).
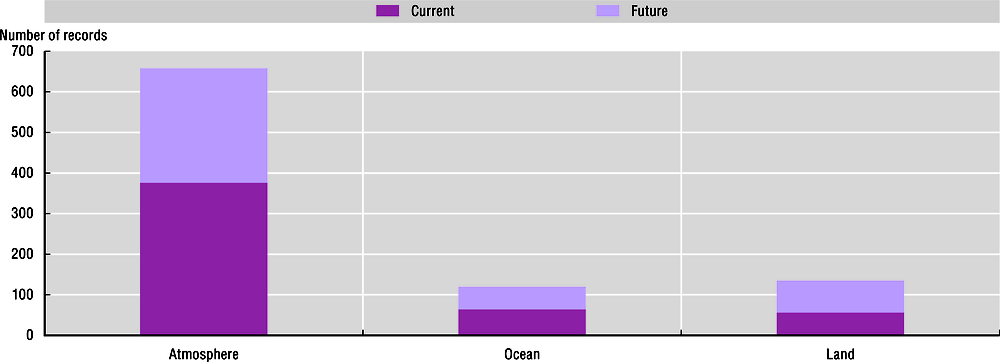
Note: Future climate data records can be planned for past, current and future satellite missions.
Source: Joint CEOS/CGMS Working Group on Climate (2018[31]), ECV Inventory Access, http://climatemonitoring.info/ecvinventory?sorts[Domain]=1.
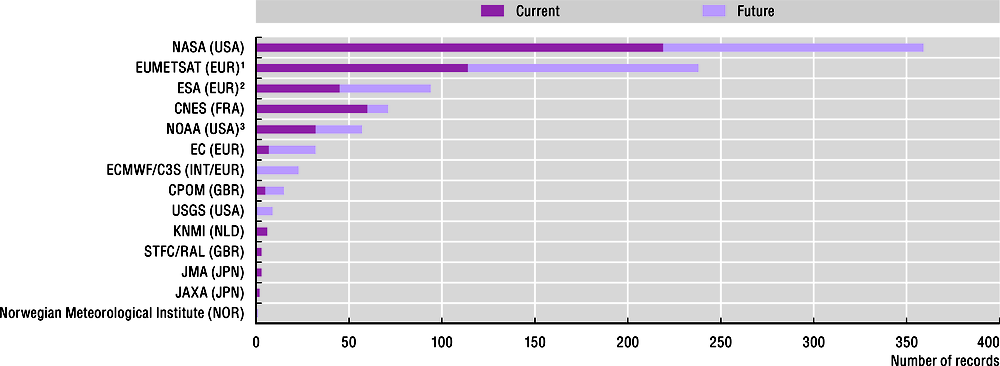
Figure 7.5 shows the distribution of current and future data records by responsible organisation (i.e. data steward). NASA maintains the highest amount of current data records, followed by EUMETSAT, ESA and CNES.
Note: Future climate data records can be planned for past, current and future satellite missions.
1. This includes data records from EUMETSAT, EUMETSAT/CM-SAF, and EUMETSAT/OSI-SAF/Météo-France.
2. This includes data records from the ESA, ESA/DWD and ESA/SatOC.
3. This includes data records from the NOAA/NCEI and NOAA/NCEI/NESDIS.
Source: Joint CEOS/CGMS Working Group on Climate (2018[31]), ECV Inventory Access, http://climatemonitoring.info/ecvinventory?sorts[Domain]=1.
Ensuring continuity of observations
There is a record number of weather and environmental satellites in orbit, but it remains a key priority and challenge to ensure continuity of existing observations, increase coverage and extend the observation systems to include additional parameters identified by international conventions and the scientific community.
The timeliness and accuracy of numerical weather projection models depend on the availability of uninterrupted data series. Although the benefits of weather satellite observations are well documented, funding is limited in several OECD countries and the sustainability of essential long-term data series remains vulnerable. To further improve weather forecasts, more observations are also needed.
In the climate domain, there are also demands for more data. The COP 21 Paris Agreement has for instance identified the need to monitor anthropogenic (human-made) greenhouse-gas fluxes. The GCOS 2016 Implementation Plan also foresees space-borne prototypes for measuring point source fluxes from different emission sources (such as fossil fuel plants) (WMO, 2016[32]).
As it becomes difficult to fund follow-up or new missions, international and inter-agency co-operation and data-sharing arrangements become ever more important to coordinate future activities, address potential data gaps and share costs. Chinese weather satellites will complement polar-orbiting observations in the coming years, and agreements have been made for data exchanges (WMO, 2015[33]). The United States has a bilateral agreement with the Japan Aerospace Exploration Agency (JAXA) for use of specific instrument data, and it is partnering with Europe for a follow-on mission to the Ocean surface topography mission (Jason-2) (WMO, 2015[33]).
The private sector, already heavily represented in weather data processing, analysis and distribution, is increasingly interested in the first-hand collection of satellite observational data. Companies are mainly using nanosatellites equipped with GNSS radio-occultation sensors, a relatively recent technology for atmospheric measurements. Increasingly efficient, current weather nanosatellites could already be capable of observing about half of the essential climate variables, according to private sector reports (Condor, 2018[34]). The United States has started to test the quality and use of commercial weather data, with two pilot projects performed/planned by NOAA since 2016. So far, the first project only covered contracts and data quality assessments, but the second pilot project will be more comprehensive and also look into issues such as the impact on numerical weather prediction models and data rights (St. Jean, 2018[35]). NOAA has identified several challenges in using commercial weather data that will need to be resolved, including the operational stability of data and the potential impact on domestic and international partnerships and data-sharing arrangements (St. Jean, 2018[35]).
Data for navigation, positioning and timing
Modern societies also depend on global navigation satellite systems (GNSS) for precise positioning, navigation and timing. GNSS signals distribute the precise timing information needed by critical infrastructures such as power grids, communications systems and banking operations. They are also invaluable for several government activities and services, such as military operations or emergency response, providing precise information on the positioning of landmarks or personnel. Furthermore, GNSS and related systems play a key role in transportation, for instance enhancing airport safety and capacity, and are one of the key incremental technologies for driverless cars.
Governments are making important infrastructure investments in GNSS and satellite-based augmenting systems (SBAS), and the availability and precision of GNSS signals will significantly increase in the coming 5-10 years.
GNSS systems refer to constellations of satellites that transmit positioning and timing signals to ground receivers (European GNSS Agency, 2018[36]). The constellations, consisting of a minimum of 24 satellites to ensure global coverage, orbit the earth in 6 different planes in the medium-earth orbit, at an altitude of some 20 000 km (US Air Force, 2018[37]). To get an idea of the precision of the broadcasted signals, on a specific day in 2016, the GPS signals in space had an average user range error of some 0.7 metres, 95% of the time (US Air Force, 2018[37]). However, the actual accuracy of signals for terrestrial users will generally be lower and depends on several factors, such as satellite geometry (number of satellites in line of site), atmospheric conditions, local topography and type/level of surrounding built area, indoor/outdoor, receiver design/quality, etc.). Space agencies operate with different estimates for signal accuracy, ranging from 5 metres to more than 30 metres.
There are currently two operational GNSS systems with global coverage: the US Global Positioning System (GPS) and the Russian GLONASS. Two other systems are expected to reach global coverage by 2020: the European system Galileo and the Chinese Beidou constellation, which currently covers China and other countries in the Asia-Pacific region (US Air Force, 2017[38]). Furthermore, there are two regional global navigation satellite systems, the Quasi-Zenith Satellite System (QZSS) in Japan and Navigation with Indian Constellation (NAVIC) in India. The Japanese QZSS constellation, which currently comprises four satellites, became operational in 2018 and is fully compatible with US GPS satellites. In this way, coverage over Japan is increased, which for instance contributes to high-precision positioning in urban areas (e.g. it avoids multipath errors caused by reflections off buildings) (Japanese Cabinet Office, 2018[39]). The Indian seven-satellite NAVIC constellation is similarly interoperable with the US GPS constellation, while ensuring autonomous operations over Indian territory. In early 2018, the Korean government published plans to develop a regional GNSS system, to be operational in the early 2030s (Government of Korea, 2018[40]).
As it is shown in Table 7.5, the constellations provide different types of services, typically a free public service for civilian use, a restricted higher precision service for government applications and sometimes also different types of messaging services, typically for disaster mitigation (e.g. India, Japan).
The accuracy and integrity of the (civil) signals emitted by these GNSS constellations can be further enhanced by both terrestrial and satellite-based augmentation systems (SBAS). SBAS systems consist of networks of precisely located terrestrial reference stations that collect (mainly) GPS satellite measurements which are transmitted to a central processing facility. Messages on satellite signal accuracy and integrity (e.g. detection of satellite faults and anomalies) are then communicated via geostationary satellites across the service area (European GNSS Agency, 2018[41]). In the case of the European Geostationary Navigation Overlay (EGNOS), location accuracy is reportedly improved from 17 metres (using a standard GPS receiver) to 3 metres (European GNSS Agency, 2018[41]). These systems play an important role in aviation, but there are also other applications (e.g. precision agriculture, marine and land transport, mapping/surveying).
Operational SBAS systems include the Wide Area Augmentation System (WAAS) in the United States, the Multi-functional Satellite Augmentation System (MSAS) in Japan, EGNOS in Europe and the GPS Aided GEO Augmented Navigation system (GAGAN) in India. Systems are also being developed in Korea (KASS) and the Russian Federation (European GNSS Agency, 2016[42]; Korean Ministry of Land, Infrastructure and Transport, 2018[43]; FAA, 2018[44]). Australia and New Zealand are currently conducting an SBAS test bed project on both countries’ territories, with testing until 2019 (LINZ, 2017[45]). Table 7.6 summarises these findings.
The growing importance of data hosting, processing and analytics
The last decade has seen the emergence of new types of space downstream services and companies, to a large extent fuelled by the increased availability and quality of government data and signals, advances in data processing and computing capacity, as well as the decreased cost of satellite manufacturing and launch, which has paved the way for more customised commercial constellations.
Activity has been particularly strong in earth observation and positioning, navigation and timing. The number of recorded companies with earth observation activities in Europe and Canada doubled between 2008 and 2016, from about 250 to 500 companies (EARSC, 2017[46]). Commercial applications are diverse, ranging from the surveillance of remote infrastructures and installations, precision agriculture, naval vessel tracking, and land management and planning. Earth observation data are also increasingly combined with other data to create value-added products and services, e.g. different weather products for the maritime and agro-business industries to optimise vessel routes and adapt fertiliser use, or economic predictions. Some of this is linked to recent developments in artificial intelligence (see Box 7.3), which are lowering the barriers and costs of analysing huge amounts of data.
It is also important to note the growth in intermediate service providers. These are firms that offer data hosting or processing services to other firms and in that way significantly facilitate the storage, processing and distribution of (earth observation) data.
Until recently, the analysis of satellite imagery was a costly, time-consuming and mainly manual exercise, but several technological advances, artificial intelligence (AI) technologies in particular, not only ensure that a lot of this work can be automated, but also open up new opportunities of trend prediction and forecasting. Machine-learning algorithms are quickly becoming more performant, sometimes surpassing human skills. Figure 7.6 shows the progress of AI systems in solving the object detection task in the Large Scale Visual Recognition Challenge (LSVRC) Competition that evaluates algorithms for object localisation/detection and image/scene classification from large scale images and videos. The best AI systems are more accurate than (average) human performance.
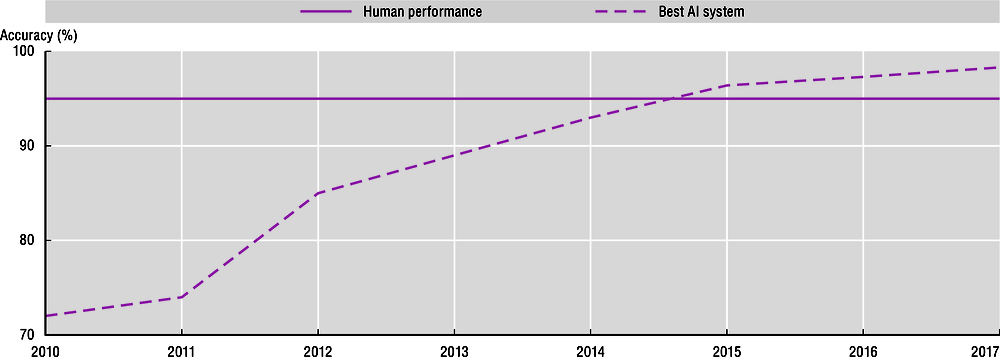
Notes: The LSVRC competition was organised by the Stanford University Vision Lab between 2010 and 2017.
Source: Shoham et al. (2017[47]), Artificial Intelligence Index: 2017 Annual Report, http://cdn.aiindex.org/2017-report.pdf.
AI algorithms and software currently contribute to geospatial analysis in multiple ways. Algorithms can be trained to identify, detect and/or count specific objects such as moving cars or marine vessels, and contribute to the monitoring of illegal fishing or estimating retail activity. They can also be helpful in land cover management and agriculture, by using multispectral satellite imagery to monitor the health and yield of agricultural crops, levels of deforestation (counting trees), identify land use (heat detection from commodity production facilities, and track changes in urban infrastructure) (Yates, 2017[48]).
In addition to automating formerly human tasks, algorithms exposed to millions of images can potentially identify patterns and correlations unidentifiable to the human brain and contribute to forecasting and planning. This typically involves linking satellite data with other types of data (socio-economic, social networks, media). A combination of satellite data, social networks, professional networks, online retailers, blogs, e-commerce, meteorological data, and data from air, marine and road traffic can be used to predict, for instance, energy or manufacturing trends (Huynh, 2017[49]).
Data storage and processing powered by cloud computing are some of the key technologies that are transforming the earth observation sector and enabling new activities. Several big cloud computing firms are playing a significant role in this. One example is Amazon Web Services (AWS) (see also Box 7.2). Data from the US earth observation satellite Landsat 8 have been available for free on AWS since 2015. Within the first 150 days of operations, the AWS Landsat 8 site hosted some 200 000 scenes and had more than 560 million hits from 167 countries. After a year, the number of hits had doubled to more than 1 billion (Sundwall, 2016[50]). Currently, the Earth on AWS platform hosts multiple earth observation datasets in addition to Landsat 8, e.g. Sentinel-2 (Europe), CBERS (China/Brazil), MODIS and GOES (United States), in addition to a dedicated labelled dataset for training machine learning algorithms (SpaceNet) (AWS, 2018[51]).
Cloud computing firms also support commercial earth observation activities. Table 7.7 shows a selection of earth observation data platforms for development of applications, including start-ups, space sector incumbents and non-space newcomers (EARSC, 2017[46]).
As satellite data become more plentiful and easier to process and use, they contribute to innovative applications in an increasing number of fields. Box 7.5 provides examples of interesting applications in the development of socio-economic indicators, where satellite data in certain cases can be used as proxies for economic variables in areas with limited data coverage.
Satellite data are increasingly used in the field of economics, where different types of earth observation data, combined with other socio-economic data, are used to develop indicators. The information derived from satellite data can be used as proxies for economic variables that are impossible to get from areas with limited or no data availability (e.g. no census, border areas, conflict zones, very small geographical units, etc).
Positive correlations have been found for instance between night lights data, mainly provided by meteorological polar-orbiting satellites, and various socio-economic variables, including GDP per capita, manufacturing value-added, electricity consumption, and urban population (Addison and Stewart, 2015[52]). This allows to build up original socio-economic indicators.
An interesting illustration of the use of night lights data is a recent econometric analysis of the impact of trade liberalisation and regional trade integration policies on the development of border regions in East Africa (Brülhart, Cadot and Himbert, 2017[53]). High-resolution night lights data were used as proxies for levels of economic activity and population density. The study analysed the light intensity of 10 x 10 km geo-referenced cells along cross-border highways or major roads up to 200 km away from the border as well as a 5 km ‘buffer’ area on each side of the road (consistent with sub-Saharan habitation patterns), and regressed it on the distance to the nearest border and the interaction of distance with trade intensity. It found that night light intensity consistently decreased when approaching international inland borders, a pattern that was repeated in other inland border regions in the world. This contributed to identifying a socio-economic “border shadow effect”, by which border regions are, on average, less developed than other regions. However, the study’s econometric simulations showed that trade liberalisation (e.g. lower tariffs) could mitigate this border shadow effect and contribute to a spatially balanced development in the region.
Research on trade and spatial concentration in developing countries has traditionally relied on case studies with limited external applicability or cross-sectional approaches using aggregate proxies (e.g. trade-openness indices and spatial concentration indices). This approach, using satellite night lights, made it possible to conduct an analysis with more granular and robust data.
Sources: Addison and Stewart (2015[52]), “Nighttime lights revisited: The use of nighttime lights data as a proxy for economic variables”, World Bank Policy Research Working Paper, No. 7496, https://openknowledge.worldbank.org/handle/10986/23460 and Brülhart, Cadot and Himbert (2017[53]), “Trade integration and spatially balanced development implications for Uganda and Rwanda”, IGC Working Paper, No. F-43406-CCP-1, https://www.theigc.org/wp-content/uploads/2017/08/Brulhart-et-al-2017-Working-paper.pdf.
As a final note and as seen in Chapter 1, there is also considerable growth and company creation in sectors dependent on GNSS technology. This includes services provided to other businesses (e.g. freight management, surveying) and the wider public (e.g. Uber and similar applications). Some 5 billion smartphones currently have GNSS chips (European GNSS Agency, 2017[54]), which represents a large potential market for location-based services and applications.
References
[52] Addison, D. and B. Stewart (2015), “Nighttime lights revisited: The use of nighttime lights data as a proxy for economic variables”, Policy Research Working Paper, No. 7496, World Bank, Washington, DC, https://openknowledge.worldbank.org/handle/10986/23460.
[13] Ansari, S. et al. (2018), “Unlocking the potential of NEXRAD data through NOAA’s big data partnership”, Bulletin of the American Meteorological Society, Vol. 99/1, pp. 189-204, https://doi.org/10.1175/BAMS-D-16-0021.1.
[14] Australian National Computational Infrastructure (2018), Australian geoscience data cube, webpage, http://nci.org.au/services/virtual-laboratories/australian-geoscience-data-cube/ (accessed on 19 June 2018).
[51] AWS (2018), Earth on AWS, webpage, https://aws.amazon.com/earth/?nc1=h_ls (accessed on 21 June 2018).
[53] Brülhart, M., O. Cadot and A. Himbert (2017), “Trade integration and spatially balanced development implications for Uganda and Rwanda”, No. F-43406-CCP-1, International Growth Centre (IGC), London School of Economics and Political Science, London, https://www.theigc.org/wp-content/uploads/2017/08/Brulhart-et-al-2017-Working-paper.pdf.
[23] Canadian Space Agency (2017), “Space weather over Canada”, Sciences website, http://www.asc-csa.gc.ca/eng/sciences/space-weather.asp (accessed on 23 November 2018).
[17] Centre for Space Science Technology (2017), About Us, webpage, http://www.csst.co.nz/satellite-data-brokerage/ (accessed on 10 October 2017).
[1] CEOS (2018), “CEOS Database: Catalogue of satellite missions”, in CEOS Earth Observation Handbook, Committee on Earth Observation Satellites, Paris, http://database.eohandbook.com/database/missiontable.aspx (accessed on 1 June 2018).
[9] CEOS (2018), CEOS virtualization environment (COVE) portal, webpage, http://www.ceos-cove.org/en/ (accessed on 19 June 2018).
[55] Civil Aviation Bureau of Japan (2016), “Current MSAS Status and Future Plan”, presentation at EGNOS Service Provision Workshop, 27-28 September, Tokyo, https://egnos-user-support.essp-sas.eu/new_egnos_ops/sites/default/files/workshop2016/09.%20JCAB%20-%20Current%20MSAS%20Status%20and%20Future%20Plans.pdf (accessed on 14 June 2018).
[34] Condor, T. (2018), “Growing the weather enterprise 10x in 10 years”, presentation at the OECD Space Forum Workshop: The Transformation of the Space Industry: Linking Innovation and Procurement, 27 April, Paris.
[11] Davies, D. (2015), “Distribution and Tracking of NASA EOSDIS Data”, presentation at the OECD Space Forum Workshop: Mapping Value Chains in Satellite Earth Observation, 22 May, Paris.
[46] EARSC (2017), A Survey into the Health of the European EO Services Industry, European Assocation of Remote Sensing Companies, Brussels, http://earsc.org/news/results-eo-industry-survey-september-2017 (accessed on 14 June 2018).
[19] English, S. et al. (2013), “Impact of satellite data”, ECMWF Technical Memoranda, No. 711, European Centre for Medium-Range Weather Forecasts, Reading, https://www.ecmwf.int/sites/default/files/elibrary/2013/9301-impact-satellite-data.pdf (accessed on 4 June 2018).
[10] ESA (2018), About GEOSS, webpage, http://www.geoportal.org/community/guest/about (accessed on 21 June 2018).
[8] ESA (2018), “How to access ESA Data”, Earth Online website, https://earth.esa.int/web/guest/data-access/how-to-access-esa-data#2.5 (accessed on 21 June 2018).
[18] ESA (2017), Accessing Copernicus data made easier, webpage, https://m.esa.int/Our_Activities/Observing_the_Earth/Copernicus/Accessing_Copernicus_data_made_easier (accessed on 14 June 2018).
[3] ESA (2017), “Geographical Coverage - Sentinel-1”, Sentinel Online website, https://sentinel.esa.int/web/sentinel/missions/sentinel-1/satellite-description/geographical-coverage (accessed on 11 June 2018).
[56] ESA (2005), “L1, the first Lagrangian Point”, Space science website, https://m.esa.int/Our_Activities/Space_Science/L1_the_first_Lagrangian_Point (accessed on 4 June 2018).
[25] EUMETSAT (2014), The case for EPS/Metop Second Generation: Cost Benefit Analysis - Full Report, European Organisation for the Exploitation of Meteorological Satellites, Darmstadt, https://www.wmo.int/pages/prog/sat/meetings/documents/PSTG-3_Doc_11-04_MetOP-SG.pdf (accessed on 5 June 2018).
[41] European GNSS Agency (2018), EGNOS System website, https://www.gsa.europa.eu/european-gnss/egnos/egnos-system (accessed on 14 June 2018).
[36] European GNSS Agency (2018), What is GNSS?, webpage, https://www.gsa.europa.eu/european-gnss/what-gnss (accessed on 14 June 2018).
[54] European GNSS Agency (2017), GNSS Market Report: Issue 5, Publications Office of the European Union, Prague, https://doi.org/10.2878/0426.
[42] European GNSS Agency (2016), What is SBAS?, webpage, https://www.gsa.europa.eu/european-gnss/what-gnss/what-sbas (accessed on 14 June 2018).
[44] FAA (2018), “Wide Area Augmentation System (WAAS)”, Navigation programs website, https://www.faa.gov/about/office_org/headquarters_offices/ato/service_units/techops/navservices/gnss/waas/ (accessed on 14 June 2018).
[40] Government of Korea (2018), 제3차우주개발 진흥 기본계획, [Third Space Development Plan], Seoul.
[24] Gray, M. (2015), Public Weather Service Value for Money Review: Executive Summary, UK Met Office, London, https://www.metoffice.gov.uk/binaries/content/assets/mohippo/pdf/c/a/pws_value_for_money_review_-_march_20151.pdf (accessed on 5 June 2018).
[49] Huynh, T. (2017), “Big data analytics for strategic intelligence”, presentation at the OECD symposium on AI: Intelligent Machines, Smart Policies, 26 October, Paris.
[39] Japanese Cabinet Office (2018), “Service overview”, QZSS website, http://qzss.go.jp/en/ (accessed on 14 June 2018).
[29] Joint CEOS/CGMS Working Group on Climate (2018), About WGClimate / WGClimate, webpage, https://climatemonitoring.info/about (accessed on 5 June 2018).
[31] Joint CEOS/CGMS Working Group on Climate (2018), ECV Inventory Access, http://climatemonitoring.info/ecvinventory?sorts[Domain]=1 (accessed on 5 June 2018).
[28] Joint CEOS/CGMS Working Group on Climate (2017), Space Agency Response to GCOS Implementation Plan, http://ane4bf-datap1.s3-eu-west-1.amazonaws.com/wmocms/s3fs-public/ckeditor/files/Space_Agency_Response_to_GCOS_IP_v2.0.pdf?b8UkzOYWG2DOAB.Q88YMmsCPEiPvknMf (accessed on 5 June 2018).
[57] Kaggle (2017), Planet: Understanding the Amazon from space, webpage, https://www.kaggle.com/c/planet-understanding-the-amazon-from-space (accessed on 19 September 2017).
[58] Komissarov, V. (2017), “AI applications for satellite imagery and satellite data”, Tech Emergence, 10 September, https://www.techemergence.com/ai-applications-for-satellite-imagery-and-data/ (accessed on 19 September 2017).
[43] Korean Ministry of Land, Infrastructure and Transport (2018), Korea Augmentation Satellite System website, http://kass-eng.re.kr/ (accessed on 14 June 2018).
[45] LINZ (2017), Australasian SBAS Trial, webpage, https://www.linz.govt.nz/data/geodetic-services/australasian-sbas-trial (accessed on 22 March 2018).
[5] Murphy, K. (2017), “Preparing for a big data future: NASA Earth science data”, presentation at AWS re:INVENT 2017, 28 November, Las Vegas, https://fr.slideshare.net/AmazonWebServices/stg205earthonaws-how-nasa-is-using-aws (accessed on 21 June 2018).
[7] NASA (2018), “NASA Earth science data: Yours to use, fully and without restrictions”, NASA EarthData website, https://earthdata.nasa.gov/nasa-data-policy (accessed on 21 June 2018).
[22] NASA (2014), “Carrington-class CME narrowly misses Earth”, Science website, 2 May, https://science.nasa.gov/science-news/science-at-nasa/2014/02may_superstorm/ (accessed on 23 November 2018).
[59] Netherlands Space Office (2018), “OMI”, Activities website, https://www.spaceoffice.nl/en/activities/national-programme/national-projects/omi/ (accessed on 25 June 2018).
[16] Netherlands Space Office (2018), “Satellite data portal”, Activities website, https://www.spaceoffice.nl/en/activities/satellite-applications/satellite-data-portal/ (accessed on 3 May 2018).
[60] Netherlands Space Office (2018), “Tropomi”, Activities website, https://www.spaceoffice.nl/en/activities/national-programme/national-projects/tropomi/ (accessed on 25 June 2018).
[61] NOAA (2018), Space weather impacts, webpage, https://www.swpc.noaa.gov/impacts (accessed on 4 June 2018).
[15] Norwegian Space Centre (2018), satellittdata.no website, https://satellittdata.no/node/29 (accessed on 19 June 2018).
[27] OECD (2017), Investing in Climate, Investing in Growth, OECD Publishing, Paris, https://doi.org/10.1787/9789264273528-en.
[4] OECD (2016), Space and Innovation, OECD Publishing, Paris, https://doi.org/10.1787/9789264264014-en.
[20] OECD (2014), The Space Economy at a Glance 2014, OECD Publishing, Paris, https://doi.org/10.1787/9789264217294-en.
[6] Schreier, G. (2015), “Tracking institutional data streams: Perspectives of the DLR Earth observation center”, presentation at the OECD Space Forum Workshop: Mapping Value Chains in Satellite Earth Observation, 22 May, Paris.
[47] Shoham, Y. et al. (2017), Artificial Intelligence Index: 2017 Annual Report, webpage, http://cdn.aiindex.org/2017-report.pdf (accessed on 23 November 2018).
[35] St. Jean, D. (2018), “Commercial service providers and data openness”, presentation at the OECD Space Forum Workshop: The Transformation of the Space Industry: Linking Innovation and Procurement, 27 April, Paris.
[50] Sundwall, J. (2016), “#EarthOnAWS: How the cloud is transforming Earth observation”, presentation at the AWS Public Sector Summit 2016, 20-21 June, Washington, DC, https://fr.slideshare.net/AmazonWebServices/earthonaws-how-the-cloud-is-transforming-earth-observation-aws-public-sector-summit-2016 (accessed on 21 June 2018).
[37] US Air Force (2018), GPS Space Segment, Global Positioning System (GPS) website, https://www.gps.gov/systems/gps/space/ (accessed on 14 June 2018).
[38] US Air Force (2017), Global Navigation Satellite Systems (GNSS) website, https://www.gps.gov/systems/gnss/ (accessed on 14 June 2018).
[2] WMO (2019), Satellite status, http://www.wmo.int/pages/prog/sat/satellitestatus.php (accessed on 4 June 2018).
[30] WMO (2018), Essential climate variables, https://public.wmo.int/en/programmes/global-climate-observing-system/essential-climate-variables (accessed on 4 June 2018).
[21] WMO (2017), Space Weather impacts, webpage, http://www.wmo.int/pages/prog/sat/spaceweather-intro_en.php (accessed on 4 June 2018).
[32] WMO (2016), The global observing system for climate: Implementation needs, World Meteorological Organization, Geneva, https://library.wmo.int/doc_num.php?explnum_id=3417 (accessed on 31 July 2018).
[33] WMO (2015), Status of the Global Observing System for Climate, World Meteorological Organization, Vienna, https://library.wmo.int/pmb_ged/gcos_195_en.pdf (accessed on 31 July 2018).
[12] Wooldridge, C. (2016), “The revolution in Earth observation: Harnessing the data to support the economy”, presentation at the OECD Space Forum Symposium: Innovation and the Space Sector, 27 October, Paris.
[48] Yates, B. (2017), “Geospatial analytics for an interconnected world”, presentation at the OECD Symposium on AI: Intelligent Machines, Smart Policies, 26 October, Paris.
[26] Yuan, H., M. Sun and Y. Wang (2016), “Assessment of the benefits of the Chinese public weather service”, Meteorological Applications, Vol. 23/1, pp. 132-139, https://doi.org/10.1002/met.1539.