
1. Developments in Agricultural Policy and Support
This chapter first provides an overview on recent economic and market developments that provide the context for the implementation of agricultural policies. The second section presents main changes and initiatives in agricultural policies in 2020-21, focusing on policy responses to the COVID-19 pandemic that target, or strongly affect, agricultural producers, food consumers and other actors along the food supply chain. The subsequent analysis of levels and structures of agricultural support informs an assessment of the extent to which current support contributes to the food systems’ “triple challenge” of achieving food security and nutrition, providing livelihoods to those connected to the sector, and reducing the environmental footprint and greenhouse gas emissions of the sector. The chapter also explores how current policies perform across productivity, sustainability and resilience, key channels for contributing to addressing these challenges. It concludes with an assessment of policy developments, and with recommendations for concrete actions.
In 2020, agricultural policies and support to the sector were significantly affected by the outbreak of the coronavirus SARS-CoV-2, the subsequent spread of the COVID-19 virus, and substantial restrictions to populations and enterprises aimed at containing the virus. These factors caused economic growth to slow significantly or even turn strongly negative in all economies, while in many countries unemployment rose as companies were forced to lay off employees. Commodity markets were affected as well, but the implications for global agricultural markets remained comparatively limited as, despite some significant stresses, food systems and supply chains proved relatively robust.
The pandemic caused major dislocations to food markets, in particular with the closure of restaurants, and the shift in consumption away from food outside the home. But the overall demand for food was fairly stable, as food supply was generally recognised to be essential and thus exempt from lockdowns, while consumers prioritised food among their expenditures. However, several advanced economies saw increased recourse to food banks among low income consumers who had seen a drastic fall in their incomes. Labour intensive sectors, such as meat processing and sectors requiring seasonal labour for planting or harvesting, were also deeply affected by the virus and measures to contain it.
As a land based activity, the production of most commodities was generally able to withstand the pandemic, although those products requiring more labour input – principally fruits and vegetables – or where supply is destined primarily for the restaurant trade, were more affected. In general, developments on agricultural markets were driven as much by non-COVID factors as by the impacts of the pandemic. Overall, the agricultural sector proved remarkably resilient, with farm incomes increasing in 2020 for a majority of countries covered in this report.
To help people and companies to cope with the economic consequences of both the virus and containment strategies, governments introduced a wide set of policies as of early 2020. In looking at changes made to agricultural policies and support, this report therefore begins by discussing policy responses to the COVID-19 pandemic that focus on, or strongly affect, agricultural producers, other actors along the food supply chain, and food consumers.
The report then analyses the level and structure of agricultural support, in particular in terms of the extent to which they help or hinders the performance of food systems, gauged in terms of their contribution to the “triple challenge” of:
1. Achieving food security and nutrition for a growing world population.
2. Providing livelihoods to farmers and others connected to the sector, either vertically along the value chain or spatially across rural economies.
3. Reducing the environmental footprint of the sector and contributing to lower greenhouse gas (GHG) emissions.
Drawing on insights from the OECD Framework for Productivity, Sustainability and Resilience, this part of the report also explores how current policies perform across the three dimensions of productivity, sustainability and resilience, which are identified as key channels through which agriculture can contribute to the challenges facing food systems. Lastly, this part of the report concludes with an assessment of the developments in policies and support, and with recommendations for concrete actions to improve the performance of agricultural policies in meeting the challenges facing global food systems.
Conditions in agricultural markets are strongly influenced by macro-economic factors, such as economic growth (measured by gross domestic product, GDP), which generates the income supporting demand for agricultural and food products, as well as prices for crude oil and other energy sources which affect the prices of numerous production inputs in agriculture, such as fuel, chemicals and fertiliser. Energy prices also affect the demand for cereals, sugar crops and oilseeds through the market for biofuels produced from these feedstocks.
Global economic growth, which slowed to below 3% in 2019, came to an abrupt halt in the wake of the COVID-19 pandemic. Global output in 2020 is estimated to have been more than 4% below that in 2019, reflecting policy responses to the pandemic, which included substantial restrictions in both personal and economic activities (OECD, 2020[1]).1 GDP growth in all OECD economies turned negative. The contraction was particularly significant in the Euro area, where economic output declined by 7.5% in 2020, after low growth of 1.3% the year before. Japan was significantly hit as well, with GDP shrinking by 5.3% in 2020, after some first signs of rebounding growth in 2019 at +0.7%. The contraction was less pronounced in the United States, where economic output, which grew by more than 2% in 2019, declined by 3.7% in 2020.
The downturn in OECD economies was associated with a decreased demand for labour. Across the OECD area, unemployment, which had fallen slightly to 5.4% in 2019, increased to 7.2% in 2020. In many countries, the negative impact on employment was mitigated by substantial public interventions, including notably the widespread application of publicly supported short-time work.2 Average inflation declined further to 1.5%, driven in particular by falling energy prices (see below).
Growth in emerging economies also fell substantially, although the extent of the downturn varied strongly. Argentina’s GDP, which had seen negative growth for the last two years already, shrank by 12.9%, the first double-digit economic contraction since the currency and debt crisis of 2001-02. India’s GDP contracted by 9.9%, more than 14 percentage points below 2019 growth, while South Africa’s GDP fell by 8.1%, following stagnation in 2019. On the other hand, the People’s Republic of China (hereafter, “China”) is the only country covered in this report that maintained positive growth in 2020, at 1.8% compared with 6.1% the year before. The Indonesian economy also fared comparatively well, with a slight contraction of 2.4%, following 5% growth in 2019.
The consequences of the COVID-19 pandemic and of related restrictions are strongly visible in international trade. In real terms, global trade declined by more than 10% year-on-year, following already slow growth in 2019.
Lower economic growth and restrictions on personal and economic mobility put significant pressure on prices for energy and other non-food commodities (IMF, 2021[2]). On average, energy prices in 2020 were 30% lower than in 2019, and more than 40% below their 2018 levels. Crude oil prices, which had fallen to levels close to (and on certain markets even below) zero in April 2020, averaged 33% lower over the full year compared to 2019. Lower energy prices also pulled down fertiliser prices, which on average were 9% lower year-on-year.
In comparison, food prices remained robust. After dropping by 7% in the second quarter of 2020, average international food prices increased towards the end of the year, and annual averages ended 3% higher than in 2019, with contrasting movements between crop and livestock markets, as explained below.
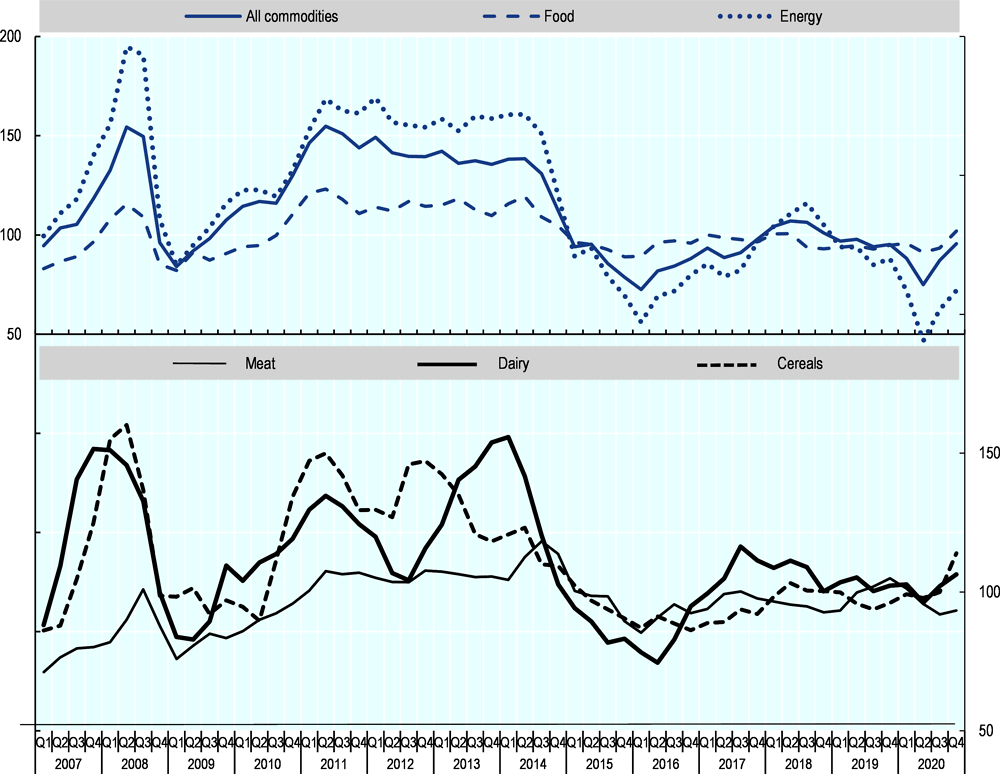
Note: The top part of the graph relates to the left scale, while the bottom part of the graph to the right scale.
Source: IMF (2021), Commodity Market Review, for all commodities, food and energy indices (base year: 2016), www.imf.org/external/np/res/commod/index.aspx; FAO (2021), FAO Food Price Index dataset, for meat, dairy and cereal indices (base period: 2014-16), www.fao.org/worldfoodsituation/foodpricesindex/en.
Global food markets saw prices for crops and livestock products moving in opposite directions. World meat markets had seen production decline in 2019 primarily due to the impact of African Swine Fever (ASF) on China’s pig meat sector. While the disease continued to limit production in China and other countries such as Viet Nam during 2020, herds began to rebuild. In spite of the lower Chinese output, however, global meat prices were under significant downward pressure in 2020 due to logistical difficulties and reduced demand following the COVID-19 pandemic, which together dampened meat import demand from several key importing countries. On average, meat prices in 2020 fell by 4.5% year-on-year.
The pandemic also had significant, though varied, impacts on dairy markets. While away-from-home consumption in many countries suffered as a result of widespread confinement measures, larger retail sales for at-home consumption partly offset these losses. Fresh dairy products were particularly vulnerable to disruptions in supply chains, but many countries were able to adjust their production chains relatively quickly. As a consequence, while the effects of the pandemic varied across regions, global dairy prices changed only little year-on-year, with lower prices in the second quarter balanced by rising prices towards the end of the year.
In contrast to livestock markets, world prices for crop commodities mostly rose in 2020. Following short-term disruptions due to the COVID-19 pandemic, oilseeds markets were driven by strong demand notably for imported soybeans into China as the country began to rebuild pig herds. At the same time, lower supply growth of palm oil resulted in relatively short supplies on international markets. As a consequence, international prices rose significantly in 2020, with prices for soybeans and vegetable oils averaging 7% and almost 20% higher than in 2019.
Increased feed demand from the rebuilding pork sector in China, logistical difficulties in some major producing countries, and some temporary export restrictions following the COVID-19 pandemic, drove prices upwards in cereal markets. Pushed by increases notably towards the end of the year, average cereal prices were almost 7% higher in 2020 than in the preceding year.
Continued shortfalls in sugar production due to unfavourable weather conditions in some of the major producing countries offset lower import demand for sugar and notably reduced biofuel demand in light of reduced mobility due to the pandemic, resulting in average sugar prices increasing slightly year-on-year, but remaining well below levels seen in 2016.
Overall, food supply chains were recognised as essential services in most countries implementing COVID-19 related restrictions on economic activities, as a result of which the sector was affected by those restrictions more indirectly than directly. Often, both domestic and international trade in food products were facilitated through green corridors and other measures notwithstanding disruptions affecting trade overall. Labour shortages due to restrictions on people’s movement were alleviated through exceptions for agricultural and food chain workers, and through schemes encouraging workers laid off in other sectors or students to temporarily work in agriculture and the food industry. However, income losses and economic uncertainties, together with restrictions for restaurants and other away-from-home food suppliers, generated changes in food demand which the industry needed to cope with. But the impact of economic contractions on food expenditure was mitigated through public support partly compensating for income losses, and reductions in disposable incomes seem to have led to higher shares of income being spent on food. Partly with the help of government policy responses, food systems have therefore proven remarkably resilient. Indeed, after short-term disruptions in international food markets in the early phase of the pandemic, these markets appear to have been impacted more by other factors such as livestock diseases and climatic conditions than by the pandemic itself.
As governments started implementing containment measures to slow the spread of the COVID-19 virus early in 2020, they also began introducing measures to limit impacts of the virus and associated containment measures on the agriculture and agro-food supply chains.3 Most government responses in the sector were introduced in the first few months of the pandemic, largely in response to the shock to specific subsectors. Still, as the year went by, as new waves and strands of infection developed, governments in many countries shifted their attention towards medium-term issues by bolstering early relief measures and introducing economic recovery packages.
This section presents an overview of government measures introduced in 2020 in the 54 countries covered in this report, using different categorisations, focusing mainly on the number and type of measures, and associated budget figures. The dataset used for analysis was compiled based on the information on domestic and international trade related COVID-19 policy developments provided in country chapters in this report.4 While the reported set of measures is comprehensive, and covers all the most important policy responses, it does not claim to capture all measures in place in all countries covered in the study.
Countries implemented a diverse set of responses to COVID-19
Governments of the covered countries and the European Union introduced 776 unique policy measures to respond to the COVID-19 related crisis during 2020, of which 496 were introduced in the first four months of 2020 (OECD, 2020[3]; Gruère and Brooks, 2021[4]). The overall number of unique measures for the year 2020 increases to 1 086 applied policy measures if EU-wide measures, applicable to all member states, are added to unique measures for each of the EU Member States (including for the period covered, the United Kingdom).
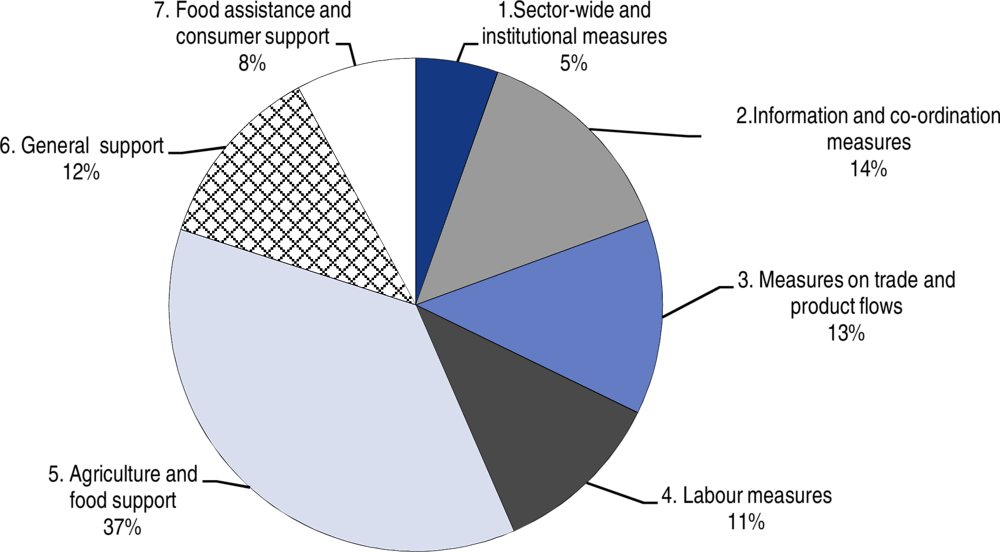
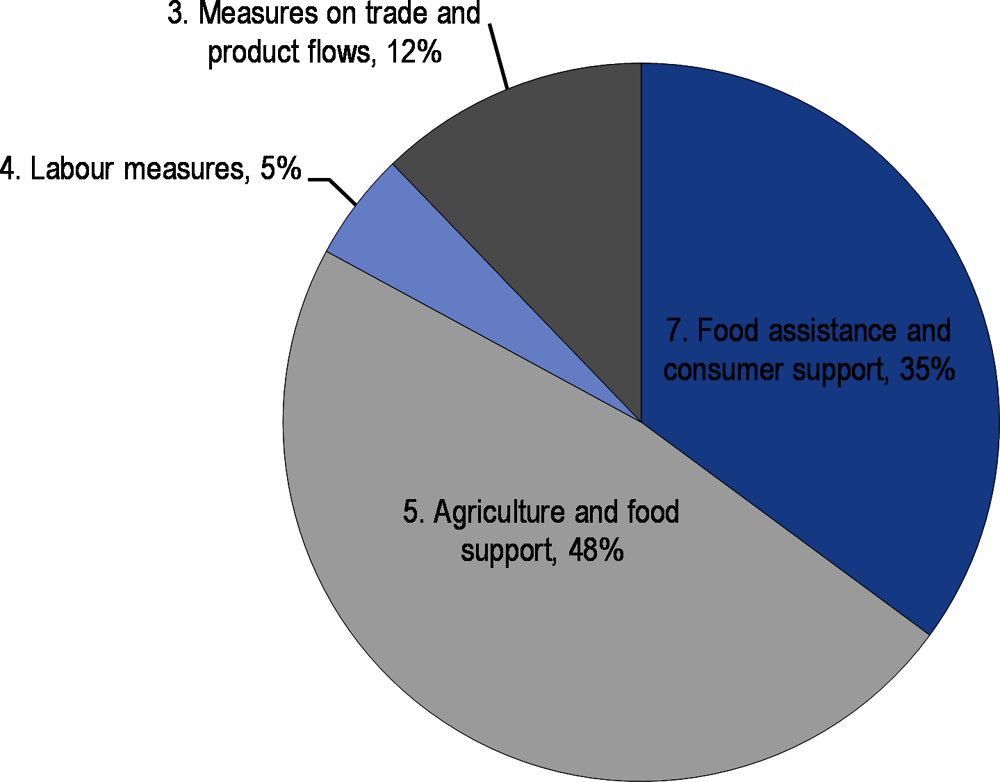
The nature of the government responses varied widely. OECD (2020[3]) distinguished seven categories of measures: 1) Sector-wide and institutional measures; 2) Information and co-ordination measures; 3) Measures on trade and product flows (enhancing trade or restricting trade); 4) Labour measures (biosecurity and workforce related measures); 5) Agriculture and food support (or support for agriculture and food companies); 6) General support (including packages that apply to the sector); and 7) Food assistance and consumer support (demand side interventions).5 Unique government measures were distributed across those categories, with 37% of the 776 measures focusing on agriculture and food support, 5% on institutional measures, and 8% on food assistance measures, with the remaining four categories covering between 11% and 14% of measures (Figure 1.2).
These proportions changed since the four first months of 2020, from a focus on information and co-ordination to agriculture and food support measures. The share of agriculture and food support measures increased by 14 percentage points over the year, while the share of measures on information and co-ordination and general support declined by 7 and 4 percentage points, respectively. This evolution might reflect the need for information and communication in the early period, followed by the increased importance that some governments attached to providing support to agriculture and food companies to cushion the impact of the first wave of the virus. Shares for other categories of measures remained stable, indicating a moderate increase in the use of these measures across countries.
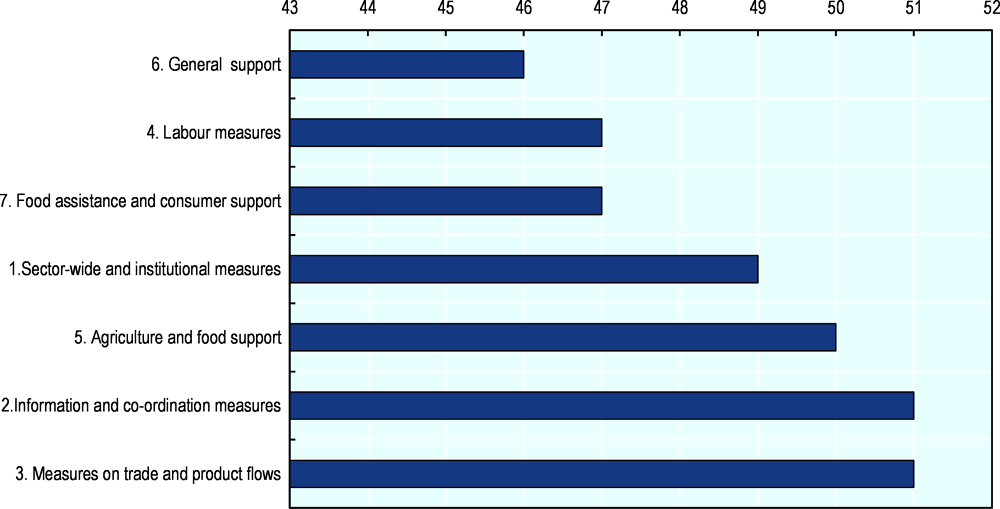
A wide range of measures adopted is also observed among the 54 covered countries, underscoring the comprehensiveness of government responses. Thirty-eight of the covered countries applied measures in all seven categories, while ten countries applied measures in six of the seven categories. Fifty or more countries applied trade and product flow measures, information measures or agriculture and food support measures, while the other categories of measures were each applied by at least 46 countries (Figure 1.3).
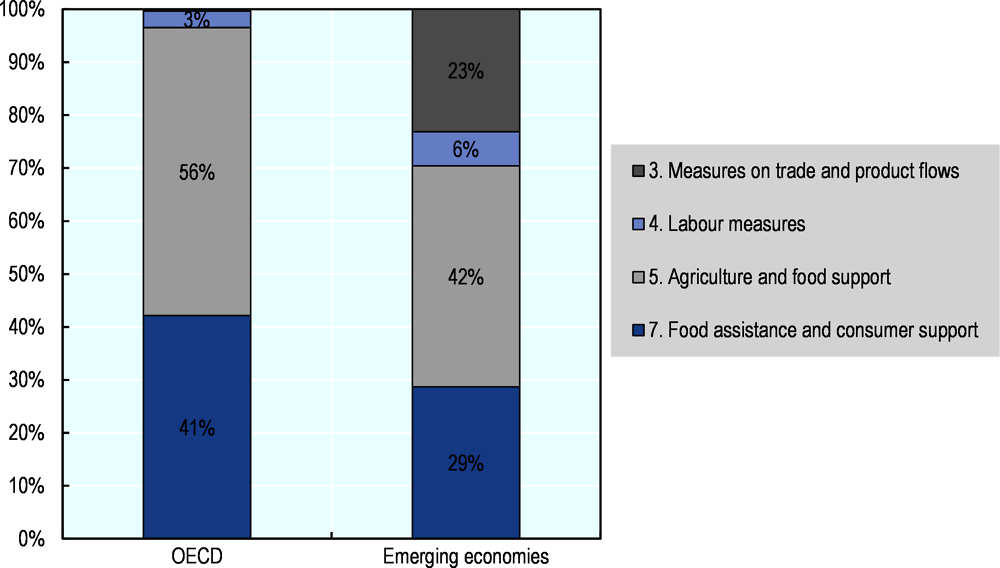
At the same time, differences in the number of measures by category can be seen among regions and countries. In particular, 54% of measures undertaken by governments in OECD countries focused on the three categories of support (agriculture and food support, general support and food assistance and consumer support measures), including the largest proportion on agriculture and food support (35%), while 58% of measures undertaken by emerging economies were in the non-support categories of measures (sector wide and institutional, information and co-ordination, trade and product flows and labour measures), including the largest proportion of measures (26%) in the trade and product flow category. This difference may reflect the existing policies covering the sector in the respective groups of countries, but may also be due to differences in structures of the sector as well as the type of shocks associated with the COVID-19 pandemic and associated containment measures. A further factor may be differences in budgetary and fiscal scope to provide additional support. Among OECD countries, Asian and European countries favoured agriculture and food support measures, South American countries focused on information and co-ordination measures, Oceanian countries prioritised labour measures, and North American countries displayed no clear dominance across categories of measures.
Only 11% of the unique measures recorded explicitly built on existing policy measures already in place, almost all in the agriculture and food support category in the form of flexibility or changes in existing policy programmes. This suggests that governments often introduced new programmes, funding or approaches to respond to the crisis, or that they relied on existing policies without making notable changes. Innovative approaches were used for instance to re-channel food unused by closed schools towards families, to hire temporarily unemployed workers from cities in fields, or via the use of digital tools to ease market transactions and custom controls.
Measures varied in their purpose, timing, scope and potential impacts
Government responses also differed in their timing and scope, from the initial imposition of lockdown measures, to policies aiming to temper the impacts of the crisis on specific supply chains or consumers or in the medium term. At the same time, several measures taken to facilitate the functioning of production or supply chains could usefully have been taken before of the COVID-19 crisis. To highlight these distinctions and better understand the implication of government responses, measures were organised in three groups:6
Urgent measures to ensure supply: these emergency measures were taken at the onset of the crisis to ensure supply and keep the sector functioning. Examples include biosafety measures; declaring agriculture and food as an essential sector; measures to ensure the functioning of government agencies; co-ordination of responses with the private sector; and national and international logistic and transport measures, including setting up green lanes to ensure the continuation of trade. These measures are intrinsically linked to the pandemic, and would either be lifted or no longer relevant after the COVID-19 crisis. This group includes 150 unique measures (19% of the total).
No regrets measures: these measures improve market functioning and thereby contribute to improved resilience. They could have been taken before, and should be maintained or even scaled up after the COVID-19 crisis. This group includes measures supporting digital innovations that facilitate e-commerce; exchange of information; agriculture job-matching information centres; and training or trade facilitation measures. This group includes 75 unique measures (10% of the total).
Temporary relief measures: these measures seek to contain the impact of the crisis on agriculture and food sector actors, from producers to consumers. Governments considered them necessary but they should include sunset clauses to avoid outliving their original rationale. These measures comprise largely temporary trade and markets measures to relieve domestic economic pressure, agricultural support measures, including those that compensate producers and agro-food chain actors for damages incurred; consumer and food assistance7 measures and measures that lifted or limited regulatory requirements for farmers. This group is the largest, with 537 unique measures (69% of the total).
The remaining 14 measures (2%) could not be attributed to any of the groups.
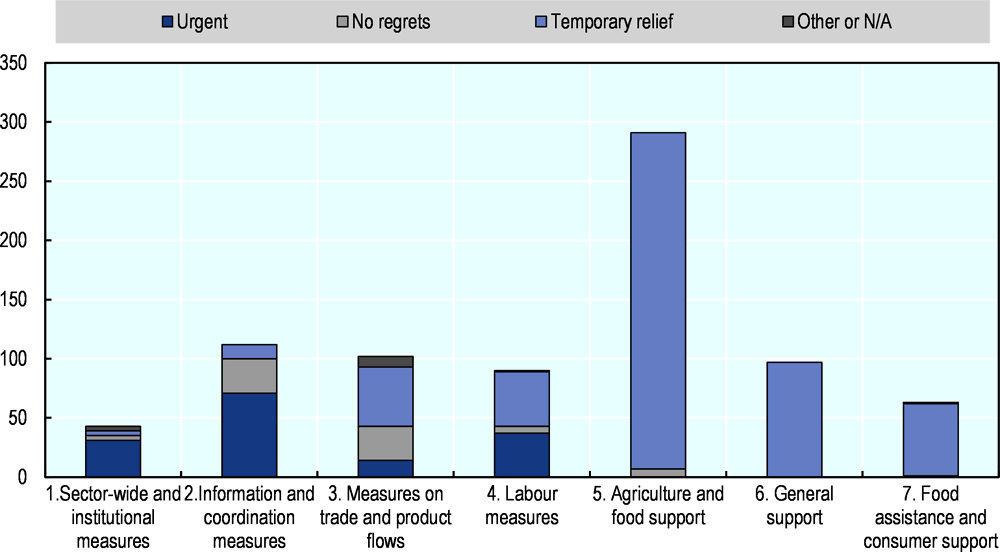
As expected, measures in the three support categories (5, 6 and 7) are overwhelmingly temporary relief measures, but measures in other categories, belong to different groups (Figure 1.4). Urgent measures to ensure supply include institutional and informational measures, but also labour measures and trade and product flow measures (categories 1 to 4). No regrets measures were mostly information and co-ordination measures and product and trade flow measures that enhance the functioning of markets (categories 2 and 3).
Source: Information collected from the 54 countries.
A large majority of countries implemented measures that belong to each of these groups, even if some differences are observed among countries. All but two countries applied one or more urgent measures to ensure supply, and the same number of countries applied temporary relief measures; fewer countries (46) applied at least one no regrets measure. OECD countries applied relatively more temporary relief measures than emerging economies, who applied relatively more of measures in the other two groups.
An additional distinction was made to identify measures that could at least temporarily be potentially market and trade distorting or environmentally harmful.8 These mostly temporary relief measures include trade bans or export restrictions that were temporarily put in place by several countries, but also market price controls, relaxed environmental regulations, and specific agricultural support measures for different agricultural commodities. Eighty-five unique measures (11% of the total) introduced by 47 countries were identified to have potential impact on markets or the environment, belonging to the agriculture and food support category, the trade and product flow, and the food assistance categories.
Governments allocated at least USD 157 billion to respond to impacts in the agriculture and food sector
One of the key ways in which governments have addressed the economic impact of the COVID-19 pandemic and associated lockdowns is by offering liquidity, credits, and funding for relief measures. Governments in many countries have adopted comprehensive economic recovery packages, with measures that included new lines of credits, subsidised loans, flexibilities in taxes, or subsidies and which included firms in the agriculture and food sector. At the same time, governments in many countries created specific financial support measures to the agriculture and food sector.
This section provides a preliminary assessment of budgetary allocation in response to the COVID-19 impact based on collected information. It therefore only focuses on the subset of measures for which financial information was available (in total 119 unique measures in 41 countries).
A review of the reported budgetary figures associated with the collected COVID-19 responses comes with several important caveats. First, it is impossible to track how much of the general recovery packages were used on the agricultural sector, so these are largely excluded from the assessment. Second, while these numbers include some expenditures incurred in 2020, a larger set of programmes that were announced in 2020 has not yet been delivered to the sector. As such, a majority of the numbers presented are not reflected in the 2020 data in this year’s agriculture support estimate database. Third, funding for sector-wide and institutional measures (category 1) and information and co-ordination measures (category 2) was not available. Fourth, some of the measures provide support for targeted or affected individuals on the basis of unit costs, but there is no estimate of the number of individuals or firms that benefitted from the support, so these support measures are excluded from the assessment. Fourth, governments may have used existing policies and measures, potentially with budget adjustments or changes in implementation, without reporting those as related to COVID-19. All these caveats suggest the reported figures are likely to represent minimum estimates of financial support measures in the 54 countries.
In total, governments dedicated USD 157 billion in response to impacts to the sector (Table 1.2). Of this total, USD 116 billion was earmarked in the form of grants, payments or other funding, while USD 41 billion was offered in in the form of subsidised rates loans, new credit lines, and other mechanisms. At the same time, USD 5.6 trillion was provisionally identified in general recovery packages that included the food and agriculture sector (category 6 - general support). This support was not specific to the sector.
Sector specific earmarked funding primarily focused on relief measures for agriculture and food actors, and food assistance measures (83% as shown in Figure 1.5). Twelve per cent of financial support focused on general services, such as infrastructure development, e-commerce development and measures easing trade, which are listed under the category of measures on product and trade flows. The remaining 5% of support was directed towards addressing labour shortfall, via compensation mechanisms for migrant or new farm workers, and implementing bio-sanitary measures, including compensation to the culling of minks potentially infected by the COVID-19 virus as well as equipment support.
Notes: This includes promised funding, credits, loans and other support mechanism. Category 3 measures are those facilitating market functioning, logistics and infrastructure (general services), category 4 measures are labour and biosecurity measures, and category 7 measures are food assistance measures.
Source: Information collected from the 54 countries.
There are significant differences in the reported financial support between OECD countries and emerging economies (Figure 1.6). OECD countries’ financial support amounted to USD 75 billion, almost entirely dedicated to relief measures expressed in terms of agriculture and food support (USD 32 billion) and food assistance (USD 41 billion), with the remaining funding going towards labour and biosafety measures. New and expanding food assistance programmes were observed in OECD countries (Box 1.1). In contrast, emerging economies reported USD 82 billion of financial support, with USD 34 billion going to agriculture and food support and USD 24 billion to food assistance, implying lower shares of overall support in these categories, with a higher share (23%) dedicated to general services enhancing market and trade.
Note: Non OECD EU Member States do not feature in this figure. Category 3 measures are those facilitating market functioning, logistics and infrastructure (general services), category 4 measures are labour and biosecurity measures, and category 7 measures are food assistance measures.
Source: Information collected from the 54 countries.
Many countries deployed public emergency food assistance measures to prevent rising food insecurity resulting from the COVID-19 crisis. These complemented other livelihood support measures that aimed to contain the pandemic’s socio-economic consequences and thus the spread of poverty across OECD countries (OECD, 2020[5]).
Countries have reinforced existing food assistance programmes1 or deployed new schemes to suit the needs of their vulnerable populations. Food assistance programmes have targeted low-income households with a particular focus on infants, children, students, the vulnerable and elderly people. Some eligibility criteria that had constrained access to pre-existing schemes were eased during the pandemic. The programmes fall into two categories:
The provision of vouchers that can be used to buy food without restrictions or to buy certain types of (healthy) food products. Some countries have used digital technologies to issue benefits electronically to some vulnerable population groups and to provide information on food assistance packages for which households might be entitled (Baragwanath, 2021[6]).
The provision of free or subsidised meals either in canteens or in other public places when this is possible, or by home-delivery. Home-delivery of meals required logistical adaptation and often involved partnerships with private caterers.
Governments also provided additional support for food bank operations to respond to growing emergency food aid demand. In pre-COVID-19 times, about 25% of food banks’ food supply depended on public support. The COVID-19 crisis further increased the need for public support (GFN, 2020[7]). To facilitate continued operation of food banks , OECD governments provided three types of support measures:
Operational and financial support: Mostly offered by local authorities, such support provided storage, cooking and distribution facilities, as well as protection materials and staff. Several governments also provided financial support for food purchases and to cover additional operating costs related to sanitary protocols.
Flexibility in existing programme implementation: The rules behind food banks’ public support were relaxed as a result of the COVID-19 pandemic. For instance, the European Union’s Coronavirus Response Investment Initiative Plus (CRII+) made it possible to provide food assistance indirectly via food vouchers for food banks supported by the Fund for European Aid to the Most Deprived (FEAD).
Food donations: Ministries, mostly those in charge of agriculture, were involved in programmes recovering food products that were supposed to be served in schools or in restaurants. For example, the United States Department of Agriculture (USDA) was involved, via the pre-existing Emergency Food Assistance Programme (TEFAP) and the new Farmers to Families Food Box Program, in the purchase of domestically-grown food products to be provided to vulnerable population. Food donations programmes in the United States (USDA, 2021[8]) and also in the European Union (FEBA, 2020[9]) are expected to continue in 2021.
← 1. Information on existing programmes can be found in (Placzek, 2021[10]).
With regard to agriculture and food support measures, OECD countries favoured funding mechanisms, such as direct payments, grants or increased allocation to existing support programmes (83%), while emerging economies supported the sector via preferential loans and credit mechanisms (99%). Large countries on both sides drive this pattern, with the United States accounting for 69% of total agriculture and food support via earmarked funding, and India accounting for 90% of loans and credits to be granted to the sector in response to the COVID-19 crisis.
Sixteen of the 119 measures displaying financial support were identified as potentially market and trade distorting or environmentally harmful. These agriculture and support measures amounted to USD 731 million, which is significant but remains marginal compared to the total earmarked funds dedicated to the agriculture and food support (USD 35 billion) or to the global agriculture support estimates conveyed in this report.
Other key policy trends and developments in 2020
While policies for agriculture and food have been strongly influenced by the COVID-19 pandemic, other changes were also made in 2020. Specific information on the developments is summarised below, with details on adjustments made to policies and programmes within countries available in the country chapters within this report.
Several countries have revised their agricultural policy frameworks. Colombia introduced the “Together for the Countryside” (Juntos por el campo) initiative, including a range of new policy programmes and subsidies for transportation, machinery and equipment, and variable inputs. Indonesia introduced specific programmes to increase production capacity on about 165 000 hectares of swampy land in Central Kalimantan, and to expand rice planting areas with 250 000 hectares of rice, maize, shallots and chilies in deficit areas. Japan revised its “Basic Plan for Food, Agriculture and Rural Areas”, which sets out policy directions, food self-sufficiency goals and commodity production targets for the next ten years. Mexico published the Sectoral Programme for Agriculture and Rural Development 2019-2024, focusing on improving agricultural productivity for food self-sufficiency, reducing poverty rates in rural areas, and increasing small-scale agricultural producers’ incomes. Viet Nam approved a series of strategies, plans and programmes to promote agricultural and rural development, including a new Livestock Development Strategy for 2021-30; a plan to promote investment in the agricultural and rural sector for 2021-25; a Master Programme on Sustainable Agricultural Development and Adaptation to Climate Change in the Mekong River Delta for 2030; a Scheme for Developing Organic Agriculture for 2020-30; and an irrigation strategy for 2030.
The European Union also released a number of major policy initiatives: the European Parliament and the Council agreed on transitional rules for the Common Agricultural Policy (CAP) for 2021-22, while negotiations continue on CAP reform. In May 2020, the European Commission released more details on proposed Green Deal initiatives most relevant to the agricultural sector – specifically, the Farm to Fork and the Biodiversity strategies, which seek to halt biodiversity loss in Europe, transform EU food systems into global standards for competitive sustainability, protect human and planetary health and safeguard the livelihoods of all actors in the food value chain.
New support measures and reforms to existing policies were introduced. Argentina shifted to more active export restrictions, reintroducing taxes that were reduced or eliminated between 2015 and 2018. Brazil created financial mechanisms to attract funds for rural credit, reducing preferential annual interest rates provided by Pronaf, the main credit programme for small farmers. Korea established a new direct payment system, combining the direct payments for rice, upland crops and less favoured areas into a single scheme. The income compensation scheme for rice, which has been the main payment scheme in Korea, was converted into a decoupled payment programme and accompanied by environmental cross compliance regulations. Norway eliminated its last export subsidies on cheese and processed agricultural products as of the end of 2020. The Philippines established a Rice Competitiveness Enhancement Fund to support investments in machinery and equipment, breeding and distribution of high quality rice seeds, credit and expansion. The Russian Federation (hereafter “Russia”) expanded its railroad tariff subsidies to cover the transportation of soybean meal, vegetables and mineral fertilisers. Viet Nam extended a land tax exemption to the end of 2025, allowing farm households and organisations to avoid paying an agricultural land use tax or continue benefiting from a land tax reduction.
A number of countries developed new climate-related policies and strategies. Canada has established a new Natural Climate Solutions for Agriculture Fund, which will support carbon sequestration and beneficial management practices, such as cover crops or shelterbelts, through development, testing, peer-to-peer learning and solution sharing with farmers. Furthermore, under the “A Healthy Environment and A Healthy Economy” plan, the government of Canada plans to invest USD 123 million over seven years to support the agricultural sector in developing transformative clean technologies, reducing emissions from fertilisers to 30% below 2020 levels, boosting climate-smart agriculture, and supporting the production and use of low-carbon fuels. Japan published a national Green Growth Strategy in December 2020, outlining a comprehensive plan to achieve net-zero GHG emissions across the economy by 2050. The Ministry of Agriculture, Forestry and Fisheries has also announced a strategy for sustainable food systems, named “Measures for Achievement of Decarbonisation and Resilience with Innovation”, which aims to achieve zero CO2 emissions from agriculture, reduce the use of chemical pesticides and fertilisers, and make all subsidies carbon neutral by 2040. Korea released the 2050 Carbon Neutral Strategy, a long-term plan for GHG emissions mitigation. The strategy sets out four tasks for the agricultural sector: transition to smart farming; develop and deploy low-carbon agricultural practices; promote participatory policies for farmers and consumers; and scale up the deployment of eco-friendly energy. New Zealand has developed a ten-year roadmap for boosting primary sector export earnings while reducing biogenic methane emissions in accordance with the 2019 Zero Carbon Act. In addition, the “He Waka Eke Noa – Primary Sector Climate Action Partnership” seeks to reduce agricultural GHG emissions and enhance the sector’s resilience to climate change. Ukraine introduced new legislation to outline its strategy on environmental policies, along with a framework to monitor, report and verify the country’s GHG emissions. Chile, Iceland, Israel and Viet Nam also outlined new strategies and objectives in 2020 to reduce their GHG emissions from agriculture.
In addition, several countries took steps to improve the sustainable management of their water resources. This group includes Chile (currently developing a Ministerial water plan), New Zealand (through the 2020 National Environment Standards for Freshwater), and Viet Nam (via the Irrigation Strategy to 2030). This follows a more general trend in OECD countries, where governments changed their agriculture and water policies, in the last decade, broadly in line with the OECD Council Recommendation on Water (Gruère, Shigemitsu and Crawford, 2020[11]; OECD, 2021[12]).9
Several countries strengthened their promotion of organic farming. Notably, the European Union’s Farm to Fork Strategy includes several agriculture-specific targets, one of which is to increase the share of farmland under organic farming to at least 25%. Furthermore, increasing the area of organic farming is also a key policy objective of Japan’s Ministry of Agriculture, Forestry and Fisheries. Russia introduced a new law providing requirements for the production and labelling of organic products. The creation of a system of certification for organic products is ongoing, with 64 producers currently certified. Viet Nam approved a Scheme for Developing Organic Agriculture in 2020-30, setting out specific goals to increase the share of organic production in agricultural land use and for improving the value per hectare of organic production by 2030.
Some countries developed new solutions to tackle food loss and waste. Canada is investing USD 15 million to establish the Food Waste Reduction Challenge, encouraging innovative business models to develop solutions to prevent or divert food waste along the food supply chain. Turkey published a national strategy document and action plan on Prevention, Reduction and Monitoring of Food Loss and Waste, setting four strategic goals and 13 targets.
Risk management and disaster assistance policies were strengthened. Australia introduced drought resilience response programmes through the Future Drought Fund, and provided support to farm clean up and emergency response activities through the National Bushfire Recovery Fund. China’s Ministry of Agriculture and Rural Development and the Ministry of Finance jointly allocated USD 47 million to a new disaster relief fund assisting agricultural producers in flood-hit southern provinces. Kazakhstan’s mandatory crop insurance system was transformed into a voluntary insurance scheme with a view towards expanding crop and livestock insurance markets in the country. In New Zealand, a flooding event and significant drought affecting large parts of the country triggered public support for recovery and relief, as well as to individual farmers in hardship through Rural Assistance Payments. Turkey provided additional coverage through the state-supported agricultural insurance scheme, issuing 2.1 million insurance policies and USD 250 million of state insurance premium support. The United States provided an additional USD 1.5 billion for the continuation of disaster assistance programme delivery, adding several new qualifying disaster events and eligible participants under the Wildfire and Hurricane Indemnity Program Plus (WHIP+). The USDA’s Risk Management Agency also introduced a new policy to help farmers recover from hurricanes, covering 70 different crops.
New laws and regulations on animal and plant health were introduced. Chile’s animal and plant health agency promoted electronic certification, now established for exports to 34 countries and covering around 70% of all phytosanitary certificates. Costa Rica’s animal and plant health institutions established a single export window to deal with sanitary and phytosanitary procedures, and created an online system for consulting phytosanitary certificates for agricultural exports in real time. Switzerland introduced new plant health legislation, requiring stricter regulations and stronger preventive measures to protect plants from harmful pests. In the United States, the USDA’s Animal and Plant Health Inspection Service (APHIS) published the Sustainable, Ecological, Consistent, Uniform, Responsible, Efficient (SECURE) rule, the first comprehensive revision of the Agency’s biotechnology regulations in over 30 years. The new rule puts in place a more efficient process to identify plants that would be subject to regulation, focusing on the properties of the plant rather than on its method of production.
Concerning land reform and investment, Russia increased support for investments in agriculture, including purchases of agricultural machinery, goods and processing equipment. The company Rosagroleasing aims to supply 9 000 units of equipment in one year, which represents a 40% increase on last year’s numbers. South Africa established the Agriculture Development Agency to support the development of sustainable land reform programmes and reduce barriers to the commercialisation of small-scale farmers. Ukraine passed new legislation ending the ban on the sale of agricultural land. As of July 2021, individual citizens of Ukraine will be permitted to purchase up to 100 hectares of land, while from January 2024 purchases of up to 10 000 hectares will be made available to legal entities whose founders or final beneficiaries are Ukrainians, and which do not have business abroad or in offshore companies. Viet Nam approved a plan to promote investment in the agricultural and rural sector in 2021-25, including the following priorities: evaluating market potentials, trends and investment partners; building a database on investment promotion activities; establishing a list of projects calling for investment; and providing support to enterprises and investors.
Some countries provided new support to agricultural innovation and the development of digital technologies. Japan published the Smart Agriculture Comprehensive Policy Package, identifying key measures to advance data-driven agriculture over the next five years. The Ministry of Agriculture, Forestry and Fisheries also established the Conception and Projects for DX of Agriculture Initiative, which provides a roadmap for the development of artificial intelligence, big data, and the digitalisation of administrative procedures. Korea established the Smart Agriculture Project, which aims to promote the application of new technologies and attract young and innovative farmers to the agricultural sector. Young farmers can benefit from concessional leasing of agricultural facilities and farmlands in smart farm complexes, and cross-sectoral R&D projects will be conducted to support the development of new technologies. Turkey introduced the Digital Agriculture Market (DITAP), a digital platform to help develop supplier linkages between smallholders and large-scale food processing and retail firms. DITAP also helps small farmers to access markets for inputs such as seeds and fertilisers, and provides a platform for farmers to lease their land.
Numerous countries have concluded bilateral and regional trade agreements. On 15 November 2020, the Regional Comprehensive Economic Partnership (RCEP) was concluded by fifteen countries in the Asia-Pacific region, including Australia, China, Indonesia, Japan, New Zealand, the Philippines, Korea and Viet Nam. The Agreement will reduce tariffs on goods among the 15 participating economies by 90% over two decades from entry into force, and provides a framework for strengthening co-operation in the areas of standards, technical regulations, and conformity assessment procedures, as well as for streamlining rules of origin and border processes for perishable goods. The Canada-United States-Mexico Agreement (CUSMA) entered into force on 1 July 2020, preserving the existing agricultural commitments under the North American Free Trade Agreement (NAFTA). The European Union and Mexico finished negotiations on a new EU-Mexico trade agreement, which will further liberalise more than 85% of the agricultural tariff lines that were left out of the original EU-Mexico Global Agreement that has been in force since 2000. On 31 January 2020, the United Kingdom left the EU Single Market and Customs Union, ending the free movement of people, goods and services with the European Union. The rules governing trade and movement between the two are laid down in the draft EU-UK Trade and Cooperation Agreement, which was agreed on 24 December 2020 and ratified by the European Parliament on 27 April 2021. Of particular relevance to agriculture, the trade component of the agreement includes duty- and quota-free imports on all goods that comply with rules-of-origin provisions.
Several additional bilateral free trade agreements (FTAs) were negotiated or came into effect in 2020 and 2021, helping to facilitate bilateral trade in agricultural products. These include: the Canada–United Kingdom Trade Continuity Agreement; Colombia-Israel FTA; European Union-Viet Nam FTA; Indonesia-Australia Comprehensive Economic Partnership Agreement (CEPA); Indonesia-Korea CEPA; Japan-US FTA; Korea-Israel FTA; Ukraine-Israel FTA; United Kingdom-Israel FTA (and related protocol for the mutual recognition of organic produce); United Kingdom-Japan CEPA; United Kingdom-Korea FTA; United Kingdom-Mexico Trade Continuity Agreement; United Kingdom-Ukraine political, free trade and strategic partnership agreement; United Kingdom-Viet Nam FTA; United States-China Phase One Trade Agreement. Numerous other FTA negotiations are ongoing.
Trade promotion and market development policies were introduced by a number of countries. India initiated reforms to remove limits on private stocking, trading or buying of commodities, allow farmers to sell their agricultural products outside of government-regulated markets, and promote barrier-free inter and intra-state trade of agricultural commodities. The government also established a new Agriculture Infrastructure Fund to support farmers, producer organisations and agribusinesses through subsidised loans for post-harvest infrastructure such as cold storage, collection centres and processing units. To facilitate the exports of processed food products, the Ministry of Trade of Indonesia adopted measures to simplify the certificate of origin service and introduce automatic authentication procedures in licensing processes. Japan introduced the Act on Facilitating the Export of Agricultural, Forestry and Fishery Products and Food, which streamlines export policies for these products. The Strategy to Realize Export Expansion of Agricultural, Forestry, Fishery Products and Food designates products to prioritise resources and actions for agricultural export expansion. Russia introduced a programme to support exports of agricultural products, including additional financing for export infrastructure, simplification of border procedures, veterinary and phytosanitary services, information support, and support to promotion and market access.
Food systems face a daunting “triple challenge”. First and foremost, they are expected to achieve food security and nutrition for a growing world population. Second, they have an essential role to play in providing incomes and livelihoods for hundreds of millions of people involved in farming and other segments of the food chain. And third, they must do so in a sustainable manner, without depleting land, water and biodiversity resources, while contributing to reductions in greenhouse gas (GHG) emissions. The urgency of these challenges is reflected in the international political timetable, with food and agriculture at the heart of foreseen discussions in 2021 at the COP-26 UN Climate Change Conference, the COP-15 meeting of the Conference of the Parties to the Convention on Biological Diversity, and the UN Food Systems Summit.
Agricultural support policies have played a major role in shaping today’s food systems. Historically, the provision of support to agriculture has been motivated by a variety of policy objectives, which have included ensuring food security, supporting farmers’ incomes and livelihoods and improving environmental outcomes – key components of the “triple challenge”. The instruments chosen to pursue these objectives have varied widely. Some countries have relied on trade and open access to markets to ensure food security, while others have stressed domestic production and high rates of self-sufficiency, maintained via subsidies and trade protection. Countries have similarly varied in the extent to which they see income support as a goal for agricultural policy (as opposed to being covered by wider social protection programmes), and in the instruments they have chosen to deliver it. Most countries also have specific agri-environmental programmes, but many of the environmental impacts of agricultural policies stem from the choice of policies to address the first two objectives.
This section begins with an overview of the level and composition of agricultural support policies across countries. This is followed by an assessment of the implications of agricultural support for the performance of food systems, reflected in the extent to which they may be helping or hindering progress in meeting the triple challenge. Finally, the section considers the effectiveness of agricultural support policies in strengthening the overall productivity, sustainability and resilience of the agricultural sector – key channels for improving the performance of food systems.
An overview of support to agriculture
The OECD has been monitoring developments in agricultural support in OECD countries on an annual basis since 1988, with an increasing number of economies outside the OECD area included since then. This exercise quantifies different forms of policy intervention according to their implementation criteria, and forms the basis for an assessment of policy performance against stated objectives.
The current assessment covers 54 countries across six continents, including all OECD member countries, 5 non-OECD EU Member States, and 12 emerging and developing economies.10 Together, these countries represent three-quarters of global agricultural value-added. The assessment also discusses aggregate results for OECD member countries, the emerging economies, and all countries combined. In these aggregates, however, Costa Rica, which became the 38th Member of the OECD in May 2021, is included as one of the 12 Emerging Economies. The European Union is presented as one economic region, and includes the United Kingdom, which has left the European Union in early 2020 but remained part of the single market and continued to implement the Common Agricultural Policy through to the end of 2020 (a separate set of support indicators is presented in this report for the United Kingdom for 2017-20).
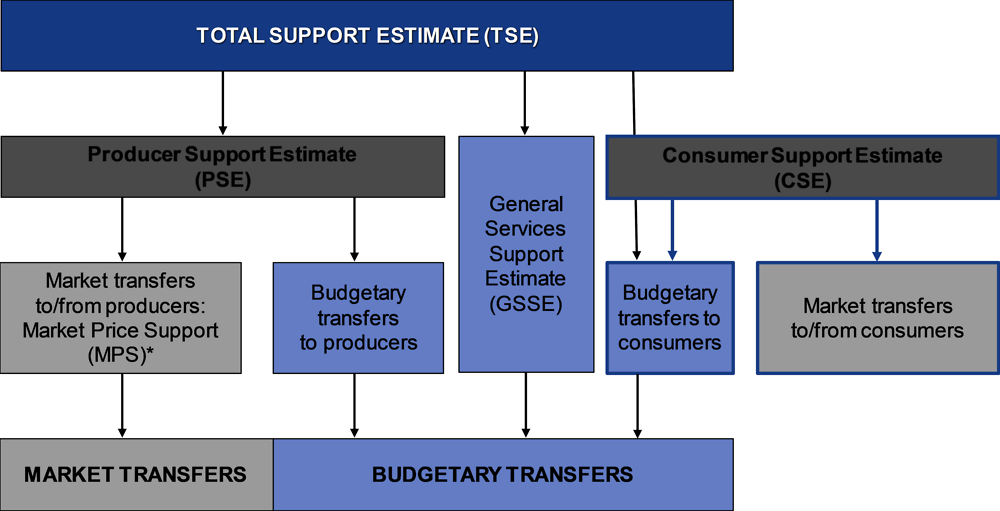
Figure 1.7 provides an overview of the structure of agricultural support indicators. The Total Support Estimate (TSE) is the OECD’s broadest indicator of support. It comprises policy expenditures in general services for primary agriculture that benefit the sector as a whole (General Services Support Estimate or GSSE); policy transfers to individual producers (Producer Support Estimate or PSE); and budgetary support to consumers included in the Consumer Support Estimate (CSE). Annex 1.A provides definitions of the OECD indicators of agricultural policy support.
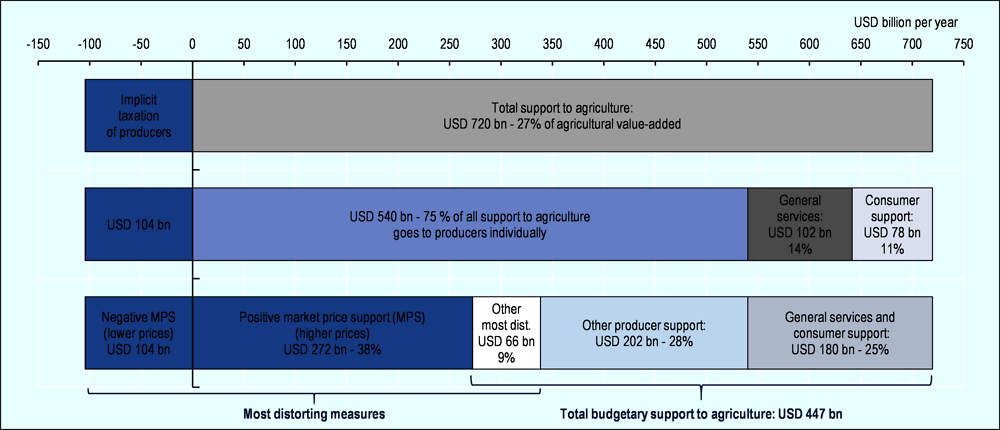
In 2018-20, agricultural support policies across the 54 countries covered in this report generated USD 720 billion per year in transfers to agriculture. This was counter-acted by more than USD 104 billion per year in implicit taxation of farmers. Individual producers received USD 540 billion in support per year (about 75% of all positive transfers to agriculture) through various support measures, including higher prices paid by consumers.
Governments employ a variety of different policy measures to deliver agricultural support (Figure 1.8). An important share of support is delivered through measures that modify domestic prices relative to world market prices. These policies do not result in government expenditures per se, but rather represent market transfers from consumers to producers, or vice-versa:
Market price support (MPS) arises from policies that create a price gap between domestic market prices and border prices for specific agricultural commodities (Box 1.2). Import licences, tariffs, tariff rate quotas and minimum prices are examples of measures that would result in higher prices paid by consumers. Total positive MPS amounted to USD 272 billion per year in 2018-20.
Some emerging and developing countries (Argentina, India, Viet Nam, Kazakhstan, Russia and Indonesia) implicitly tax producers on some or all agricultural commodities through measures that depress the domestic prices of these products, such as export taxes and export restrictions (resulting in negative market price support). Overall, negative MPS amounts to more than USD 104 billion per year.
The remaining support measures amounted to USD 447 billion per year, and are delivered in the form of budgetary payments and expenditures targeted to the agricultural sector (i.e. they represent transfers from taxpayers to producers, consumers, or to the sector as a whole):
Other most distorting support refers to subsidies linked to output or the unconstrained use of variable inputs (USD 66 billion per year), which have similar propensity to create market distortions to those generated by MPS.
Other producer support (USD 202 billion per year) includes payments based on land area, animal numbers, receipts or income, or payments not linked to the production of agricultural commodities, such as payments based on historical entitlements. These subsidies are considered to be “less coupled” to production and therefore more efficient in transferring income to the owners of land and other production factors. Payments can also be conditional on specific production practices and input uses designed to support environmental objectives. This category also includes specific payments designed to encourage farmers to adopt environmentally friendly technologies and practices.
Policies that benefit the agricultural sector as a whole include investments in R&D and innovation, infrastructure (including off-farm irrigation systems, transportation and the provision of information and communication technologies), biosecurity, marketing and public stockholding. These policies are measured by the General Services Support Estimate (GSSE), which amounted to USD 102 billion per year, or 14% of all positive transfers to agriculture.
Subsidies for consumers (such as food assistance programmes) amounted to USD 78 billion per year, or 11% of all positive transfers to agriculture.
Notes: Data refer to the All countries total, including all OECD countries, non-OECD EU Member States, and the 12 Emerging Economies.
“Implicit taxation" of producers refers to negative market price support, “General services” refers to the General services support estimate, “Consumer support” is transfers to consumers from taxpayers, “Other most dist.” refers to the most distorting producer support measures other than market price support (i.e. support based on output payments and on the unconstrained use of variable inputs).
Due to missing value-added data, the Total support to agriculture in 2018-20 is related to agricultural value-added data for 2017-19.
Source: Based on OECD (2021), “Producer and Consumer Support Estimates”, OECD Agriculture statistics (database), https://doi.org/10.1787/agr-pcse-data-en.
Total support to agriculture has grown considerably in nominal terms over the past two decades, largely driven by increasing support in large emerging economies (Figure 1.9). The nominal value of the total support estimate (TSE) for OECD countries has remained relatively stable, reaching USD 329 billion in 2018-20, with reforms stalling over the last decade following some previous reforms. At the same time, the share of total support in GDP has declined steadily from 1.0% in 2000-02 to 0.6% in 2018-20, reflecting the declining importance of the sector. In the 12 emerging economies, the TSE grew from USD 44 billion in 2000-02 to USD 280 billion in 2018-20, driven by increasing rates of producer support in the largest emerging economies – in particular, China, India and Indonesia. The TSE for emerging economies averaged 1.2% of GDP in 2018-20, reflecting the importance of support in the largest emerging economies, which are home to large agricultural sectors with sizeable agricultural populations. Additionally, emerging economies subjected their producers to more than USD 104 billion in negative market price support (i.e. implicit taxation) in 2018-20.
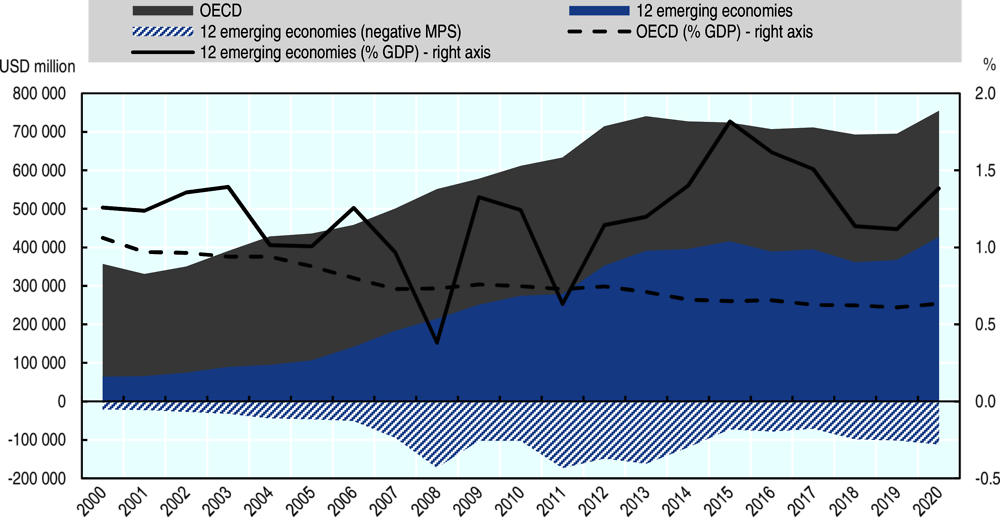
Notes: Negative MPS for OECD countries, mostly reflecting adjustments for higher feed costs due to positive MPS for feed commodities, averaged USD 427 million per year between 2000 and 2020, and is therefore too small to be visible on the graph.
The OECD total does not include the non-OECD EU Member States. Latvia and Lithuania are included only from 2004.
The 12 Emerging Economies include Argentina, Brazil, China, Costa Rica, India, Indonesia, Kazakhstan, the Philippines, Russian Federation, South Africa, Ukraine and Viet Nam.
Source: OECD (2021), “Producer and Consumer Support Estimates”, OECD Agriculture statistics (database), https://doi.org/10.1787/agr-pcse-data-en.
Aggregate figures mask the diversity in levels of support across countries (Panel A in Figure 1.10). The share of TSE in GDP (%TSE) indicates the cost of support to the sector for the overall economy. It was highest in Indonesia (2.5%), the Philippines (2.5%), and China (1.6%), partly reflecting the fact that agriculture has a comparatively high weight in the economies of these countries. The largest reductions in the %TSE since 2000-02 (in percentage points) have occurred in Turkey, Colombia and Korea – countries where the burden of support was initially high, but nonetheless still remained above 1.2% in 2018-20.
The level of total support in OECD countries continues to be high when measured relative to agricultural value added, amounting to 42% in 2018-20 (Panel B in Figure 1.10). Total support relative to the size of the sector varies widely across OECD countries, from 146% in Switzerland, 81% in Korea, and 78% in Japan, to less than 10% in just three countries: Australia, Chile and New Zealand. In comparison, total support in the 12 emerging economies represented just 15% of agricultural value added in 2018-20. The importance of support to the sector is highest in the Philippines (27%), China (22%), and Kazakhstan (21%). Total support is low relative to agricultural value added in India (4%) and Brazil (7%), and negative in Argentina and Viet Nam. The total effective tax on agriculture relative to the size of the sector was 54% in Argentina and 8% in Viet Nam.
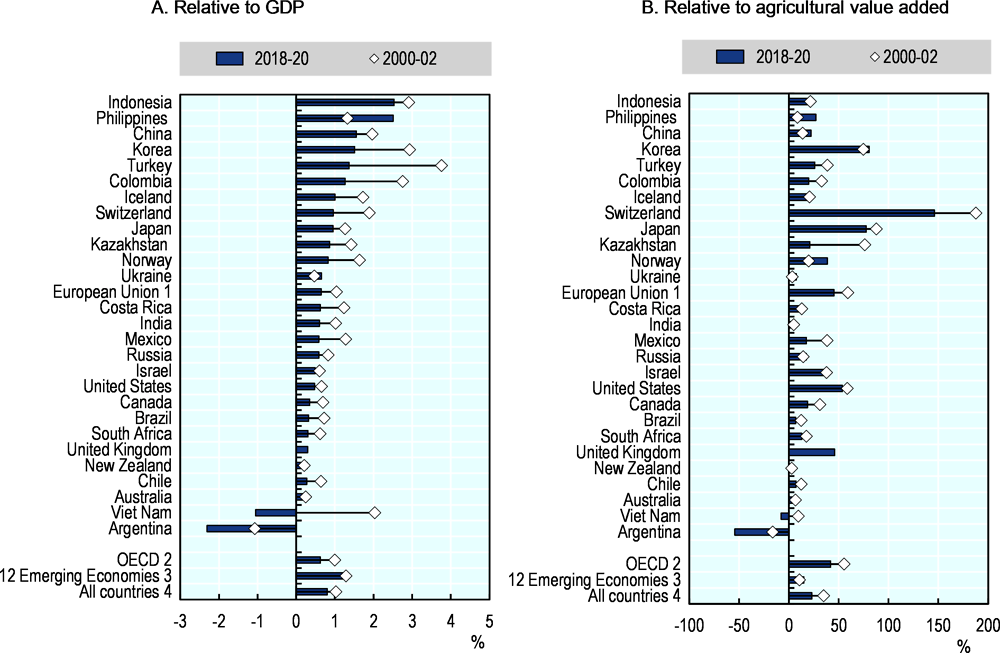
Notes: Countries are ranked according to the %TSE in 2018-20.
Due to missing value-added data, the 2018-20 average TSE is related to agricultural value-added data for 2017-19 except for Japan and the United States (2016-18) and for Canada and New Zealand (2015-17).
1. EU15 for 2000-02, EU28 for 2018-19 and EU27 plus UK for 2020.
2. The OECD total does not include the non-OECD EU Member States. Latvia and Lithuania are included only for 2018-20.
3. The 12 Emerging Economies include Argentina, Brazil, China, Costa Rica, India, Indonesia, Kazakhstan, the Philippines, Russian Federation, South Africa, Ukraine and Viet Nam.
4. The All countries total includes all OECD countries, non-OECD EU Member States, and the Emerging Economies.
Source: OECD (2021), “Producer and Consumer Support Estimates”, OECD Agriculture statistics (database), https://doi.org/10.1787/agr-pcse-data-en.
The Producer Support Estimate (PSE) measures policy transfers to individual agricultural producers. Transfers to producers in the PSE comprise market price support (MPS) provided through domestic market prices that are higher (or lower if support is negative) than world prices, and budgetary payments from the government to farmers (Figure 1.7). The price gaps generated by trade policies and domestic market interventions are typically calculated as a differential between domestic and reference prices, but in some cases alternative methods are used for these calculations (Box 1.2).
Market price support (MPS) is defined as the “annual monetary value of gross transfers from consumers and taxpayers to agricultural producers, arising from policy measures that create a gap between domestic market prices and border prices of a specific agricultural commodity, measured at the farm gate level” (OECD, 2016[13]). It is calculated for individual commodities, as the gap between the domestic price paid to producers and the equivalent price at the border (market price differential, MPD), multiplied by the quantity produced, and aggregated to the national level.
This definition contains three key elements. First, it measures the transfers that arise from policy measures that create a price gap (e.g. import tariffs, minimum prices, export taxes, etc.). Second, it measures gross transfers (positive or negative) to agricultural producers from consumers and taxpayers. Third, it is measured at the farm gate level to ensure that MPS values are consistent with the production and price data for the farming sector overall.
The price gap (MPD) is calculated only if policies exist that can cause the gap such as border measures that restrict or promote imports or exports, and government purchases, sales and intervention prices in the domestic market. If countries do not implement such policies, the MPD is assumed to be zero. A non-zero MPD, whether positive or negative, originates from price-distorting policies. It is important to note that MPS measures the “policy effort” (or level of support to prices), not the policy effect (e.g. the impact on farm income). In addition to policy instruments that restrict price transmission (say, a target price), market developments (such as exchange rate movements affecting world prices expressed in local currencies) may influence the implied policy effort and, hence, the resulting transfers.
The calculation of the MPD for individual commodities based on prices requires information not only on product prices, but also on differences in product qualities, processing and transportation margins, to compare like with like. In some cases, difficulties in identifying and obtaining relevant prices or other required information prevent the MPD calculation from being based on observed price gaps. An alternative option for calculating the MPD is the use of import tariffs or export taxes (OECD, 2016[13]), which is likely to provide accurate MPS estimates only if a uniform tariff or tax rate is the sole border measures in place.
The use of tariffs rather than price gap data comes with a number of complex measurement issues, covering issues such as the composition of product groups across tariff lines and the seasonality of production and trade. Moreover, in order to capture the marginal rather than the average import protection rate, the statutory applied MFN tariffs are used. In light of the growing number of preferential trade agreements (PTAs) engaged in by countries covered by this report, an important caveat therefore relates to the fact that the statutory applied MFN tariffs remain unchanged even when increased quantities of products are imported under preferential tariffs or duty-free within such PTAs. As a consequence, potential liberalising effects of new PTAs are not reflected in the MPS estimates when tariffs are used to calculate them. With the increased relevance of PTAs for international trade, it therefore becomes even more important to base the MPD calculations on price gap calculations whenever data allow.
When interpreting MPS values, it is important to bear in mind that MPS is not a measure of public expenditures but an estimation of implicit or explicit transfers. MPS estimates published by the OECD therefore often differ from, and should not be confused with, those published by other organisations, including by the World Trade Organization, which may use very different concepts to calculate their indicators, despite similar names (Diakosavvas, 2002[14]; Effland, 2011[15]; Brink, 2018[16]).
Source: (OECD, 2020[3]).
The average %PSE (producer support as a share of gross farm receipts) for all 54 countries has been declining over the past two decades, from 18% in 2000-02 to 11% in 2018-20 (Figure 1.11). Within this average is a clear pattern of a decreasing rate of producer support in OECD countries and increasing rate of producer support in emerging and developing economies from the beginning of the century until 2015. In OECD countries, the %PSE fell from 28% in 2000-02 to 18% in 2018-20. Most of this decline was driven by reforms initiated prior to 2008; the pace of decline has been markedly slower since and reversed to a slight increase after 2014. In contrast, the %PSE in emerging economies almost doubled from 3.8% in 2000-02 to 7.4% in 2018-20.
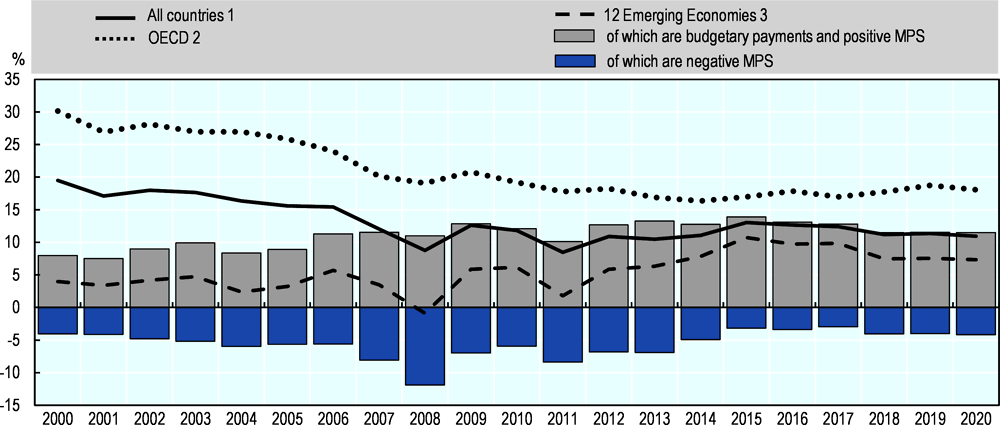
Notes: The two bars relate to the 12 Emerging Economies and represent a decomposition of PSE into its positive and negative parts.
1. The All countries total includes all OECD countries, non-OECD EU Member States, and the 12 Emerging Economies.
2. The OECD total does not include the non-OECD EU Member States. Latvia and Lithuania are included only from 2004.
3. The 12 Emerging Economies include Argentina, Brazil, China, Costa Rica, India, Indonesia, Kazakhstan, the Philippines, Russian Federation, South Africa, Ukraine and Viet Nam.
Source: OECD (2021), “Producer and Consumer Support Estimates”, OECD Agriculture statistics (database), https://doi.org/10.1787/agr-pcse-data-en.
The %PSE in emerging economies reached a peak of 10.8% in 2015 and subsequently declined to 7.4% in 2020. This is in part due to higher levels of negative market price support, which depressed the domestic prices of certain commodities in some of these countries. Indeed, the %PSE represents the balance of positive and negative MPS elements, and tends to underestimate the extent of price distortions when both positive and negative price support are present.
Support remains highly concentrated. In 2000-02 the overall value of producer support was concentrated in OECD countries, in particular the European Union, the United States and Japan. Since then, support in some large emerging economies (China, India and Indonesia) has become increasingly important. Four countries accounted for the vast majority of the aggregate net Producer Support Estimate in 2018-20: China (44%), the European Union (24%), the United States (10%) and Japan (9%). Negative market price support was predominantly provided by India (78%). The size of the agricultural sectors in these countries means that any policy will automatically result in large absolute numbers. For this reason, it is often useful to express the producer support estimate relative to gross farm receipts, as is done in Figure 1.12 below.
Countries differ widely in their tendency to support (or tax) their farmers. The countries with the highest levels of producer support when measured as a share of gross farm receipts are all in the OECD area. In Norway, Iceland, Switzerland, Korea and Japan, agricultural policy transfers arising from tariffs and other support measures generate between 40% and 60% of the revenues received by farmers. Producer support is above the OECD average of 18% in the Philippines, Indonesia, the United Kingdom, the European Union, and Israel. Seven countries have low levels of support, below 5%: Kazakhstan, South Africa, Chile, Australia, Ukraine, Brazil and New Zealand. Finally, three countries have negative levels of producer support, as a consequence of farmers facing implicit taxation through suppressed producer prices: Argentina, Viet Nam and India.
The level of producer support as a share of gross farm receipts has declined across OECD countries relative to the levels observed in 2000-02. Support has also declined in a number of emerging economies, notably Brazil, South Africa, Kazakhstan and Costa Rica. As mentioned previously, some of the larger emerging economies increased their level of support as measured by the %PSE, including Ukraine, Indonesia, China, the Philippines and Russia. Support to producers became more negative in Argentina and India, while Viet Nam’s %PSE turned from positive in 2000-02 to negative in 2018-20.
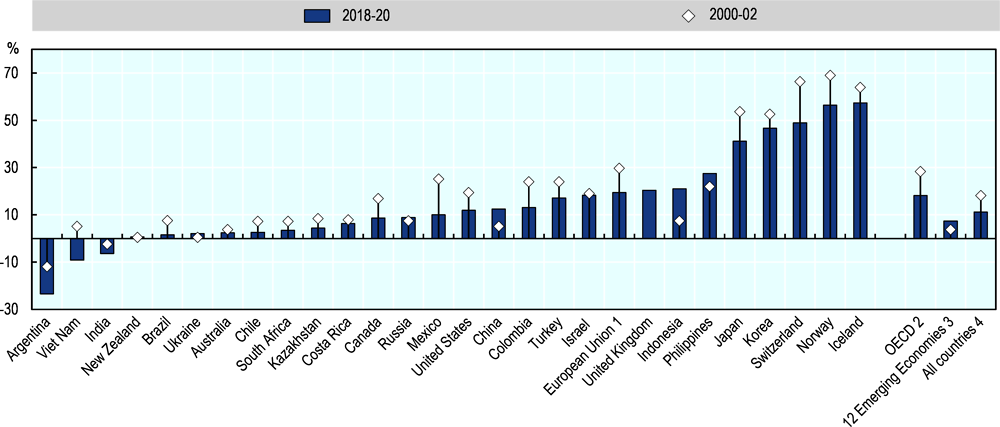
Notes: Countries are ranked according to the 2018-20 levels.
1. EU15 for 2000-02, EU28 for 2018-19 and EU27 plus UK for 2020.
2. The OECD total does not include the non-OECD EU Member States. Latvia and Lithuania are included only for 2018-20.
3. The 12 Emerging Economies include Argentina, Brazil, China, Costa Rica, India, Indonesia, Kazakhstan, the Philippines, Russian Federation, South Africa, Ukraine and Viet Nam.
4. The All countries total includes all OECD countries, non-OECD EU Member States, and the Emerging Economies.
Source: OECD (2021), “Producer and Consumer Support Estimates”, OECD Agriculture statistics (database), https://doi.org/10.1787/agr-pcse-data-en.
How do agricultural support policies affect food security and nutrition?
According to the FAO, “a person is food insecure when they lack regular access to enough safe and nutritious food for normal growth and development and an active and healthy life.” The severity of food insecurity can vary by time and degree, ranging from mild (uncertainty regarding one’s ability to obtain food) to moderate (compromising on food quality and variety, reducing food quantity, skipping meals) to severe food insecurity (no access to food for more than a day) (FAO, 2020[17]).
The world as a whole is not on target to achieve the United Nations Sustainable Development Goals target 2.1, of “ensuring access to safe, nutritious and sufficient food for all people all year round”, nor target 2.2, of “eradicating all forms of malnutrition”. While the proportion of people who are undernourished declined significantly over the past few decades, this trend has reversed in recent years. The prevalence of undernourishment increased from 8.6% in 2014 to 8.9% in 2019, and the absolute number of people affected by hunger increased by 60 million over the same period. Nearly 750 million people, or 10% of the world’s population, were considered to be severely food insecure in 2019, while an estimated 2 billion people (26% of the global population) experienced moderate or severe food insecurity, meaning that they did not have regular access to safe, nutritious and sufficient food.
Africa and Asia currently account for 92% of the world’s undernourished, or 631 million out of 688 million people. If current trends persist, the number of people affected by hunger is projected to exceed 840 million in 2030, of which 762 million (91%) will be in Africa and Asia. The COVID-19 pandemic has also led to a significant worsening of the situation, potentially resulting in an additional 83-132 million undernourished people in the world in 2020 (FAO, IFAD, UNICEF, WFP and WHO, 2020[18]).
Food security is linked to multiple areas of government policy, including macroeconomic policies that raise incomes and thereby improve access to food, trade policies that influence food availability, and public health and sanitation policies that improve food safety and nutritional outcomes. Tackling this complex and multi-faceted problem requires ensuring that sufficient food is available, that people have access11 to food, and that food leads to good nutritional outcomes. A fourth requirement is the stability of these three dimensions over time, which implies effective risk management (OECD, 2013[19]). This section assesses the specific impact of agricultural support policies on the four dimensions of food security: availability, access, nutrition, and stability.
Food availability
A global lack of food has not been a fundamental cause of continued food insecurity around the world. Global agricultural production has increased four-fold since 1960, with the amount of food available per person growing by 56%. This remarkable growth in supply can be largely attributed to productivity growth and yield improvements, as agricultural production has rapidly outpaced population growth and the expansion of agricultural land (Figure 1.13). The OECD-FAO Agricultural Outlook 2020-2029 projects that the pace of demand growth for agricultural commodities will slow over the coming decade, and will continue to be outpaced by efficiency gains in crop and livestock production (OECD/FAO, 2020[20]).
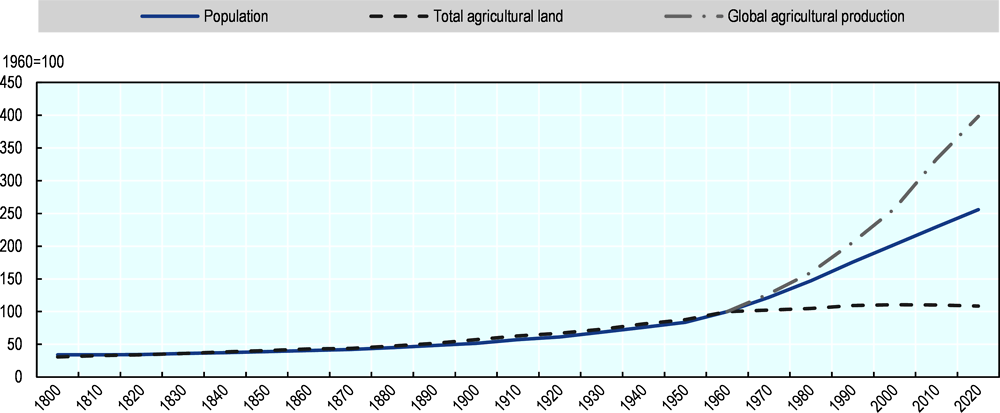
Sources: Population data from Maddison's historical statistics for 1820-1940; UN Population Division for 1950-2010; 1800 and 1810 extrapolated from Maddison. Agricultural (crops and pasture) land data for 1800-2010 from the History Database of the Global Environment (HYDE 3.2), Klein Goldewijk et al. (2017). Global agricultural production data for 1960-2010 from FAOSTAT (Net Agricultural Production Index); data for 2020 from OECD/FAO (2020), “OECD-FAO Agricultural Outlook”, OECD Agriculture statistics (database), https://doi.org/10.1787/agr-outl-data-en.
Even so, some countries have suffered from a lack of food availability due to prolonged conflicts and extreme fragility. More commonly, however, food insecurity in these countries is driven by poverty and a lack of access to food. Across 15 countries with a protracted crisis for which food price data are available, the cost of a healthy diet (USD 3.80) is roughly in line with the global average (USD 3.75), yet healthy diets are unaffordable for 86% of the population (compared with the global average of 38%) (FAO, IFAD, UNICEF, WFP and WHO, 2020[18]). Thus, the notions of food availability and access to food are closely linked.
Governments can improve the availability of food by stimulating the domestic supply of food with non-distorting policies (e.g. through productivity improvements, reduced post-harvest losses, or reduced diversion of food crops to biofuels), and by limiting excess food demand (e.g. through reductions in over-consumption and consumer waste). International trade also plays a vital role in increasing the availability of food by balancing the deficits of net food importers with the surpluses of net food exporters, and permitting an allocation of production across countries that reflects relative differences in resource abundance. Trade is particularly important for the food security of regions experiencing growing food demand, which often do not correspond to the areas in which supply can be increased in an efficient and sustainable manner.
Agricultural support policies have adverse implications for global food availability by encouraging a sub-optimal allocation of resources, altering the relative mix of products grown, and displacing production to less efficient locations (OECD, 2016[21]). Many countries provide support to their agricultural sectors through measures that artificially stimulate domestic production and distort trade, with potentially significant consequences for global food availability. The most distorting measures – market price support, payments based on output and payments based on variable inputs without constraints – represent more than half of all transfers to and from producers in many countries, although some countries have implemented reforms that have decoupled support from production levels (Figure 1.14).
Agricultural support policies are therefore concentrated on measures that seek to increase domestic food availability, but often do so in an inefficient way (e.g. by raising prices), rather than through productivity-enhancing investments in R&D, innovation and infrastructure. These policies may contribute to domestic supply increases, but also encourage crops to be diverted away from human food consumption and towards the production of animal feed, biofuels, and the expansion of stocks (Pingali, 2015[22]). Policies to reduce the overconsumption of food and reduce food waste have so far had limited success, but can also play an important role in increasing domestic food availability.
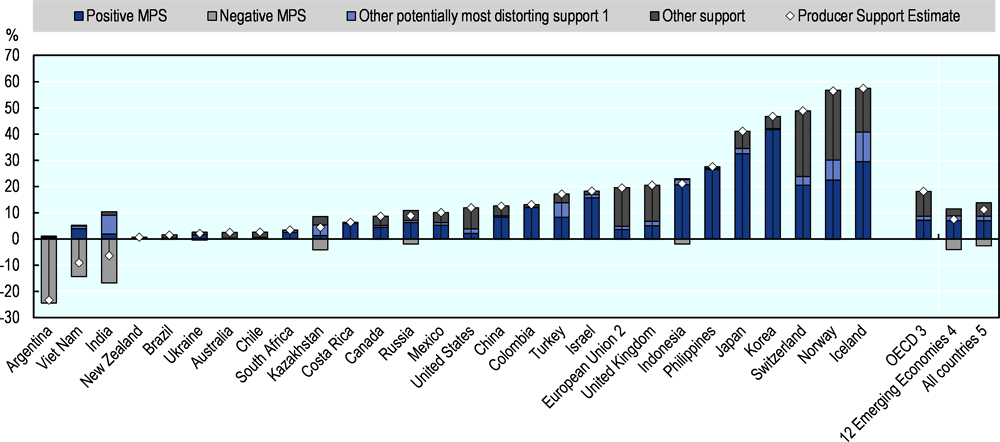
Notes: Countries are ranked according to the %PSE levels.
1. Support based on output payments and on the unconstrained use of variable inputs.
2. EU28 for 2018-19, EU27 plus UK for 2020.
3. The OECD total does not include the non-OECD EU Member States.
4. The 12 Emerging Economies include Argentina, Brazil, China, Costa Rica, India, Indonesia, Kazakhstan, the Philippines, Russian Federation, South Africa, Ukraine and Viet Nam.
5. The All countries total includes all OECD countries, non-OECD EU Member States, and the Emerging Economies.
Source: OECD (2021), “Producer and Consumer Support Estimates”, OECD Agriculture statistics (database), https://doi.org/10.1787/agr-pcse-data-en.
The most distorting support policies reduce the global availability of food by impeding international trade (Brooks and Matthews, 2015[23]). Market price support policies such as import tariffs, quotas, and minimum prices may boost domestic production but also raise domestic prices, thus reducing domestic demand and food imports. These policies also reduce access to food for low income consumers (discussed further in the section on “Access to food”) Export taxes and restrictions (discussed further in the section on “Stability”) lead to higher prices and lower exports, effectively amounting to an implicit tax on farmers (negative market price support). Such measures discourage production and long-term investments in productive capacity. Collectively, these policies also influence the pattern of specialisation across countries, causing production to shift from more efficient to less efficient locations. Farmers in countries with export potential and low levels of government assistance face lower returns, due to restrictions in market access and reduced opportunities to sell into protected markets (OECD, 2013[19]; Anderson and Valenzuela, 2021[24]).
The trade-distorting effects of agricultural support policies in OECD countries have declined considerably compared with earlier decades. Export subsidies were banned under WTO rules in 2015, and many countries have replaced market price supports for individual products with less distorting measures that are decoupled from current production. For example, Switzerland provides significant direct payments to farms, almost all of which are subject to environmental cross-compliance. These have increased over time, from around 20% of support to farmers in the 1980s to almost 50% in recent years. Successive reforms to the European Union’s Common Agricultural Policy (CAP) since the early 2000s have decoupled nearly half of budgetary support from production, by reducing distortive price supports and increasing direct payments to producers (of which nearly 60% are contingent on mandatory environmental constraints). Area-based payments and direct income payments have a weaker influence on production decisions, as they are not directly tied to output.
The importance of market price support is reflected in the fact that higher tariffs continue to be applied to trade in agricultural and food products, in spite of extensive tariff reductions since the 1994 Uruguay Round Agreement on Agriculture. The average applied tariff on agricultural products globally in 2018 was 7.8% (compared with 4.6% for industrial goods). At the same time, the gap between tariff rates bound under WTO rules and applied rates means that countries can raise tariffs on agricultural products to an average of 48.9% (compared with 27.1% for industrial goods). This significant water in the tariffs for agriculture adds to policy risks. Furthermore, average tariff rates mask distortions along specific product lines; while many tariff lines are at zero, some are considerably higher and may even exceed 100%, and there are many instances where tariff rates increase with higher levels of processing (OECD, 2020[5]).
To further illustrate this point, Figure 1.15 shows that levels of market price support (as a share of gross farm receipts) vary widely across countries and commodities. Only Australia, Chile, Brazil and Kazakhstan have low average levels of market price support, at or below 6% for all commodities. All other countries have at least one commodity with price support above 20%.12 Six countries (Korea, Japan, Iceland, the Philippines, Norway and Switzerland) have high average levels of market price support in excess of 20% of gross farm receipts, while average market price support is negative in Kazakhstan, Viet Nam, India and Argentina. Figure 1.15 also demonstrates that there is significant dispersion of market price support within countries, albeit with varying distributions across commodities. In several countries, some commodities are supported whilst others are taxed, creating significant additional distortions to prices and market signals.
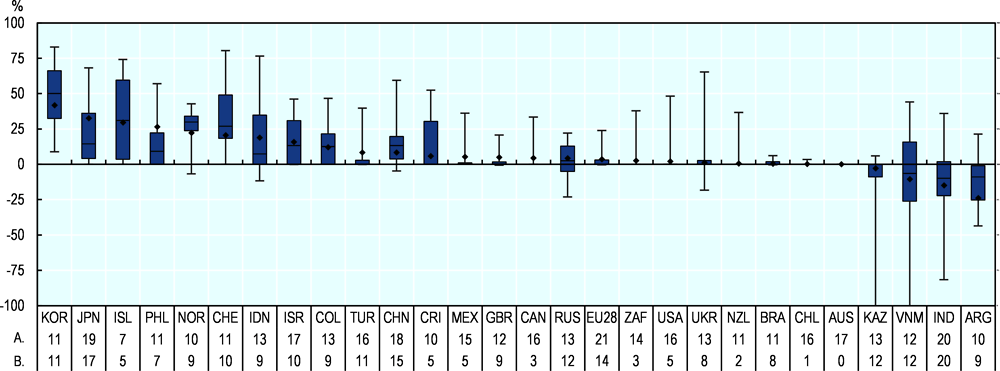
Notes: A. Number of MPS commodities. B. Number of MPS commodities with non-zero MPS values.
The ends of the whiskers represent the minimum and maximum values across commodities, while the boxes indicate ranges between the first and the third quartiles with the horizontal line inside indicating the median. Diamonds represent mean values for total agriculture. Minimum values for Kazakhstan and Viet Nam are -142% and -105%, respectively.
Source: OECD (2021), “Producer and Consumer Support Estimates”, OECD Agriculture statistics (database), https://doi.org/10.1787/agr-pcse-data-en.
Broad based multilateral reform of trade and domestic support policies is likely to generate large and widespread benefits for food availability, by facilitating shifts in production to regions that are best able to meet the growing global demand for food and agricultural raw materials. OECD (2016[21]) found that the removal of all trade-related and domestic support to agriculture would increase trade in both intermediate and final agro-food commodities (the largest effect was observed for final food products, due to higher applied tariffs on processed products and the fact that products may face tariffs on multiple occasions as intermediate goods travel across borders). Removing barriers to market access therefore has the potential to boost trade (including in intermediate agricultural products) and strengthen participation in agro-food global value chains (GVCs) (Greenville et al., 2019[25]).
Intra-regional trade can improve food availability in countries that face difficulties accessing world markets and integrating in global supply chains. Bilateral and more extensive trade agreements have become increasingly prevalent in the global agricultural trading environment since the early 1990s, in part due to the slow progress of multilateral negotiations. These agreements are often viewed as a vehicle for economic and political integration amongst members, and have resulted in substantial improvements in market access, delivering reduced tariffs across a broad range of agricultural commodities (Thompson-Lipponen and Greenville, 2019[26]). In some cases, however, preferential trade agreements may cause rents to shift to participating countries, rather than creating new market opportunities.
Reforming trade-distorting support can strengthen global food availability by allowing countries to benefit from improved market access and providing an important springboard for export-led growth. Trade openness can also improve access to food and contribute to faster economic growth, by raising the incomes of exporters (allowing them to profit from higher prices than would be received in the absence of trade) and importers (who benefit from lower prices than would otherwise be paid) (Brooks and Matthews, 2015[23]). However, it is important to recognise that reforms to the most distorting forms of support are likely to impose short-term costs on some stakeholders. In particular, producers that formerly benefited from protection, exporters that benefited from preferential market access, and consumers that benefited from former policy arrangements may face difficulties adapting to a more competitive trading environment. In such cases, it may be necessary to provide transitional assistance. Social safety nets can facilitate structural adjustment, by ensuring adequate incomes for those with few viable economic alternatives (Brooks and Matthews, 2015[23]; OECD, 2002[27]).
It is particularly important to reform the most distorting policies that stifle innovation and hamper the agricultural sector’s long-term productivity and sustainability. In recent decades, agricultural productivity growth has played an essential role in increasing the global supply of food and contributing to widespread improvements in food availability. Productivity growth has also put significant downward pressure on food prices, resulting in improved access to food for poor consumers worldwide. The growth in agricultural productivity owes much to efforts by governments to facilitate the provision of public goods and services and create enabling conditions to strengthen the competitiveness of agriculture. Continued policy attention in these areas will be fundamental to achieving sustained improvements in food security.
The General Services Support Estimate (GSSE) includes expenditures on R&D and innovation, inspection services, infrastructure development and maintenance, marketing and promotion, and public stockholding. Despite its potential to contribute to sustainable productivity growth and strengthen food security, the GSSE tends to be much lower than support provided directly to producers: in 2018-20, it represented 13% of the Total Support Estimate (TSE) in OECD countries, and 20% of the TSE across the 12 emerging economies.
When measured as a share of agricultural value added, the GSSE stood at just 5.6% in OECD countries and 3.0% in the 12 emerging economies in 2018-20 (Figure 1.16). Expenditures on general services were highest in Switzerland (16% of agricultural value added), Japan (16%) and Korea (12%). In the remaining countries, the GSSE ranged between 1.0% of agricultural value added in Iceland and 6.1% in the United States. The composition of expenditure also varies widely across countries: agricultural knowledge and innovation systems accounted for just 5% of GSSE expenditures in Indonesia, and 92% in Brazil13. Spending on infrastructure development and maintenance ranged from 3% of the GSSE in Ukraine to 86% in Japan.
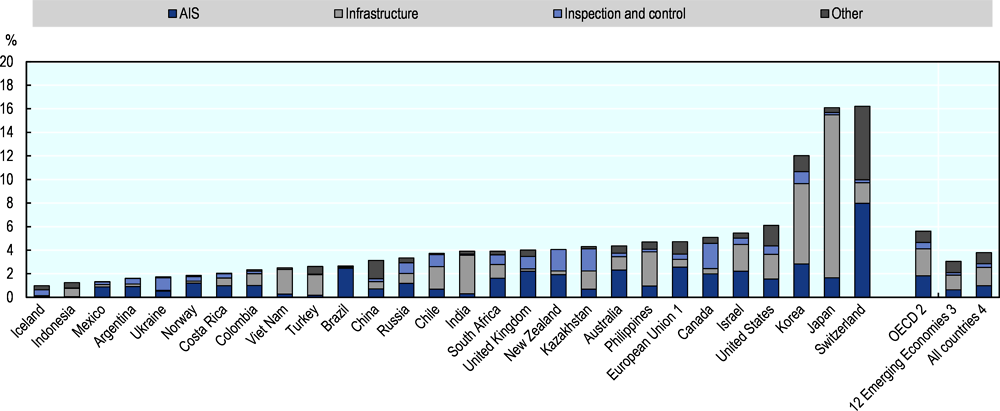
Notes: “AIS” refers to the Agricultural knowledge and innovation system. “Other” includes the marketing and promotion, cost of public stockholding, and miscellaneous categories of the GSSE. Countries are ranked according to the share of total GSSE in agricultural value added.
Due to missing value-added data, the 2018-20 average GSSE is related to agricultural value-added data for 2017-19 except for Japan and the United States (2016-18) and for Canada and New Zealand (2015-17)
1. EU28 for 2018-19, EU27 plus UK for 2020.
2. The OECD total does not include the non-OECD EU Member States. Latvia and Lithuania are included only for 2018-20.
3. The 12 Emerging Economies include Argentina, Brazil, China, Costa Rica, India, Indonesia, Kazakhstan, the Philippines, Russian Federation, South Africa, Ukraine and Viet Nam.
4. The All countries total includes all OECD countries, non-OECD EU Member States, and the Emerging Economies.
Source: OECD (2021), “Producer and Consumer Support Estimates”, OECD Agriculture statistics (database), https://doi.org/10.1787/agr-pcse-data-en.
R&D plays a vital role in strengthening productivity in agricultural production, food processing and delivery to consumers. There is ample evidence that public investments in agricultural R&D generate large rates of return (Alston et al., 2010[28]; Piesse and Thirtle, 2010[29]), and can have positive implications for food security (Kristkova, van Dijk and van Meijl, 2017[30]). Public funding is crucial in areas where private investors are missing, and can help to stimulate private investment, including through public-private partnerships (PPPs). Governments should also work to create an enabling environment for private investments, provide stable funding for knowledge infrastructure, and strengthen linkages within the agricultural innovation system between R&D and technical assistance. Making innovation systems more collaborative and demand-driven can improve the impact of public expenditure. Efforts to improve the governance of the agricultural innovation system may include the development of long-term strategies for agricultural innovation, involving stakeholders more formally and earlier in the process, and strengthening evaluation frameworks (OECD, 2019[31]). Agricultural R&D remains dominated by the public sector in many countries, while private research tends to focus on specific areas (e.g. genetic improvements, fertilisers and chemicals, machinery, food processing). However, growth in public agricultural R&D investment has been slowing over the past decade in high-income countries (Heisey and Fuglie, 2018[32]).
In addition to maintaining strong levels of investment in agricultural R&D, investments in productivity-enhancing infrastructure can also strengthen food availability. Well-developed transportation infrastructure, including rural road networks and access to port facilities, can help to connect farmers with markets and allow them to take advantage of export opportunities. Ensuring affordable access to ICTs in rural areas can provide farmers with real-time information on food prices and weather conditions, improve the reach of early-warning systems, and facilitate the adoption of new digital technologies and innovations. At the same time, some investments to expand irrigation infrastructure may slow structural change and hamper the development of diversified farming systems, with potential negative consequences for environmental sustainability.
Access to food
Access to food is fundamentally driven by two related factors: the price of food, and real incomes. High agricultural prices can impede access to food for low-income consumers, who typically spend a large proportion of their household budgets on food. Food prices have been declining since the mid-1970s and are low by historical standards (Figure 1.17). With no major structural shifts in agricultural commodity demand on the horizon, the OECD-FAO Agricultural Outlook 2020-2029 projects flat to declining real agricultural prices over the next ten years (OECD/FAO, 2020[20]).
It is important to recognise that farmers are affected by food prices as both buyers and sellers. Whilst higher prices can improve incomes and access to food for some farmers, the majority of the rural poor are net buyers of food staples (OECD, 2013[19]). Sharp increases in the prices of food staples – as was witnessed during the 2007-08 food price crisis – can therefore lead to lower real incomes and weaken the purchasing power of poor farmers as well as consumers, undermining food security objectives. Several studies have found that higher food prices have a negative impact on poverty and welfare outcomes, particularly for poor households who tend to spend a greater share of their incomes on food (Filipski and Covarrubias, 2012[33]; Ivanic and Martin, 2008[34]).
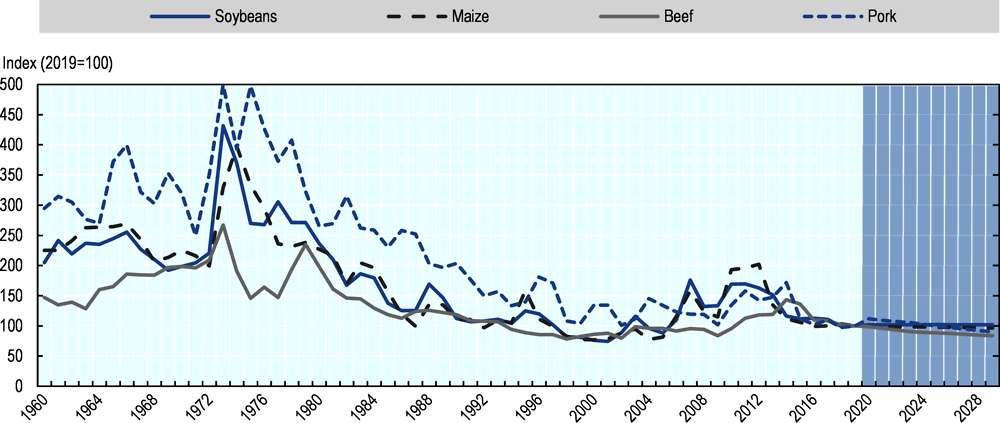
Notes: Historical data for soybeans, maize and beef from World Bank, "World Commodity Price Data" (1960-1989). Historical data for pork from USDA QuickStats (1960-1989).
Source: OECD/FAO (2020), “OECD-FAO Agricultural Outlook”, OECD Agriculture statistics (database), https://doi.org/10.1787/agr-outl-data-en.
The prospect of continued low prices for food staples bodes well for the overall accessibility of food. However, there are concerns that healthy and nutritious foods remain unaffordable for much of the world’s population, leading to rising rates of hunger, food insecurity and malnutrition. According to the State of Food Security and Nutrition in the World 2020, healthy diets14 cost 60% more than diets that only meet the requirements for essential nutrients, and are nearly five times more expensive than diets that only meet the basic dietary energy needs through a starchy staple. More than 1.5 billion people cannot afford a diet that meets the required levels of essential nutrients, and over 3 billion people cannot afford the cheapest healthy diet (FAO, IFAD, UNICEF, WFP and WHO, 2020[18]).
Agricultural support policies are often implemented by raising domestic prices above world market prices, leading to higher costs for the consumers of agricultural commodities. The percentage Consumer Support Estimate (%CSE) expresses the monetary value of the transfers to consumers (both through prices and through food assistance programmes) as a percentage of consumption expenditure (measured at farm gate). When domestic prices are higher than world market prices, consumers are effectively subjected to implicit taxation. In most countries, consumers are harmed by market price support policies, resulting in negative values for the %CSE (Figure 1.18). The level of this implicit tax ranges from zero in Australia to more than 35% in Iceland, Korea, Japan and Norway. Some emerging economies (India, Argentina, Kazakhstan and Viet Nam) have a positive %CSE, meaning that they implicitly tax producers and support consumers by artificially lowering the prices for agricultural commodities. The United States is the only OECD country with a positive %CSE, due to the high level of budgetary transfers for food assistance programmes.
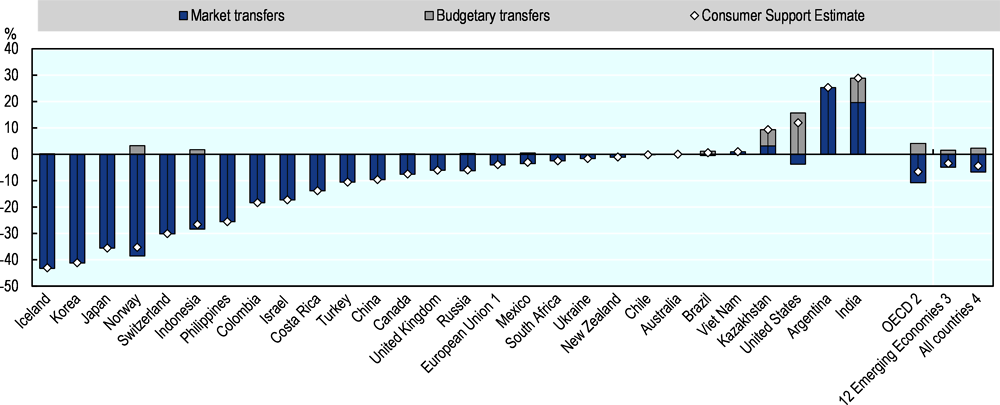
Notes: Countries are ranked according to percentage CSE levels. A negative percentage CSE is an implicit tax on consumption.
1. EU28 for 2018-19, EU27 plus UK for 2020.
2. The OECD total does not include the non-OECD EU Member States.
3. The 12 Emerging Economies include Argentina, Brazil, China, Costa Rica, India, Indonesia, Kazakhstan, the Philippines, Russian Federation, South Africa, Ukraine and Viet Nam.
4. The All countries total includes all OECD countries, non-OECD EU Member States, and the Emerging Economies.
Source: OECD (2021), “Producer and Consumer Support Estimates”, OECD Agriculture statistics (database), https://doi.org/10.1787/agr-pcse-data-en.
Market price support policies generally result in lower real incomes and reduced access to food. Poor consumers are disproportionately burdened by higher agricultural prices, as food accounts for a greater share of their household budgets. In addition, small farmers in emerging and developing economies are often net buyers of agricultural commodities, and therefore bear a part of these costs. Market price support also has a negative influence on the competitiveness of downstream segments of the food chain: livestock producers face higher costs for animal feed, and food processing industries face higher prices for their inputs. Furthermore, if support measures are sufficient to cause countries to have an export surplus, they can curtail export opportunities for farmers in countries with low levels of government assistance (such as Australia, Brazil and New Zealand) (Anderson and Valenzuela, 2021[24]).
While prices clearly matter and have a strong influence on the affordability of food, real incomes and poverty levels also play an essential role in determining access to food. If incomes are extremely low, even cheap food can be out of reach for the poor (OECD, 2021[35]). In many emerging and developing countries, increases in food prices such as those experienced during the 2007-08 food price crisis were largely compensated for by robust growth in incomes. Countries therefore have much better prospects of strengthening access to food by raising incomes and tackling poverty than by attempting to lower domestic prices below world levels (OECD, 2013[19]).
Governments have a range of policy tools at their disposal to support the incomes of rural households and improve access to food (discussed further in the section on “Incomes and livelihoods. Conditional cash transfers have been a popular and effective tool deployed by many developing countries in recent years. Such programmes provide cash to poor households on the condition that they make pre-determined investments (e.g. in schooling for their children). Emergency food reserves can also be used to protect the most vulnerable, provided they supply food to specific groups without disrupting private markets (OECD, 2013[19]). In addition, many countries have introduced social safety nets and food assistance programmes to provide low-income households with better access to food. Examples include the USDA’s Supplemental Nutrition Assistance Programme and National School Lunch Programme, Korea’s Food Voucher Assistance Programme, and the United Kingdom’s Healthy Start scheme (Placzek, 2021[10]). The COVID-19 pandemic has also had a measurable impact on access to food, mainly through declines in income and increases in global poverty (Laborde et al., 2020[36]). In response to the crisis, for example, India’s food subsidy allocation increased from USD 13 billion in the 2020-21 budget estimate to USD 48 billion in the revised budget estimates, reflecting the additional cost of free food grain distribution in the wake of the COVID-19 pandemic.
Nutrition
Poor nutrition is a significant threat to the health and well-being of the world’s population. According to estimates from the State of Food Security and Nutrition in the World 2020, 144 million children (21%) under the age of five were stunted, 47 million (6.9%) were affected by wasting, and 38 million (5.6%) were overweight in 2019. At least 340 million children suffer from micronutrient deficiencies (FAO, IFAD, UNICEF, WFP and WHO, 2020[18]). Countries are also facing a growing public health burden linked to poor quality diets: more than two billion people (about 40% of the world’s adult population in 2016) are overweight or obese, and adult obesity is rising in all regions across the globe (Figure 1.19). Across the OECD, almost 60% of the population is overweight or obese, and nearly 25% of people are obese (OECD, 2019[37]).
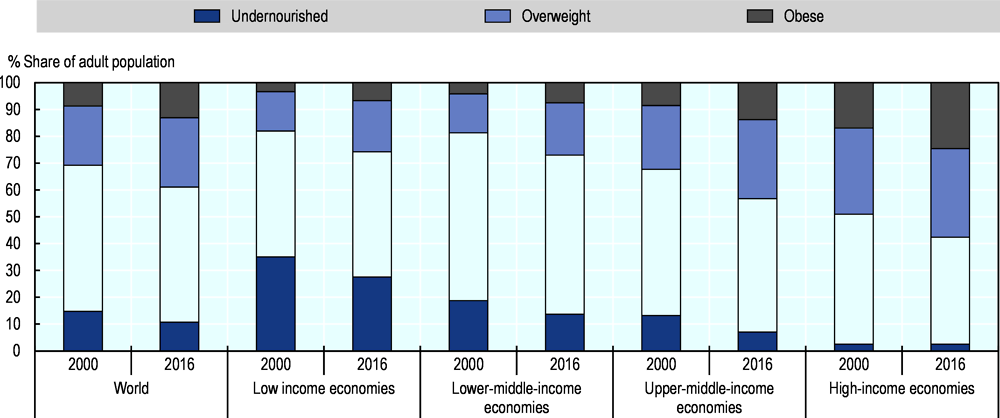
Source: WHO (2019), Global Health Observatory, World Health Data Platform, https://www.who.int/data/gho.
Malnutrition and obesity have significant negative consequences for health, quality of life, productivity and economic outcomes. Poor diets have been associated with increased rates of type II diabetes, cancer, cardiovascular diseases and other non-communicable diseases, as well as shorter lifespans. According to the Global Burden of Diseases, Injuries, and Risk Factors Study, dietary risks15 such as a high intake of salt, sugar and red or processed meat, and a low intake of whole grains, fruits and vegetables, were responsible for 7.9 million deaths among adults aged 25 years and older in 2019 (GBD 2019 Risk Factors Collaborators, 2020[38]). In OECD countries, overweight and obesity will claim an estimated 92 million lives by 2050, reducing life expectancy by nearly three years (OECD, 2019[37]).
Poor diets and unhealthy food choices impose considerable economic costs on society, including reduced school performance for children, higher rates of workplace absenteeism, and lower labour productivity. The combined economic impact of overweight on life expectancy, health expenditure and labour market productivity will reduce GDP by an estimated 3.3% per annum in OECD countries between 2020 and 2050 (OECD, 2019[37]).
The causes of poor nutrition in developed countries are complex and highly context-dependent, and include urbanisation, changes in lifestyles, socio-economic factors, as well as the low cost and widespread availability of processed and fast food (Placzek, 2021[10]). In addition, there are concerns that agricultural support policies may have contributed to worsening health and nutritional outcomes. Since the late 1960s, many countries have pursued national food security goals through an overarching focus on achieving self-sufficiency in the production of cereal crops such as wheat, maize and rice. Agricultural R&D was heavily biased towards staple grains, through large-scale public investments in the development of new crop varieties and advances in plant breeding. Policies such as price supports, preferential credit, input subsidies, and grain procurement for public stocks, as well as infrastructure investment (e.g. in irrigation networks), strongly encouraged farmers to specialise in the production of staple crops. As a result, global grain production increased substantially, and developing countries experienced rapid increases in yields per hectare during the Green Revolution: between 1960 and 2000, yields rose by 208% for wheat, 109% for rice, 157% for maize, 78% for potatoes, and 36% for cassava (Pingali, 2012[39]).
Over the past few decades, agricultural productivity growth has been a fundamental driver of poverty reduction and widespread improvements in global food security (Alston et al., 2010[28]; Kristkova, van Dijk and van Meijl, 2017[30]; Piesse and Thirtle, 2010[29]). In particular, productivity-led declines in food prices have substantially improved access to food for poor consumers, resulting in increased calorie availability per capita and a significant fall in the prevalence of undernourishment globally. However, an excessive policy focus on staple crops may have reduced dietary diversity by promoting the production of energy-dense cereals at the expense of micronutrient-rich non-staple foods, such as fruits, vegetables and pulses (Pingali, 2015[22]). As land and resources were increasingly allocated towards staple crops, important sources of critical micronutrients were displaced and became relatively less affordable (Bouis, 2000[40]; Kataki, 2002[41]). For example, during the 1970s and 1980s, farmers in India diverted land away from pulses to produce wheat and rice, leading to sharp increases in the price of pulses and a drop in their per capita consumption (Hazell, 2009[42]). More recently, work by the OECD has demonstrated that agricultural policies promote staple products such as rice and wheat at the expense of other production activities (OECD, 2016[21]). Today, diets across many societies are characterised by an over-consumption of processed foods, sugar and fat, and insufficient consumption of fruits and vegetables (Giner and Brooks, 2019[43]). With the exception of Asia and some upper-middle income countries, most countries do not have enough fruits and vegetables available to meet the FAO/WHO recommendation of consuming a minimum of 400 g per person per day (FAO, IFAD, UNICEF, WFP and WHO, 2020[18]).
The current structure of agricultural support policies may have significant consequences for nutritional outcomes. Figure 1.20 shows the transfers to specific commodities (expressed as a share of commodity gross farm receipts), which collectively represented more than 47% of producer support in 2018-20. Sugar has the highest reliance on government support, with transfers amounting to 28% of commodity gross farm receipts. Milk is highly supported in many OECD countries, although the aggregate %SCT hides significant variation in milk policies across countries (including -33% of implicit taxation in India). Energy-dense foods such as vegetable oils (rapeseed), staple crops (maize and rice) and meat also feature prominently, while relatively limited support is provided for fruits and vegetables. These measures ossify production and increase the supply of these commodities. To the extent that support measures encourage the production of nutrient-poor commodities, this may hamper incentives for farmers to diversify their production towards foods that are potentially richer in micronutrients.
At the same time, it is worth noting that most commodity-specific transfers come from increased domestic prices through policies such as import tariffs, quotas and minimum prices. Their immediate effect would therefore be to reduce the domestic consumption of these products. However, this effect may be small if consumers are not very responsive to higher prices (e.g. if demand is inelastic, or if the value of agricultural commodities accounts for a small share of overall food expenditures), and may be overwhelmed by the price-depressing effects of other support policies, such as taxpayer-financed subsidies and investments in R&D (Beghin and Jensen, 2008[44]; Pingali, 2015[22]).
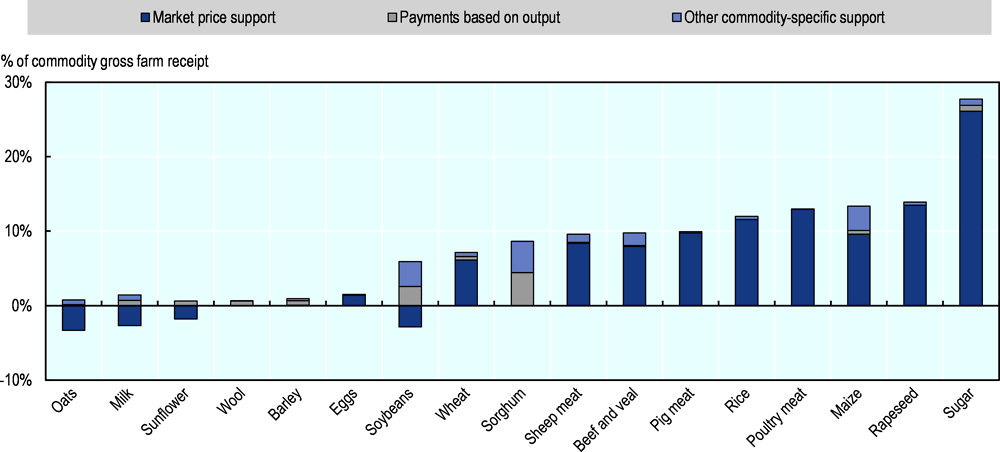
Note: Data refer to the All countries total, including all OECD countries, non-OECD EU Member States, and the 12 Emerging Economies.
Source: OECD (2021), “Producer and Consumer Support Estimates”, OECD Agriculture statistics (database), https://doi.org/10.1787/agr-pcse-data-en.
Reducing trade-distorting support could therefore facilitate a transition towards more diverse agricultural production systems, providing consumers with access to a broader range of nutritious foods necessary for a healthy diet (Brooks and Matthews, 2015[23]). Decoupled payments allow farmers to follow market signals in their production decisions, without biasing choices on what to produce, or whether to remain in the sector at all. Furthermore, there may be scope to rebalance support measures that directly encourage the production of staple crops towards the provision of a greater diversity of nutrient-rich perishable foods (Global Panel on Agriculture and Food Systems for Nutrition, 2020[45]).
Additional public and private investments may be needed to strengthen market infrastructure and information systems for nutrient-rich perishable foods (Pingali, 2015[22]). Investments in transport and storage infrastructure (including cold chains) can help to retain the nutritional value of fresh produce and high-value food products (FAO, IFAD, UNICEF, WFP and WHO, 2020[18]). Public funding for R&D and innovation focused on micronutrient-rich foods and food fortification, along with efforts to strengthen farmers’ knowledge and capacities, can provide further incentives for the production of nutrient-rich foods and the development of diversified farming systems (Bowman and Zilberman, 2013[46]; Global Panel on Agriculture and Food Systems for Nutrition, 2020[45]). In countries where per capita meat consumption exceeds healthy levels, a shift towards more plant-based diets, with lower levels of ruminant meat consumption, would have the twin potential of benefiting public health while lowering GHG emissions (Giner and Brooks, 2019[43]).
While there may be a need to rebalance agricultural investments across sub-sectors and towards more nutrition-sensitive investment, agriculture and trade policies are not always the best instrument to address the complex and multifaceted challenges of global malnutrition. Work by the OECD suggests that governments should favour demand side strategies for encouraging healthier food choices, with a parallel need to work with industry at the supply-demand interface, and in some cases impose stricter regulations on retailers, for example in the marketing of specific food products, in particular to children (Giner and Brooks, 2019[43]). Given alarming trends in public health, some governments are also giving increased consideration to fiscal measures. In particular more than 40 countries have imposed consumption taxes on sugar and sweetened beverages, a product category where consumption levels often exceed by a large margin those recommended by health guidelines (Hattersley et al., 2020[47]). The announcement in the United Kingdom of a soft drinks levy resulted in several major companies reformulating their products ahead of the introduction of the tax, suggesting that the credible threat of policy action can play an important role in prompting change and may be as important as the action itself.
Stability
Building stability in food systems is fundamental to achieving food security over the long term. Farmers and consumers are increasingly confronted with risks relating to climate change, natural disasters, price volatility and external shocks, such as the COVID-19 pandemic. Stability can also be influenced by agricultural support policies, including through sudden and unanticipated changes in the policy landscape.
Trade plays an essential role in maintaining stability in the global food system. By allowing produce to flow from food surplus areas to food deficit areas, trade helps to absorb the impacts of local and regional supply shocks. This generally results in lower price volatility, reduced uncertainty of supply, and greater integration of global and regional markets (OECD, 2013[19]). Where production variability is weakly correlated among countries, trade can help to mitigate supply volatility and manage domestic food shortages driven by poor harvests, droughts, floods and other catastrophic events (Brooks and Matthews, 2015[23]). The stabilising role of trade is only likely to increase in importance, as domestic production shocks become more frequent due to climate change. Policy distortions that impede trade’s role in maintaining stability in food systems can be measured by comparing the prices received by producers with world market prices (Box 1.3).
The extent to which agricultural policies distort trade and impede price transmission is reflected in the degree of alignment between the prices received by producers and those prevailing on world markets. The Nominal Protection Coefficient (NPC) is a ratio that compares effective prices received by producers (including per unit output payments) with world market prices (Figure 1.21).
The differences between effective producer prices and world prices are largest in Iceland (94%), Norway (75%), Korea (68%) and Japan (61%). At the other end of the spectrum, effective producer prices are more than 10% below world market prices in India (-14%) and Argentina (-20%). The closest alignment between effective producer prices and world prices is observed in Australia, Chile, Brazil and New Zealand (all less than 1%).
Since 2000-02, producer prices have become more closely aligned with world markets across almost all OECD countries (Israel’s NPC has increased slightly). The picture across the emerging economies is more mixed, with widened price gaps observed in seven out of twelve countries.
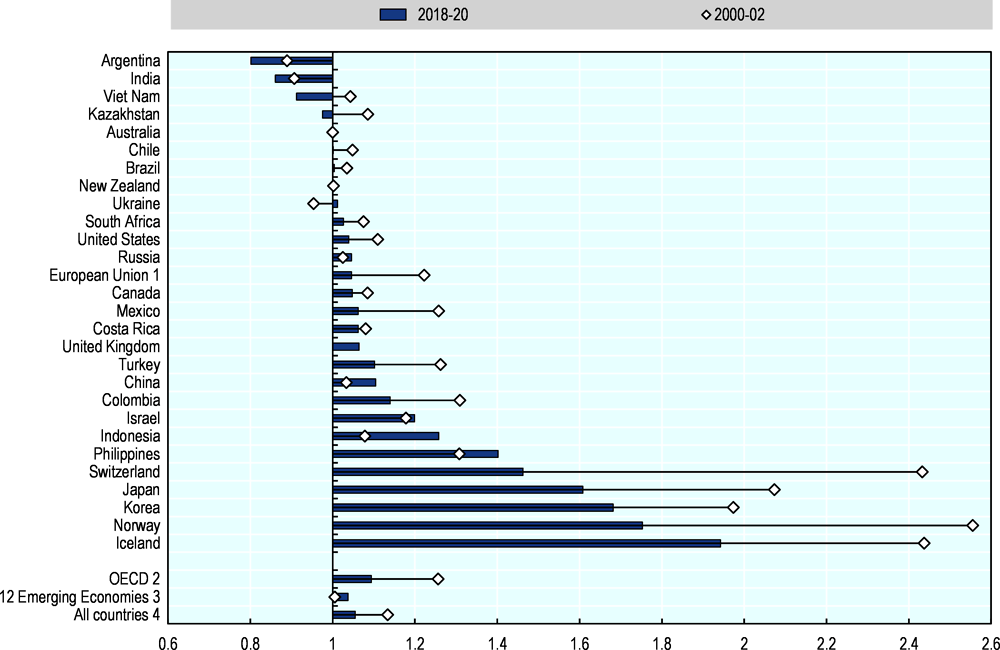
Notes: Countries are ranked according to 2018-20 levels.
1. EU15 for 2000-02, EU28 for 2018-19 and EU27 plus UK for 2020.
2. The OECD total does not include the non-OECD EU Member States. Latvia and Lithuania are included only for 2018-20.
3. The 12 Emerging Economies include Argentina, Brazil, China, Costa Rica, India, Indonesia, Kazakhstan, the Philippines, Russian Federation, South Africa, Ukraine and Viet Nam.
4. The All countries total includes all OECD countries, non-OECD EU Member States, and the Emerging Economies.
Source: OECD (2021), “Producer and Consumer Support Estimates”, OECD Agriculture statistics (database), https://doi.org/10.1787/agr-pcse-data-en.
Many countries have attempted to pursue self-sufficiency in staple crop production through border interventions such as import tariffs, quotas, and export restrictions. These measures ostensibly attempt to protect domestic constituents and prevent the transmission of international food price volatility onto domestic markets. The viability of such strategies is questionable however, as reducing a country’s integration with world markets will only increase its exposure to volatility in domestic output and prices. Domestic shocks tend to be more frequent and severe than international shocks, with output in individual countries varying to a much greater degree than the world output of individual food commodities (Brooks, 2012[48]).
Trade policy interventions such as export taxes and restrictions are often introduced with the stated intention of stabilising domestic markets, but have the perverse effect of withdrawing products from world markets, reducing food availability and contributing to higher and more volatile world prices. During the 2007-08 food price crisis, several countries placed temporary export restrictions on staple crops as a means to protect their domestic consumers from rising food prices. A number of grain-exporting emerging and developing economies adopted export bans, whilst several major grain-importing nations reacted by reducing pre-existing import tariffs and relaxing tariff-rate quotas. These measures exacerbated the increases in world prices and ultimately undermined the reputations of exporting countries as reliable suppliers on world markets, resulting in reduced long-term demand from traditional trading partners (Deuss, 2017[49]).
The reallocation of trade caused by export restrictions may encourage importing countries to lose confidence in international markets, and pursue less efficient policy objectives such as self-sufficiency and the expansion of public stocks. Public stockholding policies are almost always implemented using other policy instruments such as administered prices, trade policy measures, and import and export monopolies. These policies are often ineffective in reducing domestic price volatility, and may lead to negative spill-overs in international markets. In comparison to private stockholding, public stocks are arguably less responsive to market developments, and may therefore exacerbate rather than mitigate volatility if stock changes are misaligned with market needs. In particular, the acquisition of large amounts of grain to build or replenish public stocks can decrease the available supply on international markets, potentially putting upward pressure on world market prices. Conversely, the sudden release of large amounts of grains from public stocks can depress world market prices (Deuss, 2015[50]).
Trade interventions have had limited success in stabilising domestic market prices, and can result in significant welfare losses for poorer food-deficit countries (Anderson and Nelgen, 2012[51]). Whilst price stabilisation policies have on occasion been successful in containing the impact of large international price movements, they can transfer instability onto world markets and often prove to be fiscally unsustainable. Moreover, heavy trade distortions on some agricultural products make them susceptible to trade retaliation, thus adding to instability and uncertainty. Removing trade restrictions and market distortions could further strengthen the capacity of trade to stabilise markets and reduce price volatility, by allowing regions with better harvests to supply output to regions with worse harvests. If trade measures cannot be avoided, governments should design rules to limit their negative spill-over effects on other countries (OECD, 2013[19]).
Trade’s role in promoting stability can be further strengthened through investments in transport and storage infrastructure, as well as efforts to improve the transparency of information on supply, demand, stocks and prices – including through international initiatives such as the G20-led Agricultural Market Information System (AMIS). However, trade openness may not be sufficient to contain rare but severe international shocks, such as simultaneous harvest failures, price spikes on world markets, and supply chain disruptions such as those witnessed during the onset of the COVID-19 pandemic (OECD, 2021[35]). It may be necessary to gather more information on market concentration at various stages of food supply chains, and where appropriate, to actively support the geographic diversification of food and feed supplies in order to limit the risks of bottlenecks.
Beyond agricultural support policies, a range of other measures can be introduced to strengthen stability in the food system. Market-based mechanisms such as weather-indexed insurance can help to finance food imports during weather-related shortfalls in domestic production, without requiring costly monitoring of individual farms. Care should be taken to avoid subsidised insurance products that do not accurately reflect producers’ risk profiles, as such programmes can hamper incentives for on-farm risk management and crowd out private insurance options (OECD, 2020[52]). Well-functioning futures markets for agricultural commodities can play a significant role in reducing price fluctuations, through option contracts that lock in future import purchases at pre-determined prices. Furthermore, targeted social programmes (including cash transfers) can be an effective tool to mitigate the impacts of international price volatility on low-income households (OECD, 2013[19]).
How do agricultural policies affect incomes and livelihoods?
Food systems are a major source of incomes and livelihoods around the world. Primary agriculture accounted for 27% of total employment in 2019, and recent estimates suggest that there are at least 570 million farms worldwide, most of which are small (less than 2 hectares) and family-operated (World Bank, 2021[53]; Lowder, Skoet and Raney, 2016[54]). Food systems jobs represent the majority of self and wage employment in developing countries, with farming generating about 68% of rural income in Africa and about half of rural income in South Asia (Townsend et al., 2017[55]). Beyond farm production, food systems support job creation in a range of upstream and downstream industries, such as input supply, food processing, transport and logistics, supermarket chains and restaurants.
The structural transformation of economies has important influences on the development of agriculture and food systems. As countries develop, productivity improvements lead to rising agricultural output yet a decline in agriculture’s share in GDP, releasing labour out of agriculture and into faster growing non-agricultural sectors. With growing rural to urban migration and a consolidation of farm structures, agriculture’s share in total employment tends to decline as per capita incomes rise (Figure 1.22).
Structural change is also accompanied by transformations in the food system, with greater job opportunities offered by other segments of the value chain such as food processing, retail and other food services. Urbanisation and higher per capita incomes lead to changes in consumer preferences and new demands for fresh, processed and convenience foods. In low income countries (e.g. in eastern and southern Africa) agriculture accounts for about 90% of food-related employment, while in high income countries such as the United States, food services account for about two-thirds of all jobs in the food system (Townsend et al., 2017[55]). Food and beverage manufacturing now ranks among the top three manufacturing sub-sectors by value added in 27 OECD countries (OECD, 2021[35]).
At the same time, the agricultural sector is becoming increasingly integrated into global value chains (GVCs), providing new sources of employment and opportunities for farmers to grow their incomes. Foreign direct investment (FDI) and trade have facilitated greater participation in GVCs, spurred by the liberalisation of investment, falling tariffs, and reductions in trade-distorting support for agricultural producers (Punthakey, 2020[56]). Trade and GVC participation account for an estimated 20-26% of total agricultural labour income globally, with significant employment spill-overs in other supporting sectors such as industry and services (Greenville, Kawasaki and Jouanjean, 2019[57]).
Agricultural development can play an essential role in improving livelihoods and reducing rural poverty. However, it is important to recognise that rural regions are diverse and complex socio-economic systems that extend beyond agriculture, and encompass a broad range of manufacturing and service sector activities (e.g. mining, renewable energies, tourism). Indeed, many farm households derive a substantial share of their income from non-agricultural sources (OECD, 2003[58]). This implies that policies and investments to strengthen incomes and livelihoods should aim to offer multiple development pathways for farm households: improving competitiveness and productivity within agriculture, diversifying income sources among household members, and facilitating the transition of labour into non-agricultural sectors (Brooks, 2012[48]).
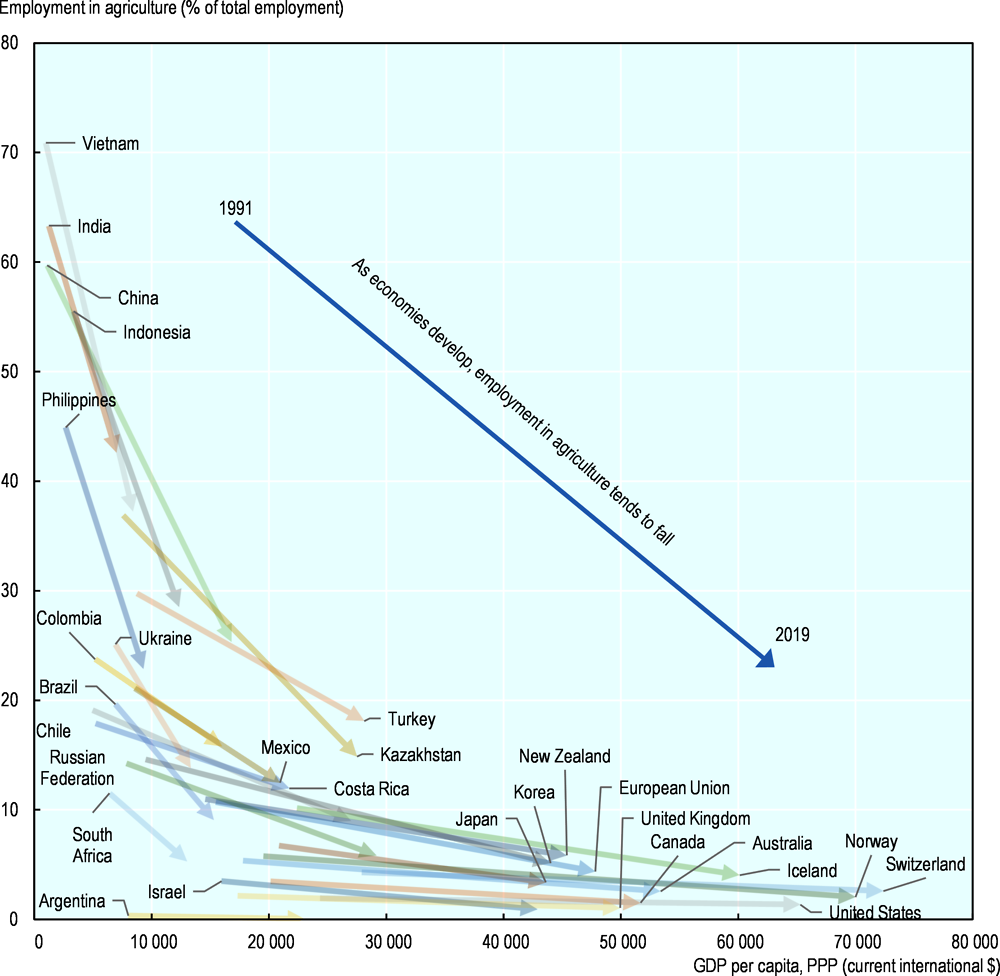
Source: World Bank (2021), World Development Indicators, https://databank.worldbank.org/source/world-development-indicators.
In 2018-20, the governments of 54 countries provided USD 540 billion per year in support to farm incomes, either through higher prices paid by consumers or direct payments to farmers. This represents 75% of the USD 720 billion in positive transfers to agriculture. In contrast, a relatively low proportion of total support (14%: USD 102 billion) is provided in the form of general services, a category that includes public goods and services such as R&D and innovation, inspection services, infrastructure development and maintenance, and public stockholding (discussed previously, in the section on “Food Availability”). Consequently, the current structure of agricultural support does not encourage farmers to diversify their income sources and provides disincentives for them to leave the sector, thereby limiting adjustment pathways beyond agriculture.
Government intervention in agriculture is often justified by the need to improve the incomes of farmers. While support policies may have some success in raising farm household incomes, they often do so at considerable cost to consumers and taxpayers. Policies tend to be poorly targeted: official policy statements are seldom clear about which farm households should qualify for support, and policies often fail to establish explicit eligibility criteria and discriminate between high income and low income farm households (OECD, 2002[27]; de Frahan, Dong and De Blander, 2017[59]). They are also inequitably distributed, with support based on output or factors of production resulting in a greater share of the benefits accruing to large-scale farms. Finally, they result in significant leakages, meaning that a substantial share of support accrues to other unintended beneficiaries (e.g. input suppliers, downstream industries, landowners, programme administration costs).
Evidence suggests that there is a clear inverse relationship between the tendency of a policy to distort markets and its efficiency in transferring income benefits to farmers (Dewbre, Antón and Thompton, 2001[60]). In other words, policies that pay farmers without affecting their production decisions generally result in a greater share of support being retained by the household (while also minimising impacts on production and trade). This result is confirmed by estimates of the income transfer efficiency of support policies for OECD countries, which show that the share of monetary transfers accruing to farmers are just 17% for input subsidies, 23% for market price support, 26% for deficiency payments, and 47% for area payments (OECD, 2003[58]). This is because market price support and other distorting policies stimulate output, and much of the value of the support is paid out to input suppliers or capitalised into land values (especially for area payments, where over 90% of the benefits are absorbed in increased land values). Such policies raise costs for farmers who want to buy or lease land, and slow structural change. In contrast, direct income payments have a far higher income transfer efficiency, as they can be decoupled from agricultural activity and targeted to households that are in need of assistance (e.g. through the imposition of limitations on payment levels) (OECD, 2003[58]).
The vast majority of the world’s farmers are small-scale producers with less than 2 hectares of land, who collectively produce an estimated 30-34% of the global food supply (Ricciardi et al., 2018[61]). Policies to strengthen incomes in the food system will therefore need to focus on improving productivity and connecting small farmers with markets. Increasing investments in public goods such as rural infrastructure, agricultural R&D, technology transfer, extension and advisory services, can help farmers to increase their competitiveness (Brooks, 2012[48]). New technologies can reduce transaction costs and increase efficiencies: digitalisation is facilitating greater financial inclusion, and e-commerce platforms are increasingly linking entrepreneurial producers with national and foreign markets. Standards, labelling and certification schemes aim to create more differentiated products and can sometimes be explicitly designed with the intention of improving farmers’ livelihoods (e.g. Fairtrade certification). Digital technologies also have significant potential to create efficiencies in Sanitary and Phytosanitary systems (SPS), and can enhance trade in agricultural and food products (OECD, 2021[62]).
While policies need to enable farmers to take advantage of the rising opportunities offered by agricultural development, they also need to protect those who are unable to adjust to competitive pressures. Productivity growth puts pressure on the incomes of less competitive farmers, due to declining real prices which are not fully offset by a decline in production costs. Improving agricultural productivity therefore inevitably implies that some less productive farmers that are unable to adjust will need to leave the sector. If less productive farmers have access to viable economic alternatives in non-agricultural sectors, income support may not be necessary and may hamper the transition out of agriculture. If viable alternatives do not exist, then transitional assistance to another economic activity may be more effective than income support (OECD, 2002[27]).
Ultimately, many of the policies required to improve farmers’ incomes are non-agricultural. They include investments in education and healthcare, peace and political stability, sound macroeconomic management, developed institutions, property rights, and governance (Brooks, 2012[48]). Labour market and regional development policies can facilitate the absorption of labour into other sectors, including downstream processing sectors. Social safety nets (e.g. conditional cash transfer programmes) can be an effective means for providing income support whilst ensuring equal treatment between agricultural and non-agricultural households. Income objectives and appropriate indicators should be clearly defined, with comprehensive information on the economic situation of farm households collected to allow for a more accurate assessment and monitoring of income deficiencies (OECD, 2003[58]).
How do agricultural policies affect resource use and the environment?
The food systems underpinning the world’s current food consumption patterns are a major driver of climate change and a significant source of environmental pressures worldwide. Agriculture, forestry and other land use activities contribute an estimated 16-27% of total anthropogenic greenhouse gas (GHG) emissions, including 13% of carbon dioxide (CO2), 44% of methane (CH4), and 81% of nitrous oxide (N2O). Other pre- and post-production segments of global food systems (e.g. energy, transport and industry) account for approximately 5-10% of emissions from human activity (IPCC, 2019[63]).
Direct GHG emissions from agriculture vary across regions and emanate from a variety of sources (Figure 1.23). Two-thirds of direct emissions from agriculture come from livestock, with enteric fermentation16 alone accounting for 40%. Emissions from manure contribute another 26% to direct emissions. Synthetic fertilisers are responsible for 13% of direct emissions from agriculture, and rice cultivation accounts for 10%.
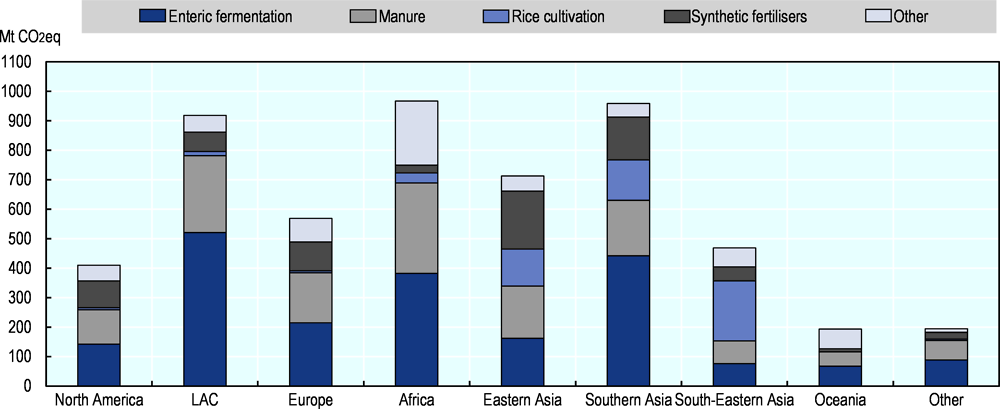
Notes: 2018 or latest available. LAC is Latin America and the Caribbean. Manure includes manure applied to soils, manure left on pasture, and manure management. Other includes the FAOSTAT categories Burning - Crop Residues, Burning - Savanna, Crop Residues, and Cultivation of Organic Soils.
Source: FAO (2021[62]), FAOSTAT database, http://www.fao.org/faostat/en/#home.
In recent decades, growth in agricultural production has put increasing pressure on natural resources. Agriculture currently uses approximately half of the world’s habitable land (IPCC, 2019[63]). Livestock occupies about 78% (40 million km2) of all agricultural land; this includes 35% of global crop production which is devoted to the production of animal feed (Dasgupta, 2021[64]). Irrigated agriculture accounts for an estimated 70% of global freshwater usage (equivalent to 2 797 km3 per year in withdrawals from surface and groundwater resources), and an even higher share of consumptive water use (i.e. water that is not returned to the environment) due to the evapotranspiration of crops (United Nations, 2021[65]). Empirical studies have shown that agricultural expansion is a major cause of deforestation (Busch and Ferretti-Gallon, 2017[66]) Recent estimates suggest that large-scale commercial agriculture (i.e. cattle ranching, soy production and palm oil plantations) accounts for about 40% of tropical and sub-tropical deforestation, while local subsistence agriculture is responsible for a further 33% (Hosonuma et al., 2012[67]; FAO and UNEP, 2020[68]).
Food production is also the world’s most significant driver of terrestrial and marine biodiversity loss. Around 80% of all threatened terrestrial bird and mammal species are in danger of habitat loss due to agricultural expansion (Tilman et al., 2017[69]). The conversion of natural ecosystems for crop production or pasture has been the biggest cause of habitat loss globally, driving an 82% decline in the collective weight of wild mammals since 1970. Farmed animals such as cows and pigs now account for 60% of the global biomass of all mammal species (compared with just 4% for wild mammals), while farmed chickens, ducks and turkeys account for 71% of the global biomass of all bird species (wild birds make up 29%) (Benton et al., 2021[70]). In many regions, soil and pollinator biodiversity have deteriorated considerably due to the over application of chemical fertilisers and pesticides, along with farm practices such as tilling and ploughing (Dasgupta, 2021[64]). Agricultural intensification has also been identified as a leading cause of widespread declines in insect biodiversity, together with climate change (Raven and Wagner, 2021[71]).
Beyond their effects on production and trade, agricultural support policies have significant consequences for the environment and resource use. Support policies can induce negative environmental impacts on the intensive margin (e.g. increased input use, livestock numbers, water use), on the extensive margin (e.g. reallocating land and other inputs between different outputs), or on the entry-exit margin (e.g. expansion or contraction of agricultural land relative to other land uses) (Henderson and Lankoski, 2019[72]).
Market price support, payments based on commodity output and payments based on unconstrained variable input use are among the potentially most environmentally harmful support policies (Henderson and Lankoski, 2019[72]; Henderson and Lankoski, 2020[73]; OECD, 2020[74]; DeBoe, 2020[75]). Such policies are coupled to farmers’ production decisions and cannot be easily targeted, thus providing incentives for the intensification of input use, the allocation of land for supported crops, and the entry of land to the agricultural sector. Studies have shown their negative impacts on water quality and direct agricultural GHG emissions, and they may negatively influence biodiversity by promoting less diverse agricultural systems (DeBoe, 2020[75]; Lankoski and Thiem, 2020[76]). At the global level, however, the widespread adoption of these policies may constrain emissions by lowering production as a result of resource inefficiencies (Laborde et al., 2021[77]).
Payments based on variable inputs without appropriate constraints can encourage the excessive use of fertilisers, herbicides and pesticides. Over application of fertilisers and animal manure leads to substantial nutrient surpluses and nitrogen and phosphorus run-off. Nitrogen pollution causes severe damage to freshwater ecosystems, harming invertebrates and fish, causing acidification and eutrophication, stimulating the growth of toxic algae and lowering oxygen levels in water (hypoxia). Excessive or inadequate pesticide use has been associated with declines in populations of birds, insects, amphibians and aquatic and soil communities, as well as negative impacts on human health (Guerrero, 2018[78]; Sud, 2020[79]).
In most countries, support based on input use is provided without constraints to protect against the over application of variable inputs. India has the largest rate of support based on inputs, primarily allocated to electricity price subsidies for groundwater pumping and irrigation, and fertiliser subsidies. These measures were worth 7.2% of gross farm receipts in 2018-20 (Figure 1.24). Kazakhstan and Iceland provide support based on inputs amounting to 6.4% and 6.1% (respectively) of gross farm receipts, although in Iceland most support based on input use is directed to fixed capital formation (i.e. on-farm investments), which are potentially less environmentally damaging than general fertiliser subsidies. The optimal policy mix for support that encourages the use of environmentally harmful inputs would be to impose a tax to account for the damage they cause to waterways and natural ecosystems (Anderson and Valenzuela, 2021[24]).
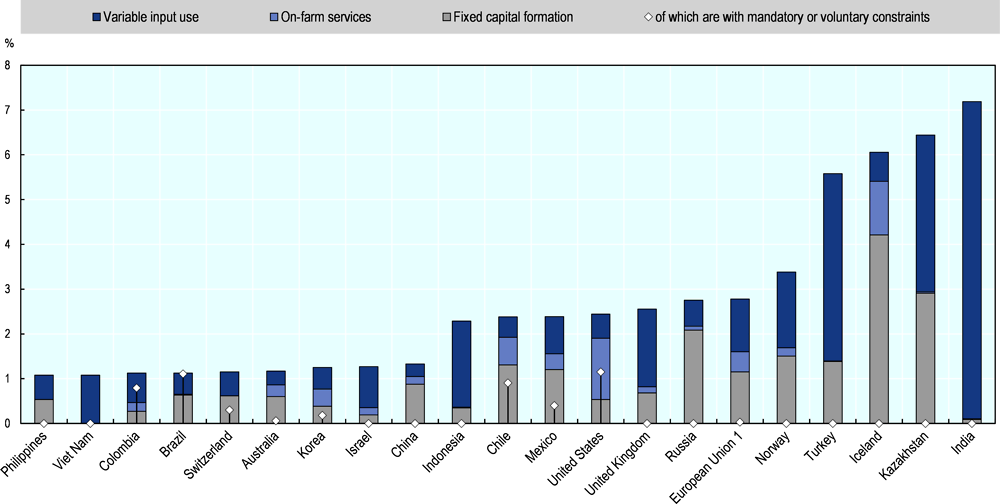
Notes: Figure presents countries having share of payments based on input use above 1% for 2018-20 period. Countries are ranked according to the total share of payments for 2018-20.
1. EU15 for 2000-02, EU28 for 2018-19 and EU27 plus UK for 2020.
Source: OECD (2021), “Producer and Consumer Support Estimates”, OECD Agriculture statistics (database), https://doi.org/10.1787/agr-pcse-data-en.
Well-designed environmental policies and regulations can play an essential role in containing some of the adverse environmental impacts of input use. Policy makers have a range of instruments at their disposal, including regulatory procedures for pesticide use, targets for reducing nitrogen and phosphorus discharges, fertiliser accounting systems, nitrogen quota systems, bans on manure application on bare fields, fertiliser taxes for non-agricultural uses, taxes on phosphorus content in feed, as well as agri-environmental schemes and advisory services (OECD, 2021[35]). Water pricing or market mechanisms related to the scarcity of water can help to encourage more efficient water use and prevent the depletion of surface and groundwater resources. However, irrigation prices typically do not reflect the full cost of water use, and many countries only partially recover the operational, maintenance and capital costs associated with water use (Gruère, Shigemitsu and Crawford, 2020[11]). Governments of OECD countries have undertaken a number of policy changes related to water in agriculture since 2009, increasing their alignment with OECD recommendations in this area (Box 1.4).
Agriculture is facing growing water risks including intensified droughts and floods due to climate change, and growing competition for water from energy, industry and expanding cities. Meanwhile, agriculture also generates negative environmental impacts on water resources. It remains the largest user of water, accounting for about 70% of total global freshwater demand, and agricultural water pollution by nitrates, phosphorus, and pesticides is a growing concern in most countries.
Given these conditions, managing water for irrigation, bolstering resilience to agricultural water risks, and reducing agricultural pollution are recognised objectives shared by OECD and G20 countries. A 2020 OECD study surveying governments’ actions on agriculture and water from 2009 to 2019,1, 2 found a wide diversity of policy changes taking place in the management of water quantity, water quality, and water risks in agriculture. Some countries undertook important water policy reforms, whereas others mainly improved existing policies. The study also showed that these changes were on average relatively aligned with the OECD guidance on water policy and governance defined by the 2016 OECD Council Recommendation on Water (Figure 1.25).
To progress further, relatively water abundant countries should pay attention to their approaches to managing water quantity and risks under climate change; all countries should consider improving their policies to reduce pollution from agriculture; and selected countries should consider making additional efforts to recover water charges and to use pricing instruments, in line with the 2016 OECD Council Recommendation on Water.
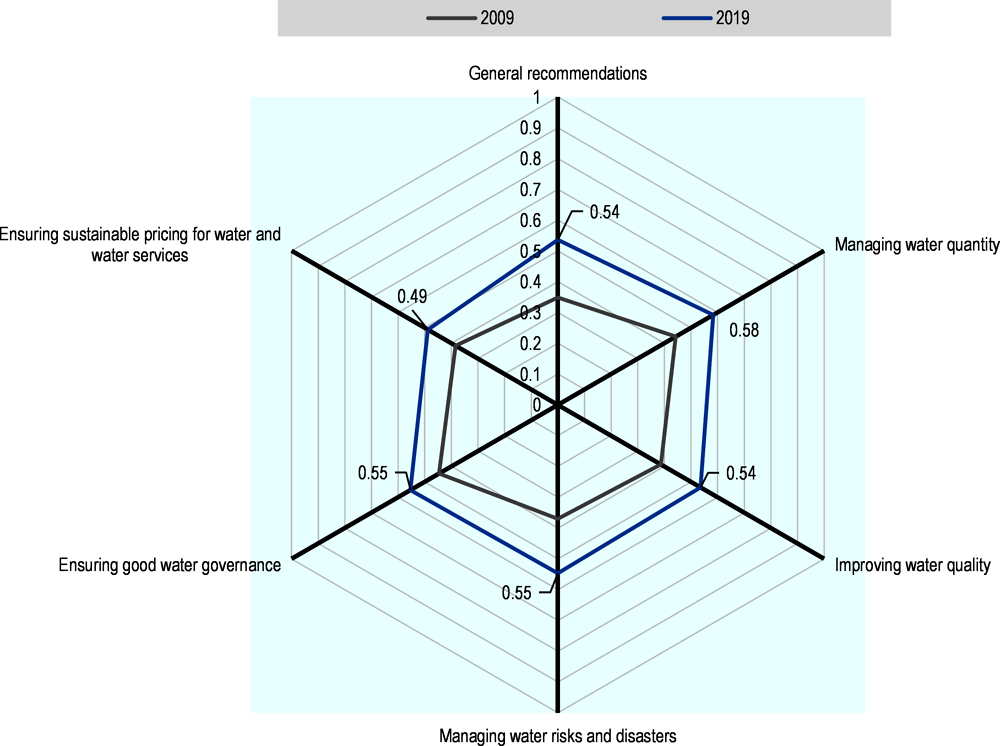
Note: Higher indices -further from the centre- indicate increased alignment with the OECD Council Recommendation; 0 indicates no alignment, 1 perfect alignment. Categories represent the relevant chapters of the Recommendation. Pricing indices of alignments were adjusted to account for text caveats in the Recommendation and should be subject to cautious interpretation.
Source: (Gruère, Shigemitsu and Crawford, 2020[11]).
← 1. The survey was conducted on 38 countries including: OECD countries (Australia, Austria, Belgium (the Flanders region only), Canada, Chile, Czech Republic, Denmark, Estonia, Finland, France, Germany, Greece, Hungary, Iceland, Ireland, Israel, Italy, Japan, Korea, Latvia, Lithuania, Mexico, Netherlands, New Zealand, Norway, Poland, Portugal, Slovak Republic, Slovenia, Spain, Sweden, Switzerland, Turkey, United Kingdom, United States), OECD accession countries (Colombia and Costa Rica), pending adherents to the OECD Council Recommendation on Water (Cabo Verde) and the European Union.
← 2. Survey responses were converted into quantitative indices of alignment of policy changes with OECD recommendations.
Payments based on current land area create incentives to expand cropping areas and maintain marginal lands in production. Non-uniform crop area payments may have mixed environmental impacts, depending on whether less or more emission intensive crops are favoured with non-uniform payment rates. If crop area payments favour arable farming over livestock production, they may induce a shift away from livestock and a reduction in agricultural GHG emissions and nutrient surpluses. Conversely, area payments may increase GHG emissions in countries where crops account for the dominant share of agricultural GHG emissions (Henderson and Lankoski, 2019[72]). Payments based on animal numbers without constraints will generally result in increased livestock numbers, which can be achieved either through increased stocking densities or increased area, and in either case are likely to cause negative environmental effects (DeBoe, 2020[75]).
Fully decoupled payments based on non-current crop area (e.g. payments based on historical entitlements or overall farming income) are among the least environmentally harmful support policies (Henderson and Lankoski, 2019[72]). These measures allow farmers to follow market signals in their production decisions, and in some cases, production is not required for farmers to receive support payments. If historical acreage is fixed for payments, then there is no incentive to bring additional land into the sector (Lankoski and Thiem, 2020[76]). However, payments based on historical entitlements could still affect incentives, if farmers expect their current decisions to influence future payments (DeBoe et al., 2020[80]). Moreover, by supplementing farmer incomes and making agriculture more profitable relative to other land uses, decoupled payments could still stifle structural change and hinder the conversion of agricultural land to more sustainable land uses. Ultimately, the environmental impact of decoupled payments depends on the type and effectiveness of mandatory environmental conditions and requirements (cross compliance) that accompany payments (DeBoe, 2020[75]).
Reorienting agricultural support towards decoupled payments and away from the most production distorting forms of support could reduce environmental pressures and substantially strengthen the sustainability of production. At the same time, it is important to recognise that agricultural policies can shape the structure and intensity of production over the long term. Decoupling is therefore unlikely to be sufficient on its own, particularly in countries with a high livestock density and intensive production systems (OECD, 2020[74]; Lankoski and Thiem, 2020[76]). In such cases, additional measures may be needed to ensure that policies and market prices reflect the negative environmental externalities associated with agricultural production.
Agricultural policies can also be specifically designed to generate positive environmental outcomes, by encouraging farmers to provide environmental goods and services such as carbon sequestration, preservation of rural landscapes, resilience to natural disasters, pollination, habitat provision, and control of invasive species. Agri-environmental payments that encourage the use of environmentally friendly inputs or practices (e.g. compliance with fertiliser use restrictions) are potentially among the most environmentally beneficial types of support measures (DeBoe, 2020[75]). However, just USD 1.5 billion of the USD 268 billion per year of budgetary payments to producers in 2018-20 was linked clearly to the provision of environmental public goods (i.e. payments based on specific non-commodity outputs).
Some policies, such as support based on non-commodity output, can occasionally have positive environmental effects. For example, land retirement policies can create incentives for farmers to switch from crop production to permanent pasture or forests, encouraging a contraction of agricultural land and reducing environmental pressures. However, if not managed well, a contraction of agricultural land resulting from land abandonment can in some instances lead to negative environmental outcomes such as biodiversity loss, increases in invasive species, or a greater risk of wildfire (DeBoe et al., 2020[80]). While reductions in agricultural land use often have beneficial environmental effects, they can also be accompanied by the intensification of production on remaining land areas, potentially resulting in unintended negative environmental impacts.
This underscores the importance of carefully managing the reform process to account for potential unintended environmental consequences. For example, reductions in market price support can also result in land abandonment and further intensification of production, with potential negative consequences for biodiversity and landscape ecology. Agri-environmental payments can create adverse environmental impacts in mixed dairy and crop production systems, particularly if they favour crop production and encourage land use changes from pasture to cereals (Henderson and Lankoski, 2019[72]). Policy makers should therefore take a proactive approach to managing the process of policy reform and subsequent land use transitions. Furthermore, agri-environmental schemes could benefit from improvements in their design and in the design of mandatory constraints to better deliver environmental improvements (DeBoe, 2020[75]). OECD work with national-level collaborators seeks to exploit such potential benefits.
Are agricultural support policies improving the productivity, sustainability and resilience of the sector?
The world faces a daunting “triple challenge” of providing safe and nutritious food for all, improving incomes and livelihoods along the food supply chain, and contributing to environmental sustainability. Meeting this challenge will require effective responses and co-ordination across many areas of public policy. With respect to the agro-food sector, simultaneous progress in achieving sustainable productivity growth and improved resilience will be essential for the sector to contribute effectively to each dimension of the triple challenge. The OECD Agro-Food Productivity-Sustainability-Resilience Policy Framework provides a structured tool for identifying policy priorities that strengthen long-term productivity, enhance environmental performance, and increase resilience. The Framework highlights the importance of developing coherent and integrated policy approaches that encompass the wider enabling policy environment for food systems. Governments should seek to establish synergies across the objectives of productivity, sustainability and resilience, while managing trade-offs and avoiding contradictory policy signals.
With the global population projected to reach 10 billion by 2050, food systems are facing growing pressure to use resources sustainably, protect ecosystems, preserve biodiversity, and reduce greenhouse gas emissions. Strengthening productivity and sustainability is therefore fundamental to enable food systems to produce more with the use of less inputs and natural resources. At the same time, vulnerabilities to climate change highlight the need to build resilience to natural disasters and strengthen capacities to respond to an evolving risk environment.
Figure 1.26 shows that the drivers of agricultural output growth have shifted dramatically over time, with important consequences for resource use and environmental sustainability. Historically, most of the growth in food production came from increases in the total area of agricultural land used for crop and animal production. After 1960, however, more intensive use of inputs (e.g. synthetic fertilisers, pesticides, labour and machinery) became the most important driver of output growth. This trend persisted until the 1990s, when improvements in total factor productivity (i.e. efficiency improvements such as better farm management practices, improvements in crop varieties and breeds) took over as the most important factor contributing to global agricultural production.
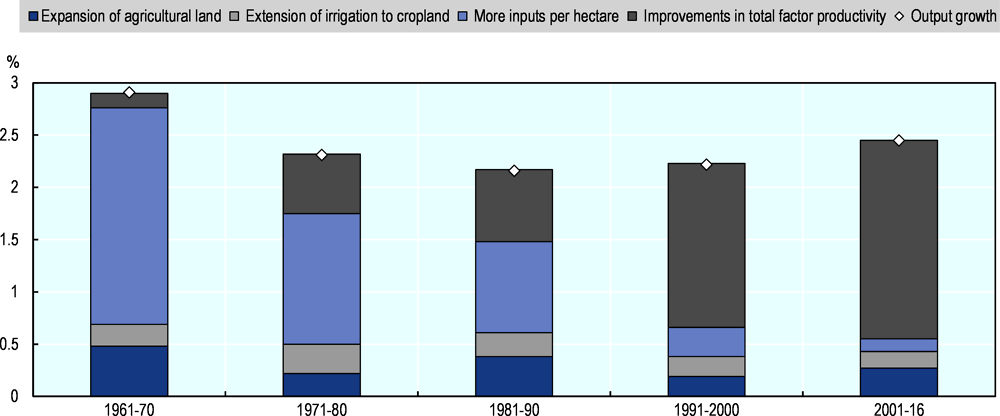
Total factor productivity growth has driven a “decoupling” of food production and land use, enabling global food production to increase four-fold since 1960, while agricultural land use has grown by just 10% (see the section on Food availability). Land use changes from agriculture are still a major concern, driving deforestation, declines in biodiversity, GHG emissions, and the depletion of soil organic carbon (IPCC, 2019[63]). Nonetheless, productivity growth has been indispensable in enabling agriculture to feed the world, while preventing worse and potentially catastrophic outcomes for environmental sustainability.
There are important synergies to be realised in policies to promote productivity, sustainability and resilience. For example, improvements in technology and farm management practices have facilitated a decline in the emissions intensity of agriculture (i.e. emissions per unit of output) across most regions. Direct emissions from agriculture grew by approximately 0.5% per year between 1990 and 2016, while crop production grew by an estimated 2.5% per year and livestock production grew by about 1.9% per year over the same period (OECD, 2021[35]). This has primarily been achieved through more efficient use of inputs, such as fertilisers, animal feed and land, which are significant sources of emissions.
Efficiency gains have also allowed many countries to reduce their use of synthetic nitrogen fertilisers and pesticides, while steadily expanding agricultural production. Advances in genomic science and precision agriculture can strengthen sustainable productivity by allowing for a more judicious application of environmentally harmful inputs. Globally, some 45% of nitrogen added to fields is not taken up by crops, implying that there is considerable scope to decrease emissions and reduce nutrient surpluses without compromising productivity and food security (Blandford and Hassapoyannes, 2018[81]). Pesticide use can often be decreased without affecting the productivity and profitability of farms, resulting in reduced health and environmental risks (Lechenet et al., 2017[82]). Similarly, evidence suggests that with more sanitary farming practices, the use of antibiotics on animal farms for growth-promoting purposes can be eliminated with little or no adverse impact on the economic or technical performance of farms (Ryan, 2019[83]).
A comprehensive approach to resilience and risk management can contribute to productivity and sustainability by enhancing the long-term stability of food systems. Resilience implies strengthening the agricultural sector’s capacity to prepare and plan for adverse events, absorb the impacts of negative shocks, adapt in response to an evolving risk environment, and transform if current processes and systems are no longer sustainable (OECD, 2020[52]). Developing a diverse portfolio of risk management instruments is necessary to tackle food security risks, and can strengthen farmers’ capacities to innovate and adapt to climate change (OECD, 2013[19]). Public funding for R&D can support the development of new innovations such as drought-resistant seeds and water management technologies, which allow farmers to manage risks more effectively and maintain more sustainable production practices (OECD, 2019[31]). Box 1.5 outlines the principles for effective disaster risk management for resilience.
In 2017, G7 Agriculture Ministers in Bergamo recognised the effects of natural hazards on farmers’ lives, agro-food systems, agricultural production and productivity in regions all over the world, and that climate change is projected to amplify many of these impacts. Ministers also noted the importance of strengthening the resilience of farmers to natural hazards (G7 Agriculture Ministers, 2017[84]).
Responding to this imperative, the joint OECD-FAO project on Building agricultural resilience to natural disasters identifies good practices for building agricultural resilience at each stage of the disaster risk management (DRM) cycle. Good practices in the case study countries are identified according to principles and recommendations from key international frameworks for managing the risks posed by disasters and other critical shocks, including OECD recommendations and the Sendai Framework.1 Based on these frameworks, each case study assesses their country-specific situation according to the following four Principles for Effective DRM for Resilience:
1. An inclusive, holistic and all-hazards approach to natural disaster risk governance for resilience.
2. A shared understanding of natural disaster risk based on the identification, assessment and communication of risk, vulnerability and resilience capacities.
4. An approach emphasising preparedness and planning for effective crisis management, disaster response, and to “build back better”2 to increase resilience to future natural hazards.
Good practices encompass policy measures and governance arrangements that encourage public and private stakeholders to address gaps in their resilience levels. This can be done by helping stakeholders understand the risks that they face from natural hazards and their responsibilities for managing the risks they pose to their assets. For example, while rarer catastrophic risks such as natural hazard-induced disasters (NHID) may require public intervention, on-farm strategies and the individual farmer’s overall capacity to manage risk also play a critical role in reducing risk exposure to catastrophic events, particularly over the long term (OECD, 2009[85]; OECD, 2020[52]). Specifically, good practices that build agricultural resilience to natural hazards are policies and governance arrangements that:
Encourage public and private actors to consider the risk landscape over the long term, including to take into account the potential future effects of climate change on the agricultural sector, and to place a greater emphasis on what can be done ex ante to reduce risk exposure and increase preparedness.
Provide incentives and support the capacity of farmers to prevent, mitigate, prepare and plan for, absorb, respond, recover from, and more successfully adapt and transform in response to natural hazards.
Consider a wide range of future scenarios, including expected environmental, economic and social structural change, and contribute to agricultural productivity and sustainability, even in the absence of a shock or stress.
Take into account the trade-offs inherent in natural disaster risk management, including between measures to build the capacities of the sector to absorb, adapt, or transform in response to natural disaster risk, and between investing in risk prevention and mitigation ex ante and providing ex post disaster assistance.
Are developed with the participation of a wide range of actors, to ensure that all relevant stakeholders are equally involved in the design, planning, implementation, monitoring and evaluation of interventions; and share a common understanding of the risk landscape and their respective responsibilities for managing natural disaster risk.
← 1. OECD’s Approach to Risk Management for Resilience (OECD, 2009[85]); (OECD, 2011[86]); (OECD, 2020[52]); the Sendai Framework for Disaster Risk Reduction (UNISDR, 2015[87]); the OECD Recommendation on the Governance of Critical Risks (OECD, 2014[88]); and the Joint Framework for Strengthening resilience for food security and nutrition of the Rome-based Agencies (FAO, IFAD and WFP, 2019[89]).
← 2. Building back better is defined as using the recovery, rehabilitation and reconstruction phases after a disaster to increase the resilience of nations and communities through integrating disaster risk reduction measures into the restoration of physical infrastructure and societal systems, and into the revitalisation of livelihoods, economies and the environment.
Potential trade-offs between policies to promote productivity, sustainability and resilience also deserve special attention. For example, improvements in total factor productivity often lead to lower prices and increased food demand. In some cases, this may trigger an expansion of production, resulting in higher GHG emissions (Blandford and Hassapoyannes, 2018[81]). Productivity-driven increases in production have also been associated with large-scale reductions in biodiversity on farms, with fewer varieties and breeds of plants and animals being cultivated. This loss in genetic diversity undermines the resilience of food systems to pests, pathogens and climate-related shocks (IPBES, 2019[90]). Measures to strengthen resilience by building redundancies into supply chains may involve some trade-offs with productivity performance (at least in the short-term).
Efforts to strengthen total factor productivity in livestock production (e.g. through advances in herd genetics, feed and pasture quality, farm and animal management) have translated into declining emissions intensities over time. However, enteric fermentation from ruminant livestock production remains the leading source of direct emissions from agriculture worldwide, with beef having the largest emissions footprint by a wide margin (in terms of CO2eq per 100 g of protein produced) (Blandford and Hassapoyannes, 2018[81]). Generally, countries with a high livestock density (per hectare) have high nitrogen and phosphorus surpluses and high GHG emissions from agriculture, thus making it difficult to achieve sustainable productivity (Lankoski and Thiem, 2020[76]).
Policy choices to reduce GHG emissions from agriculture also invoke trade-offs. Emission taxes can significantly reduce emissions by reallocating production towards less emission-intensive commodities, but may raise production costs and increase food prices. They could also induce carbon leakage if applied unilaterally by specific countries. Abatement subsidies used to reward carbon sequestration require government expenditures, and are half as effective in mitigating GHG emissions, but have a much lower impact on agricultural production and per capita food consumption, and would eliminate potential carbon leakage. A shift to lower emission diets by consumers is assessed to have a much smaller impact on reducing agricultural emissions than any emission tax (Henderson et al., 2021[91]; OECD, 2019[92]).
Countries have attempted to pursue productivity growth in agriculture while improving environmental sustainability, with varying degrees of success. Some have been relatively successful in exploiting synergies and simultaneously strengthening their productivity and sustainability performance. Others have had to manage trade-offs, achieving improvements in one area at the expense of another. In some instances, countries have witnessed declines across both areas of productivity and sustainability.
Figure 1.27 and Figure 1.28 provide insights on productivity-sustainability linkages, by benchmarking total factor productivity (TFP) growth and environmental performance across countries. Environmental performance can be measured using a variety of metrics such as GHG emissions, nutrient balances, resource use and biodiversity. To measure sustainability across a wide range of countries, an index was constructed using two OECD agri-environmental indicators: GHG emissions per hectare of agricultural land (a proxy for impacts on climate change), and Nitrogen surplus (NS) in kg/ha (a proxy for impacts on air and water quality). These metrics are by no means exhaustive and cannot capture all of the environmental impacts arising from agricultural production. However, they are consistently available for 48 out of the 54 countries covered in this report, and are thus useful for international benchmarking.
The Strong Environmental Index measures the relative development of each country’s worst performing environmental indicator. Measuring sustainability using the worst performing indicator does not allow for substitution between the different environmental outcomes, meaning that poor performance in one indicator cannot be compensated for by better performance in another. Each indicator is standardised1 to allow for comparisons across measures, and converted such that higher values indicate better performance. The relative environmental performance of each country can then be compared to its growth in total factor productivity.
Figure 1.27 plots TFP growth against the Strong Environmental Index growth for the period from 1997 to 2006. The median for OECD countries was used as a base for standardisation, meaning that countries located above (below) the x-axis and to the right (left) of the y-axis performed above (below) the OECD median. Furthermore, the dashed line is a 45-degree line, indicating the threshold where an increase (decrease) in productivity growth is matched by an equivalent decrease (increase) in environmental performance. This allows for three categories of sustainable productivity performance to be distinguished:
Countries in the upper-right quadrant achieved strong sustainable productivity growth: they were able to improve their performance by more than the OECD median across each of the three indicators (GHG, NS and TFP).
Countries located above the dashed line (but not in the upper-right quadrant) achieved semi-strong sustainable productivity growth, meaning that their productivity growth was sufficiently high to compensate for a decline in environmental performance (or vice-versa).
Countries located below the dashed line either experienced declines in both dimensions (lower-left quadrant), or their improvement in productivity (sustainability) was offset by a relatively larger decline in sustainability (productivity).
A comparison of Figure 1.27 and Figure 1.28 reveals that the number of countries achieving strong sustainable productivity growth has declined in the most recent decade. From 2007 to 2016, only five countries achieved strong sustainable productivity growth (improvements in all environmental indicators and TFP growth relative to the OECD median), whereas from 1997 to 2006, that was the case for 13 countries. With the exception of the United States, countries that have achieved strong sustainable productivity growth during 2007-16 are small countries that have limited contributions to total agricultural GHG emissions (Belgium, Denmark, Lithuania and Croatia). Some of the most important countries in terms of their contributions to total agricultural GHG emissions (China, India and Brazil) have not made progress in achieving strong sustainable productivity growth. Figure 1.28 also shows that there was more heterogeneity in productivity growth across countries between 2007 and 2016, when compared with the previous decade.
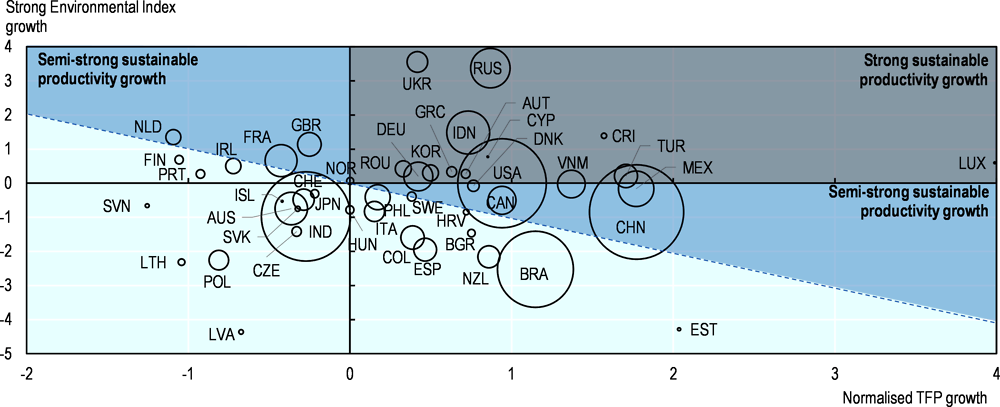
Notes: The strong environmental index is the minimum of the standardised growth rates of GHG emissions intensity per hectare of agricultural land area and Nitrogen surplus for the years 1997-2006. Positive values imply better environmental growth outcomes relative to the OECD median. The size of the bubbles represents the country’s total agricultural GHG emissions in 2005. The countries used in the normalisation include all OECD countries, except for Chile and Israel.
Due to data limitations, some countries covered by the present report are not included in this analysis.
Sources: Authors’ calculations based on USDA, Economic Research Service (2019), International Agricultural Productivity (database), for agricultural TFP growth; and OECD (2021), OECD Agri-Environmental Indicators (database) for GHG emissions intensity and Nitrogen surpluses (measured in kilogrammes per hectare).
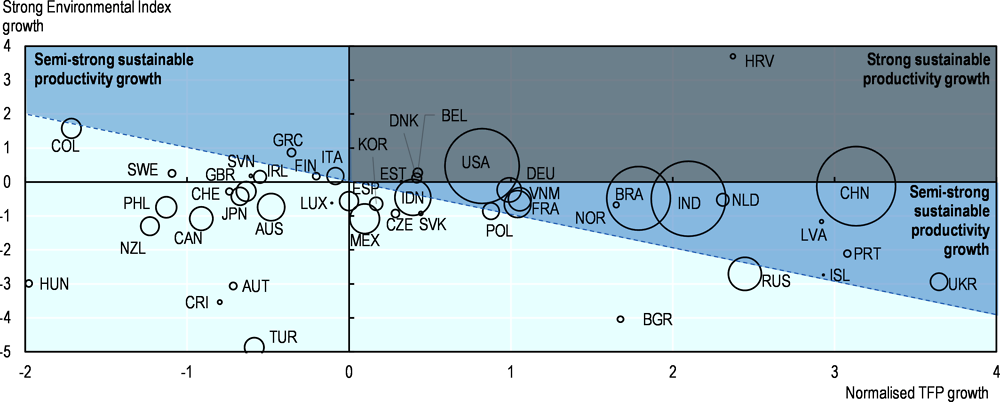
Notes: The strong environmental index is the minimum of the standardised growth rates of GHG emissions intensity per hectare of agricultural land area and Nitrogen surplus for the years 2007-16. Positive values imply better environmental growth outcomes relative to the OECD median. The size of the bubbles represents the country’s total agricultural GHG emissions in 2005. The countries used in the normalisation include all OECD countries, except for Chile and Israel. Due to data limitations, some countries covered by the present report are not included in this analysis.
Sources: Authors’ calculations based on USDA, Economic Research Service (2019), International Agricultural Productivity (database), for agricultural TFP growth; and OECD (2021), OECD Agri-Environmental Indicators (database) for GHG emissions intensity and Nitrogen surpluses (measured in kilogrammes per hectare).
← 1. The modified z-score for each country c and indicator i is calculated according to the following equation: =
where is the value of the indicator for country , is the median of the indicator across the subset of J OECD countries, = median(|- |) is the median absolute deviation. The MAD is multiplied by a constant 1.486 to approximate the standard deviation.
Source: (Lankoski and Thiem, 2020[76]); (OECD, 2020[74]); (OECD, 2021[93]).
Agricultural policy changes in 2020 were dominated by responses to the COVID-19 pandemic
Governments responded swiftly to the COVID-19 pandemic, with measures that were required to keep food and agriculture markets functioning, and that were mostly co-operative at the international level. As a result, most shocks were absorbed rapidly, with trade and markets recovering during the year. Average gross farm receipts for OECD and emerging economies actually increased in 2020, and in several large countries the sector was the best performing or least affected economically. That said, income shocks have affected the food security of many poorer consumers. Moreover, the virus remains active in many countries.
An estimated 776 unique policy response measures were adopted by governments of countries covered in this report, covering all categories of measures, highlighting the breadth and responsiveness of public actions to address the impact of the crisis. While 19% of these measures were urgent responses to ensure supply and keep the sector functioning, just under 70% of measures took the form of temporary relief, and should be phased out as the crisis recedes. Ten per cent of measures are “no regrets”, in the sense that they improve market functioning and thereby contribute to improved resilience. These measures, such as trade facilitation, should be maintained or even scaled up after the crisis. The remaining 2% of measures did not fit this classification. At the same time, 11% of measures, mostly introduced as temporary relief, were identified as potentially market distorting or environmentally harmful. In particular, these included export bans, other trade restrictions, and regulatory flexibilities. Some of these were applied temporarily, and the remainder need to be rescinded.
A first and partial assessment of budgetary expenditures in response to the COVID-19 crisis suggests that a minimum of USD 157 billion was earmarked in funding or offered in financing means (subsidised loans or credit) to the sector. Close to half of this amount (USD 75 billion) was allocated to support for agriculture and food sector actors, and a further USD 55 billion to food assistance programmes, with the remaining USD 27 billion directed towards general services or labour and biosecurity measures. These amounts do not include the share of economy-wide recovery packages adopted in these countries (which exceeds USD 5.6 trillion) from which the agriculture sector may have benefited.
OECD countries favoured relief measures for the agro-food sector and food assistance, largely via earmarked funds, while emerging economies used more non-support measures and allocated relatively more loans and credits towards the agriculture and food sector. While extensive contingencies were made for the agricultural sector, the fact that overall economic effects were in many cases less serious than those faced in other sectors means that actual financial disbursements may turn out to be substantially lower than allocations.
Although the COVID-19 pandemic dominated policy responses, a number of other policy reforms or initiatives were introduced in 2020. In addition to revised agricultural policy frameworks, and changes or reforms to existing support measures and policies, two important developments relate to strengthened agri-environmental policies and the continued trend of new bilateral or regional free trade agreements. New steps aimed at enhancing the environmental performance of agriculture and food systems include the European Union’s Green Deal together with the Farm to Fork and Biodiversity Strategies, the Carbon Neutral Strategy, New Zealand’s 2019 Zero Carbon Act and complementing strategies in 2020, Canada’s A Healthy Environment and A Healthy Economy plan, Japan’s Green Growth Strategy, and new strategies on reducing agricultural GHG emissions in several other countries. A number of initiatives also focused on making water management systems more sustainable, and on tackling food loss and waste.
On the trade side, the existing trend towards bilateral and regional trade agreements continued in 2020. With the Regional Comprehensive Economic Partnership, the world’s largest Free Trade Agreement was signed in 2020, including the ten members of the Association of South-East Asian Nations and five other countries in Asia-Pacific. Smaller trade agreements also continued to be put in place, including a number of agreements signed by the United Kingdom to ensure continued trade relations after the country’s departure from the European Union.
Reforms to agricultural policies have stalled
In 2018-20, agricultural support policies across the 54 countries covered in this report generated USD 720 billion per year in transfers to agriculture, which in nominal terms is more than twice the aggregate level of transfers observed in 2000-02, but nevertheless lower when expressed relative to agricultural value added. About three-quarters of this support, USD 540 billion, was directed to individual producers, either in the form of higher prices or through direct payments.
Reforms in OECD countries have stalled in the past ten years, with little change in the level or composition of support. Indeed, some countries have rolled back earlier reform efforts. Across the 54 countries, two-thirds of support is still provided in ways that are potentially most market and trade distorting, likely to harm the environment including by raising GHG emissions. This is reflected in a weakened sectoral performance in terms of delivering sustainable productivity growth.
Overall, total net support to the sector (TSE) costs the economy 0.8% of combined GDP across the 54 countries, down from 1.0% at the beginning of the century. When measured relative to the size of the agricultural sector, total net support amounted to 23% of agricultural value added in 2018-20, compared with 35% in 2000-02.
Producer support as a share of gross farm receipts (%PSE) has been declining over the past two decades, from 18% in 2000-02 to 11% in 2018-20. While producer support in OECD countries declined from 28% of gross farm receipts (GFR) in 2000-02 to 18% in 2018-20, it almost doubled in emerging economies from 3.8% in 2000-02 to 7.4% in 2018-20. To some extent, the decline in the overall average %PSE also reflects higher levels of negative market price support in some emerging economies.
A central element of many countries’ support policies continues to be market price support. Total positive price support amounted to USD 272 billion per year in 2018-20, corresponding to 7% of the combined GFR. In contrast, a small number of countries implicitly taxed their farmers by suppressing domestic prices of some or all commodities, for instance through export restrictions. This resulted in a transfer of USD 104 billion per year away from producers.
Of payments to farmers, USD 66 billion was linked to output or unconstrained input use, and has a similar tendency to create distortions as market price support. Added to the positive price transfer, this gives a total of USD 338 billion of potentially most distorting support to producers. A larger amount, USD 202 billion, was more decoupled from production decisions. Of this, only a small element, USD 1.5 billion, was conditional on the provision of clearly identified public goods, such as ecosystem services.
Payments to agriculture as a whole, “general services” (GSSE), amounted to USD 102 billion, or 14% of total net support. This category includes investments in public goods, such as R&D and innovation, off-farm infrastructure and biosecurity (USD 76 billion). It also includes payments with a potential to distort markets, in the form of marketing and promotion and support for public stockholding (USD 42 billion).
Subsidies for consumers (such as food assistance programmes) amounted to USD 78 billion per year, or 11% of all positive transfers to agriculture. Nonetheless, on average consumers were taxed by agricultural policies, as these subsidies remained small relative to the higher food expenditures, due to the persistent market price support in many countries.
The variation in support levels across countries remains significant, however. Levels of producer support in 2018-20 ranged from less than 3% of GFR in New Zealand, Brazil, Ukraine, Australia and Chile to between 40% and 60% in Japan, Korea, Switzerland, Norway and Iceland, while net producer support was negative in Argentina, Viet Nam and India. High levels of producer support continue to be underpinned by a strong focus on market price support, but the importance of budgetary payments to producers varies strongly as well. Iceland, Norway, India, Turkey and Kazakhstan directed most-distorting output and input support to their producers at rates of between 4% and 12% of GFR in 2018-20, while less distorting payments worth more than 10% of GFR were provided in the European Union and the United Kingdom, as well as in Iceland, Switzerland and Norway.
Overall, most current support policies are not serving the wider needs of food systems
Across the dimensions of the triple challenge – ensuring food security and nutrition for all, providing livelihoods to farmers and others along the food chain, and using natural resources sustainably while reducing greenhouse gas emissions – food systems are sometimes accused of “systems failure”. Such an assessment overlooks important achievements, not least that of feeding a world population that has grown from 3 billion in 1960 to about 7.5 billion today, predominantly through improved yields and productivity rather than increased agricultural area. Even so, policies have not managed to address rapid structural change across food systems and the problems these changes have induced, be they a rising incidence of obesity, continued adjustment pressures on farmers, or mounting resource pressures and GHG emissions.
The USD 272 billion of positive market price intervention and USD 104 billion of implicit taxation both have negative implications for food security at the global level, because they impede the efficient allocation of domestic resources and weaken the balancing role of trade in getting food from surplus to deficit regions. By constraining trade, they also contribute to increased price volatility on international food markets.
The USD 338 billion of potentially most distorting support, comprising market price support and payments linked to output or the unconstrained use of inputs, is inefficient at transferring income to farmers, as a large share of the benefits are capitalised into land values or leak in the form of higher prices for inputs. It also tends to be inequitable, to the extent that support is linked directly to production. Finally, through its direct incentive to increase production, it contributes to increased resource pressures, including through impacts on water quality, biodiversity, and can raise GHG emissions. At the global level, however, the widespread adoption of such policies may constrain emissions by lowering production as a result of resource inefficiencies.
The USD 202 billion of producer support that is decoupled from production decisions creates fewer distortions at the margin and therefore has less adverse impacts on global food security. It also has a reduced tendency to contribute to additional resource pressures and GHG emissions. While the effects on farmers’ incomes may still be inequitably distributed, there tend to be lower rates of leakage to non-farm landowners or input suppliers.
Two important rationales for farm support are to provide social transfers in order to redress problems of low incomes, and to support the provision of environmental public goods. However, little of the budgetary support that is extended to producers is based on an assessment of their overall income from all sources, while just USD 1.5 billion of the USD 268 billion of budgetary payments to producers was linked clearly to the provision of environmental public goods.
Instruments with potentially more positive effects on food security, incomes and resource use mostly fall within the category of general services for the sector (GSSE), and include investments in R&D, biosecurity and infrastructure. However the USD 102 billion of expenditure in this category represented just 16.5% of total net support (TSE) in 2018-20, a slight decline from the 17.2% estimated for 2000-02. Across the OECD, this share was even lower at 13.5% in the most recent period. Relative to the size of the agricultural sector, support to general services declined even more strongly, from 6% of agricultural value added in 2000-02 to 3.8% in 2018-20. Despite evidence of high returns, spending on agricultural knowledge and innovation systems was just USD 26 billion per year (1.0% of agricultural value added), while spending on the development and maintenance of infrastructure for the sector amounted to USD 42 billion per year (1.5% of agricultural value added).
Agricultural policies should focus on promoting sustainable productivity growth and improved sectoral resilience
The foremost ways in which agricultural policies can contribute to improved food systems performance are through sustainable productivity growth and system-wide resilience. The former is necessary to reconcile the objective of ensuring food security (i.e. availability and access at affordable prices) with resource constraints. It also contributes to income generation, albeit while imposing a burden on those producers who do not participate in productivity gains (and which may require flanking policies). The latter will be required to confront new sources of risk caused by a changing climate, unanticipated changes in policy, or the economy-wide effects of shocks external to the agricultural sector, such as the global COVID-19 pandemic.
As policy reforms have stalled, progress in achieving sustainable productivity growth has also deteriorated. For the 48 countries for which data are available, only five countries achieved strong sustainable productivity growth (improvements in all environmental indicators and TFP growth relative to the OECD median) between 2007 and 2016, compared with 13 countries between 1997 and 2006. Similarly, the disproportionately low allocation of resources to policies that enhance the sector’s capacity to absorb risks has undermined its capacity to adapt and transform in response to those risks.
Trade plays an essential role in maintaining stability and fostering resilience in the global food system. By allowing produce to flow from food surplus areas to food deficit areas, trade helps to absorb the impacts of local and regional supply shocks. This generally results in lower price volatility, reduced uncertainty of supply, and greater integration of global and regional markets. Where production variability is weakly correlated among countries, trade can help to mitigate supply volatility and manage domestic food shortages driven by poor harvests, droughts, floods and other catastrophic events. The stabilising role of trade is only likely to increase in importance, as domestic production shocks become more frequent due to climate change. The continued use of price policies – in the form of both positive and negative market price support – and associated use of border measures undermines this critical aspect of resilience.
Three specific actions could enable agricultural policies to better support sustainable productivity growth and increased resilience, and accelerate progress in addressing the “triple challenge” facing food systems
Phase out price interventions and market distorting producer support. These policies have the most negative overall impact on food security and the environment. They are also an inefficient way of supporting livelihoods, with poor targeting in terms of either who is paying for the policy or who is receiving the benefit. The withdrawal of positive market price support and associated trade protection would nevertheless imply a loss of income by producers that may need to be accompanied by transitional assistance and social safety nets. Conversely, the removal of policies that suppress domestic prices would raise prices, with a potential need for targeted income transfers to low-income households and consumers.
Target income support to farm households most in need; where possible shift its role away from agricultural budgets, and towards economy-wide social policies and safety nets. In many countries, income support predominantly benefits large farm households with comparatively high income and wealth. A move to more targeted support would bring gains in efficiency and equity, but require deeper investments in data collection, in particular on the total incomes and assets of agricultural households. Agricultural policy would still have an important role in underwriting those aspects of agricultural risk management that cannot be covered by farmers themselves or by risk markets, and in fostering greater resilience to future shocks.
Re-orient public expenditures towards investments in public goods with the potential to deliver sustainable productivity growth and improved sectoral resilience. Specifically, investments in innovation systems should be made central to agricultural support policies. However, innovation – which encompasses not just new technologies, but improved practices and systems – is currently marginal, with just 6% of all budgetary support going to research and innovation directly, 9% to public investments in infrastructure and 2% to biosecurity. These shares could be almost doubled by a redirection of market distorting payments, and raised further still by a reallocation of income support away from farmers whose incomes from farm and off-farm sources would be above average even without support. Public goods can also be generated by individual agricultural producers in the form of ecosystem services and other environmental amenities demanded by societies. Targeted and tailored payments to producers can foster the availability of such goods, and provide additional income opportunities for farm households.
The formidable challenges facing food systems call for a range of policies, many of which extend beyond primary agriculture
Food systems around the world face a formidable triple challenge of providing food security and nutrition to a growing global population, providing livelihoods to those along the food supply chain, and contributing to environmental sustainability. Effective agricultural policies can make an important contribution to each of these goals, but they will not be sufficient. A wider food systems approach means mobilising policies in a wide range of areas that go beyond primary agriculture, for example via targeted policies to encourage healthier dietary choices, broad policies to ensure balanced rural and economic development, and economy-wide plans to curb GHG emissions. It also means exploiting synergies and managing trade-offs between the different dimensions of the triple challenge. A “food systems approach” to addressing these challenges requires that agricultural policymakers take a holistic view of the performance of policies related to multiple objectives, and co-ordinate to avoid incoherent policies.
References
[28] Alston, J. et al. (2010), A Meta-Analysis of Rates of Return to Agricultural R&D: Ex Pede Herculem?, International Food Policy Research Institute (IFPRI) Research Report 113, https://www.ifpri.org/publication/meta-analysis-rates-return-agricultural-r-d.
[51] Anderson, K. and S. Nelgen (2012), “Trade Barrier Volatility and Agricultural Price Stabilization”, World Development, Vol. 40/1, pp. 36-48, https://doi.org/10.1016/j.worlddev.2011.05.018.
[24] Anderson, K. and E. Valenzuela (2021), “What impact are subsidies and trade barriers abroad having on Australasian and Brazilian agriculture?”, Australian Journal of Agricultural and Resource Economics, Vol. 65/2, https://doi.org/10.1111/1467-8489.12413.
[6] Baragwanath, T. (2021), “Digital opportunities for demand-side policies to improve consumer health and the sustainability of food systems”, OECD Food, Agriculture and Fisheries Papers, No. 148, OECD Publishing, Paris, https://dx.doi.org/10.1787/bec87135-en.
[44] Beghin, J. and H. Jensen (2008), “Farm policies and added sugars in US diets”, Food Policy, Vol. 33/6, pp. 480-488, https://doi.org/10.1016/j.foodpol.2008.05.007.
[70] Benton, T. et al. (2021), Food system impacts on biodiversity loss: Three levers for food system transformation in support of nature, Chatham House, London, https://www.chathamhouse.org/sites/default/files/2021-02/2021-02-03-food-system-biodiversity-loss-benton-et-al_0.pdf.
[81] Blandford, D. and K. Hassapoyannes (2018), “The role of agriculture in global GHG mitigation”, OECD Food, Agriculture and Fisheries Papers, No. 112, OECD Publishing, Paris, https://doi.org/10.1787/da017ae2-en.
[40] Bouis, H. (2000), “Improving Human Nutrition through Agriculture: The Role of International Agricultural Research. Conference Summary and Recommendations.”, Food and Nutrition Bulletin, Vol. 21/4, pp. 550-567, https://doi.org/10.1177/156482650002100441.
[46] Bowman, M. and D. Zilberman (2013), “Economic Factors Affecting Diversified Farming Systems”, Ecology and Society, Vol. 18/1, https://www.jstor.org/stable/26269286.
[16] Brink, L. (2018), “Two indicators, little in common, same name: Market Price Support”, CAP Reform, http://capreform.eu/two-indicators-little-in-common-same-name-market-price-support/ (accessed on 25 March 2019).
[48] Brooks, J. (ed.) (2012), Agricultural Policies for Poverty Reduction, OECD Publishing, Paris, https://doi.org/10.1787/9789264112902-en.
[23] Brooks, J. and A. Matthews (2015), “Trade Dimensions of Food Security”, OECD Food, Agriculture and Fisheries Papers No. 77, https://doi.org/10.1787/5js65xn790nv-en.
[66] Busch, J. and K. Ferretti-Gallon (2017), “What Drives Deforestation and What Stops It? A Meta-Analysis”, Review of Environmental Economics and Policy, Vol. 11/1, pp. 3-23, https://doi.org/10.1093/reep/rew013.
[64] Dasgupta, P. (2021), The Economics of Biodiversity: The Dasgupta Review. Abridged Version, HM Treasury, London, https://assets.publishing.service.gov.uk/government/uploads/system/uploads/attachment_data/file/957292/Dasgupta_Review_-_Abridged_Version.pdf.
[59] de Frahan, B., J. Dong and R. De Blander (2017), “Farm Household Incomes in OECD Member Countries over the Last 30 Years of Public Support”, LIS Working Paper Series 700, https://www.econstor.eu/bitstream/10419/169260/1/700.pdf.
[75] DeBoe, G. (2020), “Impacts of agricultural policies on productivity and sustainability performance in agriculture: A literature review”, OECD Food, Agriculture and Fisheries Papers, No. 141, OECD Publishing, Paris, https://doi.org/10.1787/6bc916e7-en.
[80] DeBoe, G. et al. (2020), “Reforming Agricultural Policies Will Help to Improve Environmental Performance”, EuroChoices, Vol. 19/1, pp. 30-35, https://doi.org/10.1111/1746-692X.12247.
[49] Deuss, A. (2017), “Impact of agricultural export restrictions on prices in importing countries”, OECD Food, Agriculture and Fisheries Papers No. 105, https://doi.org/10.1787/1eeeb292-en.
[50] Deuss, A. (2015), “Review of the performance and impacts of recent stockholding policies”, in Issues in Agricultural Trade Policy: Proceedings of the 2014 OECD Global Forum on Agriculture, OECD Publishing, Paris, https://doi.org/10.1787/9789264233911-5-en.
[60] Dewbre, J., J. Antón and W. Thompton (2001), “The Transfer Efficiency and Trade Effects of Direct Payments”, American Journal of Agricultural Economics, Vol. 83/5, pp. 1204-1214, https://doi.org/10.1111/0002-9092.00268.
[14] Diakosavvas, D. (2002), “Agricultural Policies in China after WTO Accession”, in China in the Global Economy, OECD Publishing, Paris, https://doi.org/10.1787/9789264158894-en.
[15] Effland, A. (2011), “Classifying and Measuring Agricultural Support: Identifying Differences Between the WTO and OECD Systems”, Economic Information Bullentin 74, http://www.ers.usda.gov/ (accessed on 19 April 2019).
[17] FAO (2020), Hunger and food insecurity, http://www.fao.org/hunger/en/ (accessed on 1 March 2021).
[95] FAO (2006), “Food Security”, Policy Brief, Issue 2, http://www.fao.org/fileadmin/templates/faoitaly/documents/pdf/pdf_Food_Security_Cocept_Note.pdf (accessed on 29 April 2021).
[68] FAO and UNEP (2020), The State of the World’s Forests 2020. Forests, biodiversity and people., FAO, Rome, https://doi.org/10.4060/ca8642en.
[89] FAO, IFAD and WFP (2019), Strengthening resilience for food security and nutrition: A Conceptual Framework for Collaboration and Partnership among the Rome-based Agencies, Food and Agriculture Organization of the United Nations (FAO), the International Fund for Agricultural Development (IFAD) and the World Food Programme (WFP), https://docs.wfp.org/api/documents/WFP-0000062320/download/.
[18] FAO, IFAD, UNICEF, WFP and WHO (2020), The State of Food Security and Nutrition in the World 2020. Transforming food systems for affordable healthy diets, FAO, Rome, https://doi.org/10.4060/ca9692en.
[9] FEBA (2020), FEBA EU Monitoring - November-December 2020, European Food Banks Federation, https://lp.eurofoodbank.org/wp-content/uploads/2020/12/FEBA_EU_Monitoring_NovDec2020.pdf.
[33] Filipski, M. and K. Covarrubias (2012), Distributional Impacts of Commodity Prices in Developing Countries, OECD Publishing, Paris, https://doi.org/10.1787/9789264112902-en.
[84] G7 Agriculture Ministers (2017), , G7 Bergamo Agriculture Ministers’ Meeting Communiqué 14-15 October 2017 - Empowering Farmers, Developing Rural Areas and Enhancing Cooperation to Feed the Planet, http://www.g7italy.it/en/documenti-ministeriali.
[38] GBD 2019 Risk Factors Collaborators (2020), “Global burden of 87 risk factors in 204 countries and territories, 1990–2019: a systematic analysis for the Global Burden of Disease Study 2019”, Global Health Metrics, Vol. 396/10258, pp. 1223-1249, https://doi.org/10.1016/S0140-6736(20)30752-2.
[7] GFN (2020), Strengthening Food Donation Operations During COVID-19: Key issues and Best Practices for Governments Around the Globe, The Global FoodBanking Network, https://www.foodbanking.org/wp-content/uploads/2020/06/Global-Food-Donation-Policy-Atlas-COVID19-Issue-Brief.pdf.
[43] Giner, C. and J. Brooks (2019), “Policies for encouraging healthier food choices”, OECD Food, Agriculture and Fisheries Papers No. 137, https://doi.org/10.1787/11a42b51-en.
[45] Global Panel on Agriculture and Food Systems for Nutrition (2020), Foresight 2.0: Future Food Systems: For people, our planet, and prosperity, https://foresight.glopan.org/.
[25] Greenville, J. et al. (2019), “Influencing GVCs through Agro-Food Policy and Reform”, OECD Food, Agriculture and Fisheries Papers No. 125, https://doi.org/10.1787/9ce888e0-en.
[57] Greenville, J., K. Kawasaki and M. Jouanjean (2019), “Employment in Agriculture and Food Trade: Assessing the Role of GVCs”, OECD Food, Agriculture and Fisheries Papers, No. 124, OECD Publishing, Paris, https://doi.org/10.1787/5ed3b181-en.
[4] Gruère, G. and J. Brooks (2021), “Viewpoint: Characterising early agricultural and food policy responses to the outbreak of COVID-19”, Food Policy, Vol. 100, p. 102017, https://doi.org/10.1016/j.foodpol.2020.102017.
[11] Gruère, G., M. Shigemitsu and S. Crawford (2020), “Agriculture and water policy changes: Stocktaking and alignment with OECD and G20 recommendations”, OECD Food, Agriculture and Fisheries Papers, No. 144, OECD Publishing, Paris, https://dx.doi.org/10.1787/f35e64af-en.
[78] Guerrero, S. (2018), “Farmland Birds under Pressure”, EuroChoices, Vol. 17/3, pp. 24-25, https://doi.org/10.1111/1746-692X.12204.
[47] Hattersley, L. et al. (2020), “Countering common arguments against taxes on sugary drinks”, Health, Nutrition and Population Knowledge Brief, World Bank, Washington, DC, http://hdl.handle.net/10986/34361.
[42] Hazell, P. (2009), “The Asian Green Revolution”, IFPRI Discussion Paper, International Food Policy Research Institute, https://www.ifpri.org/publication/asian-green-revolution.
[32] Heisey, P. and K. Fuglie (2018), “Public agricultural R&D in high-income countries: Old and new roles in a new funding environment”, Global Food Security, Vol. 17, pp. 92-102, https://doi.org/10.1016/j.gfs.2018.03.008.
[91] Henderson, B. et al. (2021), “Policy strategies and challenges for climate change mitigation in the Agriculture, Forestry and Other Land Use (AFOLU) sector”, OECD Food, Agriculture and Fisheries Papers, No. 149, OECD Publishing, Paris, https://doi.org/10.1787/47b3493b-en.
[73] Henderson, B. and J. Lankoski (2020), “Assessing the Environmental Impacts of Agricultural Policies”, Applied Economic Perspectives and Policy, pp. 1-16, https://doi.org/10.1002/aepp.13081.
[72] Henderson, B. and J. Lankoski (2019), “Evaluating the environmental impact of agricultural policies”, OECD Food, Agriculture and Fisheries Papers, No. 130, OECD Publishing, Paris, https://doi.org/10.1787/add0f27c-en.
[67] Hosonuma, N. et al. (2012), “An assessment of deforestation and forest degradation drivers in developing countries”, Environmental Research Letters, Vol. 7/4, https://doi.org/10.1088/1748-9326/7/4/044009.
[2] IMF (2021), Primary Commodity Prices, https://www.imf.org/en/Research/commodity-prices (accessed on 20 April 2021).
[90] IPBES (2019), Summary for policymakers of the global assessment report on biodiversity and ecosystem services of the Intergovernmental Science-Policy Platform on Biodiversity and Ecosystem Services, IPBES secretariat, Bonn, Germany, https://www.ipbes.net/sites/default/files/2020-02/ipbes_global_assessment_report_summary_for_policymakers_en.pdf.
[63] IPCC (2019), “Summary for Policymakers”, in Climate Change and Land: an IPCC special report on climate change, desertification, land degradation, sustainable land management, food security, and greenhouse gas fluxes in terrestrial ecosystems, https://www.ipcc.ch/srccl/chapter/summary-for-policymakers/.
[34] Ivanic, M. and W. Martin (2008), “Implications of Higher Global Food Prices for Poverty in Low-Income Countries”, Agricultural Economics, Vol. 39/s1, pp. 405-416, https://doi.org/10.1111/j.1574-0862.2008.00347.x.
[41] Kataki, P. (2002), “Shifts in Cropping System and Its Effect on Human Nutrition: Case Study from India”, Journal of Crop Production, Vol. 6/1-2, pp. 119-144, https://doi.org/10.1300/J144v06n01_08.
[30] Kristkova, Z., M. van Dijk and H. van Meijl (2017), “Assessing the Impact of Agricultural R&D Investments on Long-Term Projections of Food Security”, World Agricultural Resources and Food Security (Frontiers of Economics and Globalization), Vol. 17, pp. 1-17, https://doi.org/10.1108/S1574-871520170000017001.
[77] Laborde, D. et al. (2021), “Agricultural subsidies and global greenhouse gas emissions”, Nature Communications, Vol. 12/2601, https://doi.org/10.1038/s41467-021-22703-1.
[36] Laborde, D. et al. (2020), “COVID-19 risks to global food security”, Science, Vol. 369/6503, pp. 500-502, https://doi.org/10.1126/science.abc4765.
[76] Lankoski, J. and A. Thiem (2020), “Linkages between agricultural policies, productivity and environmental sustainability”, Ecological Economics, Vol. 178, https://doi.org/10.1016/j.ecolecon.2020.106809.
[82] Lechenet, M. et al. (2017), “Reducing pesticide use while preserving crop productivity and profitability on arable farms”, Nature Plants, Vol. 3, https://doi.org/10.1038/nplants.2017.8.
[54] Lowder, S., J. Skoet and T. Raney (2016), “The Number, Size, and Distribution of Farms, Smallholder Farms, and Family Farms Worldwide”, World Development, Vol. 87, pp. 16-29, https://doi.org/10.1016/j.worlddev.2015.10.041.
[12] OECD (2021), Agriculture and water policies: characteristics and evolution from 2009 to 2019, OECD country profiles, OECD Publishing, Paris, http://www.oecd.org/agriculture/topics/water-and-agriculture#profiles.
[62] OECD (2021), “Digital opportunities for Sanitary and Phytosanitary (SPS) Systems and the trade facilitation effects of SPS Electronic Certification”, OECD Food, Agriculture and Fisheries Papers, No. 152, OECD Publishing, Paris, https://dx.doi.org/10.1787/cbb7d0f6-en.
[35] OECD (2021), Making Better Policies for Food Systems, OECD Publishing, Paris, https://doi.org/10.1787/ddfba4de-en.
[94] OECD (2021), OECD Economic Outlook, Interim Report March 2021, OECD Publishing, Paris, https://dx.doi.org/10.1787/34bfd999-en.
[93] OECD (2021), Policies for the Future of Farming and Food in Norway, OECD Agriculture and Food Policy Reviews, OECD Publishing, Paris, https://doi.org/10.1787/20b14991-en.
[3] OECD (2020), Agricultural Policy Monitoring and Evaluation 2020, OECD Publishing, Paris, https://dx.doi.org/10.1787/928181a8-en.
[74] OECD (2020), “Exploring the Linkages between Agricultural Policies, Productivity and Environmental Sustainability”, https://one.oecd.org/document/COM/TAD/CA/ENV/EPOC(2019)4/FINAL/en/pdf.
[5] OECD (2020), “Measuring distortions in international markets: The agriculture sector”, Agriculture Policy Brief, https://issuu.com/oecd.publishing/docs/measuring_distortions_in_internatio.
[96] OECD (2020), “OECD Agro-Food Productivity-Sustainability-Resilience Policy Framework: Revised Framework”, https://one.oecd.org/document/TAD/CA/APM/WP(2019)25/FINAL/en/pdf.
[1] OECD (2020), OECD Economic Outlook, Volume 2020 Issue 2, OECD Publishing, Paris, https://dx.doi.org/10.1787/39a88ab1-en.
[52] OECD (2020), Strengthening Agricultural Resilience in the Face of Multiple Risks, OECD Publishing, Paris, https://doi.org/10.1787/2250453e-en.
[92] OECD (2019), Enhancing Climate Change Mitigation through Agriculture, OECD Publishing, Paris, https://dx.doi.org/10.1787/e9a79226-en.
[31] OECD (2019), Innovation, Productivity and Sustainability in Food and Agriculture: Main Findings from Country Reviews and Policy Lessons, OECD Food and Agricultural Reviews, OECD Publishing, Paris, https://doi.org/10.1787/c9c4ec1d-en.
[37] OECD (2019), The Heavy Burden of Obesity: The Economics of Prevention, OECD Health Policy Studies, OECD Publishing, Paris, https://doi.org/10.1787/67450d67-en.
[21] OECD (2016), Evolving Agricultural Policies and Markets: Implications for Multilateral Trade Reform, OECD Publishing, Paris, https://doi.org/10.1787/9789264264991-en.
[13] OECD (2016), OECD’S Producer Support Estimate and Related Indicators of Agricultural Support - Concepts, Calculations, Interpretation and Use (The PSE Manual), https://www.oecd.org/agriculture/topics/agricultural-policy-monitoring-and-evaluation/documents/producer-support-estimates-manual.pdf.
[88] OECD (2014), Boosting Resilience through Innovative Risk Governance, OECD Reviews of Risk Management Policies, OECD Publishing, Paris, https://dx.doi.org/10.1787/9789264209114-en.
[19] OECD (2013), Global Food Security: Challenges for the Food and Agricultural System, OECD Publishing, Paris, https://doi.org/10.1787/9789264195363-en.
[86] OECD (2011), Managing Risk in Agriculture: Policy Assessment and Design, OECD Publishing, Paris, https://dx.doi.org/10.1787/9789264116146-en.
[85] OECD (2009), Managing Risk in Agriculture: A Holistic Approach, OECD Publishing, Paris, https://dx.doi.org/10.1787/9789264075313-en.
[58] OECD (2003), Farm Household Income: Issues and Policy Responses, OECD Publishing, Paris, https://doi.org/10.1787/9789264099678-en.
[27] OECD (2002), Agricultural Policies in OECD Countries: A Positive Reform Agenda, OECD Publishing, Paris, https://doi.org/10.1787/9789264199682-en.
[20] OECD/FAO (2020), OECD-FAO Agricultural Outlook 2020-2029, FAO, Rome/OECD Publishing, Paris, https://doi.org/10.1787/1112c23b-en.
[29] Piesse, J. and C. Thirtle (2010), “Agricultural R&D, technology and productivity”, Philosophical transactions of the Royal Society B, Vol. 365/1554, pp. 3035-3047, https://doi.org/10.1098/rstb.2010.0140.
[22] Pingali, P. (2015), “Agricultural policy and nutrition outcomes – getting beyond the preoccupation with staple grains”, Food Security, Vol. 7, pp. 583–591, https://doi.org/10.1007/s12571-015-0461-x.
[39] Pingali, P. (2012), “Green Revolution: Impacts, limits, and the path ahead”, Proceedings of the National Academy of Sciences of the United States of America (PNAS), Vol. 109/31, pp. 12302-12308, https://doi.org/10.1073/pnas.0912953109.
[10] Placzek, O. (2021), “Socio-economic and demographic aspects of food security and nutrition”, OECD Food, Agriculture and Fisheries Papers, No. 150, OECD Publishing, Paris, https://dx.doi.org/10.1787/49d7059f-en.
[56] Punthakey, J. (2020), “Foreign direct investment and trade in agro-food global value chains”, OECD Food, Agriculture and Fisheries Papers, No. 142, OECD Publishing, Paris, https://dx.doi.org/10.1787/993f0fdc-en.
[71] Raven, P. and D. Wagner (2021), “Agricultural intensification and climate change are rapidly decreasing insect biodiversity”, Proceedings of the National Academy of Sciences of the United States of America (PNAS), Vol. 118/2, https://doi.org/10.1073/pnas.2002548117.
[61] Ricciardi, V. et al. (2018), “How much of the world’s food do smallholders produce?”, Global Food Security, Vol. 17, pp. 64-72, https://doi.org/10.1016/j.gfs.2018.05.002.
[83] Ryan, M. (2019), “Evaluating the economic benefits and costs of antimicrobial use in food-producing animals”, OECD Food, Agriculture and Fisheries Papers, No. 132, OECD Publishing, Paris, https://doi.org/10.1787/f859f644-en.
[79] Sud, M. (2020), “Managing the Biodiversity Impacts of Fertiliser and Pesticide Use: Overview and insights from trends and policies across selected OECD countries”, OECD Environment Working Papers, No. 155, OECD Publishing, Paris, https://dx.doi.org/10.1787/63942249-en.
[26] Thompson-Lipponen, C. and J. Greenville (2019), “The Evolution of the Treatment of Agriculture in Preferential Trade Agreements”, OECD Food, Agriculture and Fisheries Papers No. 126, https://doi.org/10.1787/751d274f-en.
[69] Tilman, D. et al. (2017), “Future threats to biodiversity and pathways to their prevention”, Nature, Vol. 546, pp. 73-81, https://doi.org/10.1038/nature22900.
[55] Townsend, R. et al. (2017), Future of food: Shaping the food system to deliver jobs, World Bank Group, Washington, DC, http://documents.worldbank.org/curated/en/406511492528621198/Future-of-food-shaping-the-food-system-to-deliver-jobs.
[87] UNISDR (2015), Sendai Framework for Disaster Risk Reduction 2015 - 2030, United Nations Office for Disaster Risk Reduction, https://www.unisdr.org/files/43291_sendaiframeworkfordrren.pdf (accessed on 22 August 2018).
[65] United Nations (2021), The United Nations World Water Development Report 2021: Valuing Water, UNESCO, Paris, http://www.unesco.org/reports/wwdr/2021/en.
[8] USDA (2021), USDA Announces Continuation of the Farmers to Families Food Box Program, Fifth Round of Food Purchases, U.S. Department of Agriculture, Washington, DC, https://www.usda.gov/media/press-releases/2021/01/04/usda-announces-continuation-farmers-families-food-box-program-fifth#:~:text=(Washington%2C%20D.C.%2C%20January%204,to%20Families%20Food%20Box%20Program (accessed on 4 January).
[53] World Bank (2021), “Employment in agriculture (% of total employment) (modeled ILO estimate)”, World Development Indicators, https://data.worldbank.org/indicator/SL.AGR.EMPL.ZS (accessed on 28 March 2021).
Producer Support Estimate (PSE): The annual monetary value of gross transfers from consumers and taxpayers to agricultural producers, measured at the farm gate level, arising from policy measures that support agriculture, regardless of their nature, objectives or impacts on farm production or income. It includes market price support, budgetary payments and budget revenue foregone, i.e. gross transfers from consumers and taxpayers to agricultural producers arising from policy measures based on: current output, input use, area planted/animal numbers/receipts/incomes (current, non-current), and non-commodity criteria. PSE categories are defined in Box 1 A.1.
Market Price Support (MPS): The annual monetary value of gross transfers from consumers and taxpayers to agricultural producers arising from policy measures that create a gap between domestic market prices and border prices of a specific agricultural commodity, measured at the farm gate level. MPS is available by commodity, and sums of negative and positive components are reported separately where relevant along with the total MPS.
Producer Single Commodity Transfers (producer SCT): The annual monetary value of gross transfers from consumers and taxpayers to agricultural producers, measured at the farm gate level, arising from policies linked to the production of a single commodity such that the producer must produce the designated commodity in order to receive the payment. This includes broader policies where transfers are specified on a per-commodity basis. Producer SCT is also available by commodity.
Group Commodity Transfers (GCT): The annual monetary value of gross transfers from consumers and taxpayers to agricultural producers, measured at the farm gate level, arising from policies whose payments are made on the basis that one or more of a designated list of commodities is produced, i.e. a producer may produce from a set of allowable commodities and receive a transfer that does not vary with respect to this decision.
All Commodity Transfers (ACT): The annual monetary value of gross transfers from consumers and taxpayers to agricultural producers, measured at the farm gate level, arising from policies that place no restrictions on the commodity produced but require the recipient to produce some commodity of their choice.
Other Transfers to Producers (OTP): The annual monetary value of gross transfers from consumers and taxpayers to agricultural producers, measured at the farm gate level, arising from policies that do not require any commodity production at all.
Consumer Single Commodity Transfers (consumer SCT): The annual monetary value of gross transfers from (to) consumers of agricultural commodities, measured at the farm gate level, arising from policies linked to the production of a single commodity. Consumer SCT is also available by commodity.
Consumer Support Estimate (CSE): The annual monetary value of gross transfers from (to) consumers of agricultural commodities, measured at the farm gate level, arising from policy measures that support agriculture, regardless of their nature, objectives or impacts on consumption of farm products. If negative, the CSE measures the burden (implicit tax) on consumers through market price support (higher prices), that more than offsets consumer subsidies that lower prices to consumers.
General Services Support Estimate (GSSE): The annual monetary value of gross transfers arising from policy measures that create enabling conditions for the primary agricultural sector through development of private or public services, institutions and infrastructure, regardless of their objectives and impacts on farm production and income, or consumption of farm products. The GSSE includes policies where primary agriculture is the main beneficiary, but does not include any payments to individual producers. GSSE transfers do not directly alter producer receipts or costs or consumption expenditures. GSSE categories are defined below.
Total Support Estimate (TSE): The annual monetary value of all gross transfers from taxpayers and consumers arising from policy measures that support agriculture, net of the associated budgetary receipts, regardless of their objectives and impacts on farm production and income, or consumption of farm products.
Total Budgetary Support Estimate (TBSE): The annual monetary value of all gross budgetary transfers from taxpayers arising from policy measures that support agriculture, regardless of their objectives and impacts on farm production and income, or consumption of farm products.
Percentage PSE (%PSE): PSE transfers as a share of gross farm receipts (including support in the denominator).
Percentage SCT (%SCT): Single Commodity Transfers as a share of gross farm receipts for the specific commodity (including support in the denominator).
Share of SCT in total PSE (%): Share of Single Commodity Transfers in the total PSE. This indicator is also calculated by commodity.
Producer Nominal Protection Coefficient (producer NPC): The ratio between the average price received by producers (at farm gate), including payments per tonne of current output, and the border price (measured at farm gate). The Producer NPC is also available by commodity.
Producer Nominal Assistance Coefficient (producer NAC): The ratio between the value of gross farm receipts including support and gross farm receipts (at farm gate) valued at border prices (measured at farm gate).
Percentage CSE (%CSE): CSE transfers as a share of consumption expenditure on agricultural commodities (at farm gate prices), net of taxpayer transfers to consumers. The %CSE measures the implicit tax (or subsidy, if CSE is positive) placed on consumers by agricultural price policies.
Consumer Nominal Protection Coefficient (consumer NPC): The ratio between the average price paid by consumers (at farm gate) and the border price (measured at farm gate). The Consumer NPC is also available by commodity.
Consumer Nominal Assistance Coefficient (consumer NAC): The ratio between the value of consumption expenditure on agricultural commodities (at farm gate) and that valued at border prices.
Percentage TSE (%TSE): TSE transfers as a percentage of GDP.
Percentage TBSE (%TBSE): TBSE transfers as a percentage of GDP.
Percentage GSSE (%GSSE): Share of expenditures on general services in the Total Support Estimate (TSE).
Share of potentially most distorting transfers in cumulated gross producer transfers (%): represents the sum of positive MPS, the absolute value of negative MPS, payments based on output and payments based on unconstrained use of variable inputs, relative to the sum of positive MPS, the absolute value of negative MPS, and all budgetary payments to producers.
Category A1, Market price support (MPS): Transfers from consumers and taxpayers to agricultural producers from policy measures that create a gap between domestic market prices and border prices of a specific agricultural commodity, measured at the farm gate level.
Category A2, Payments based on output: Transfers from taxpayers to agricultural producers from policy measures based on current output of a specific agricultural commodity.
Category B, Payments based on input use: Transfers from taxpayers to agricultural producers arising from policy measures based on on-farm use of inputs:
Variable input use that reduces the on-farm cost of a specific variable input or a mix of variable inputs.
Fixed capital formation that reduces the on-farm investment cost of farm buildings, equipment, plantations, irrigation, drainage, and soil improvements.
On-farm services that reduce the cost of technical, accounting, commercial, sanitary and phytosanitary assistance and training provided to individual farmers.
Category C, Payments based on current A/An/R/I, production required: Transfers from taxpayers to agricultural producers arising from policy measures based on current area, animal numbers, revenue, or income, and requiring production.
Category D, Payments based on non-current A/An/R/I, production required: Transfers from taxpayers to agricultural producers arising from policy measures based on non-current (i.e. historical or fixed) area, animal numbers, revenue, or income, with current production of any commodity required.
Category E, Payments based on non-current A/An/R/I, production not required: Transfers from taxpayers to agricultural producers arising from policy measures based on non-current (i.e. historical or fixed) area, animal numbers, revenue, or income, with current production of any commodity not required but optional.
Category F, Payments based on non-commodity criteria: Transfers from taxpayers to agricultural producers arising from policy measures based on:
Long-term resource retirement: Transfers for the long-term retirement of factors of production from commodity production. The payments in this subcategory are distinguished from those requiring short-term resource retirement, which are based on commodity production criteria.
A specific non-commodity output: Transfers for the use of farm resources to produce specific non-commodity outputs of goods and services, which are not required by regulations.
Other non-commodity criteria: Transfers provided equally to all farmers, such as a flat rate or lump sum payment.
Category G, Miscellaneous payments: Transfers from taxpayers to farmers for which there is a lack of information to allocate them among the appropriate categories.
Note: A (area), An (animal numbers), R (receipts) or I (income).
With or without current commodity production limits and/or limit to payments: Defines whether or not there is a specific limitation on current commodity production (output) associated with a policy providing transfers to agriculture and whether or not there are limits to payments in the form of limits to area or animal numbers eligible for those payments. Applied in categories A–F.
With variable or fixed payment rates: Any payments is defined as subject to a variable rate where the formula determining the level of payment is triggered by a change in price, yield, net revenue or income or a change in production cost. Applied in categories A–E.
With or without input constraints: defines whether or not there are specific requirements concerning farming practices related to the programme in terms of the reduction, replacement, or withdrawal in the use of inputs or a restriction of farming practices allowed. Applied in categories A–F. The payments with input constrains are further broken down to:
Payments conditional on compliance with basic requirements that are mandatory (with mandatory);
Payments requiring specific practices going beyond basic requirements and voluntary (with voluntary).
With or without commodity exceptions: defines whether or not there are prohibitions upon the production of certain commodities as a condition of eligibility for payments based on non-current A/An/R/I of commodity(ies). Applied in Category E.
Based on area, animal numbers, receipts or income: defines the specific attribute (i.e. area, animal numbers, receipts or income) on which the payment is based. Applied in categories C–E.
Based on a single commodity, a group of commodities or all commodities: defines whether the payment is granted for production of a single commodity, a group of commodities or all commodities. Applied in categories A–D.
Decomposition of PSE
Per cent change in PSE: Per cent change in the nominal value of the PSE expressed in national currency. The per cent change is calculated using the two most recent years in the series.
Contribution of MPS to per cent change in PSE: Per cent change in nominal PSE if all variables other than MPS are held constant.
Contribution of price gap to per cent change in the PSE: Per cent change in nominal PSE if all variables other than gap between domestic market prices and border prices are held constant.
Contribution of quantity produced to per cent change in the PSE: Per cent change in nominal PSE if all variables other than quantity produced are held constant.
Contribution of budgetary payments (BP) to per cent change in PSE: Per cent change in nominal PSE if all variables other than BP are held constant.
Contribution of BP elements to per cent change in PSE: Per cent change in nominal PSE if all variables other than a given BP element are held constant. BP elements include Payments based on output, Payments based on input use, Payments based on current A/An/R/I, production required, Payments based on non-current A/An/R/I, production required, Payments based on non-current A/An/R/I, production not required, Payments based on non-commodity criteria and Miscellaneous payments.
Change in Producer Price
Per cent change in Producer Price: Per cent change in Producer Price (at farm gate) expressed in national currency. The per cent change is calculated using the two most recent years in the series.
Decomposition of the change in the Border Price
Per cent change in Border Price: Per cent change in Border Price (at farm gate) expressed in national currency. The per cent change is calculated using the two most recent years in the series.
Contribution of Exchange Rate to per cent change in Border Price: Per cent change in the Border Price (at farm gate) expressed in national currency if all variables other than Exchange Rate between national currency and USD are held constant.
Contribution of Border Price expressed in USD to per cent change in Border Price: Per cent change in the Border Price (at farm gate) expressed in national currency if all variables other than Border Price (at farm gate) expressed in USD are held constant.
Note: The producer price change and the border price change are not calculated when the negative price gap occurs at the commodity level for the current or previous year.
Agricultural knowledge and innovation system
Agricultural knowledge generation: Budgetary expenditure financing research and development (R&D) activities related to agriculture, and associated data dissemination, irrespective of the institution (private or public, ministry, university, research centre or producer groups) where they take place, the nature of research (scientific, institutional, etc.), or its purpose.
Agricultural knowledge transfer: Budgetary expenditure financing agricultural vocational schools and agricultural programmes in high-level education, training and advice to farmers that is generic (e.g. accounting rules, pesticide application), not specific to individual situations, and data collection and information dissemination networks related to agricultural production and marketing.
Inspection and control
Agricultural product safety and inspection: Budgetary expenditure financing activities related to agricultural product safety and inspection. This includes only expenditures on inspection of domestically produced commodities at first level of processing and border inspection for exported commodities.
Pest and disease inspection and control: Budgetary expenditure financing pest and disease control of agricultural inputs and outputs (control at primary agriculture level) and public funding of veterinary services (for the farming sector) and phytosanitary services.
Input control: Budgetary expenditure financing the institutions providing control activities and certification of industrial inputs used in agriculture (e.g. machinery, industrial fertilisers, pesticides, etc.) and biological inputs (e.g. seed certification and control).
Development and maintenance of infrastructure
Hydrological infrastructure: Budgetary expenditure financing public investments into hydrological infrastructure (irrigation and drainage networks).
Storage, marketing and other physical infrastructure: Budgetary expenditure financing investments to off-farm storage and other market infrastructure facilities related to handling and marketing primary agricultural products (silos, harbour facilities – docks, elevators; wholesale markets, futures markets), as well as other physical infrastructure related to agriculture, when agriculture is the main beneficiary.
Institutional infrastructure: Budgetary expenditure financing investments to build and maintain institutional infrastructure related to the farming sector (e.g. land cadastres; machinery user groups, seed and species registries; development of rural finance networks; support to farm organisations, etc.).
Farm restructuring: Budgetary payments related to reform of farm structures financing entry, exit or diversification (outside agriculture) strategies.
Marketing and promotion
Collective schemes for processing and marketing: Budgetary expenditure financing investment in collective, mainly primary, processing, marketing schemes and marketing facilities, designed to improve marketing environment for agriculture.
Promotion of agricultural products: Budgetary expenditure financing assistance to collective promotion of agro-food products (e.g. promotion campaigns, participation on international fairs).
Cost of public stockholding: Budgetary expenditure covering the costs of storage, depreciation and disposal of public storage of agricultural products.
Miscellaneous: Budgetary expenditure financing other general services that cannot be disaggregated and allocated to the above categories, often due to a lack of information.
More detailed information on the indicators, their use and limitations is available in OECD’s Producer Support Estimate and Related Indicators of Agricultural Support: Concepts, Calculation, Interpretation and Use (the PSE Manual) available on the OECD public website (http://www.oecd.org/agriculture/topics/agricultural-policy-monitoring-and-evaluation/documents/producer-support-estimates-manual.pdf).
Notes
← 1. More recent estimates from OECD (2021[94]) suggest a slightly smaller GDP decline at -3.4% globally. Data provided in this section are based on the regular report from December 2020.
← 2. Publicly supported short-time work schemes allow companies to temporarily reduce the work time of employees by up to 100%, while wage differences are partly or fully subsidised by the government.
← 3. Three main types of impacts were observed on the agriculture and food sector (OECD, 2020[96]). First, there were impacts on agricultural production, due to the unavailability of labour, restrictions on access to intermediate agricultural inputs, and impacts on farmers’ income in affected subsectors that could not sell their output. Second, there have been impacts on consumer demand, with increased food insecurity led by unemployment and income shocks associated with containment measures, reduced demand for high value products, shifts in consumer demand towards retail, over food consumed away from home, and decline in biofuel demand due to transportation restrictions. Third, supply chain disruptions were observed in many countries, due in part to contamination in processing firms, transport and logistic issues, and difficulties in obtaining inputs.
← 4. Some of the early responses, such as the declaration of agriculture and food as being an essential sector that were reported in the 2020 report, have not been repeated in all country chapters for this year’s edition; however, they are also included in the analysis to ensure a full coverage of measures.
← 5. This categorisation can be further separated into 20 sub categories of measures (OECD, 2020[3]).
← 6. This grouping was also used in Gruère and Brooks (2021[4]) to characterise early policy responses to the COVID--19. Efforts were made to ensure a consistent and unique attribution of a group to each of the policy measures, although the attribution of some measures to a specific group could be subjective.
← 7. While targeted food assistance for low income households can also be considered urgent, the implemented measures essentially aim to cushion consumers from the economic impacts rather than cope with the urgency of the crisis for the delivery of agriculture and food products.
← 8. The majority of measures in this group could be considered market distorting and potentially environmentally harmful if maintained for long enough to affect producers’ decisions.
← 9. For a discussion on agriculture and water management progress, see Box 1.4.
← 10. The OECD also collaborates with other international organisations (FAO, IDB, the World Bank and IFPRI) in the Consortium for Measuring the Policy Environment for Agriculture (www.ag-incentives.org), which provides estimates for countries not covered by the OECD.
← 11. Food availability refers to the supply of sufficient quantities of food (either through domestic production or imports), while Access to food refers to the ability of individuals to access adequate resources to acquire appropriate foods for a nutritious diet (FAO, 2006[95]).
← 12. In the case of New Zealand, market price support for eggs and poultry arises as an unintended impact of science-based SPS measures whose sole purpose is to keep out diseases.
← 13. Possibly due to underreporting of other components of the GSSE (e.g. infrastructure and inspection and control).
← 14. The composition of a “healthy diet” varies according to individual characteristics, cultural contexts, local availability of foods and dietary customs. Healthy diets reflect global guidelines and ensure that a person’s needs for macronutrients (proteins, fats and carbohydrates including dietary fibres) and essential micronutrients (vitamins and minerals) are met (FAO, IFAD, UNICEF, WFP and WHO, 2020[18]).
← 15. Dietary risks as defined by the Global Burden of Diseases, Injuries, and Risk Factors Study include diets “low in whole grains, fruit, fibre, legumes, nuts and seeds, omega-3 fatty acids, Polyunsaturated fatty acids (PUFAs), vegetables, milk, and calcium”; and diets “high in sodium, trans fats, red or processed meat, and sugar-sweetened beverages” (GBD 2019 Risk Factors Collaborators, 2020[38]).
← 16. Enteric fermentation is a digestive process that occurs in cattle, sheep, goats and other ruminant livestock, whereby methane (CH4) emissions are produced in the rumen through a process of microbial fermentation.