copy the linklink copied!Reader’s guide
copy the linklink copied!Coverage of the statistics
Although a lack of data still limits the scope of the indicators in many countries, the coverage extends, in principle, to the entire national education system (within the national territory), regardless of who owns or sponsors the institutions concerned and regardless of how education is delivered. With one exception (described below), all types of students and all age groups are included: children (including students with special needs), adults, nationals, foreigners and students in open-distance learning, in special education programmes or in education programmes organised by ministries other than the ministry of education, provided that the main aim of the programme is to broaden or deepen an individual’s knowledge. Vocational and technical training in the workplace, with the exception of combined school- and work-based programmes that are explicitly deemed to be part of the education system, is not included in the basic education expenditure and enrolment data.
Educational activities classified as “adult” or “non-regular” are covered, provided that the activities involve the same or similar content as “regular” education studies, or that the programmes of which they are a part lead to qualifications similar to those awarded in regular education programmes.
Courses for adults that are primarily for general interest, personal enrichment, leisure or recreation are excluded.
More information on the coverage of the indicators presented in Education at a Glance can be found in the OECD Handbook for Internationally Comparable Statistics on Education 2018 (OECD, 2018[1]).
copy the linklink copied!Comparability over time
The indicators in Education at a Glance are the result of a continuous process of methodological improvement aimed at improving the robustness and international comparability of the indicators. As a result, when analysing indicators over time, it is strongly advised to do so within the most recent edition only, rather than comparing data across different editions. All comparisons over time presented in this report are based on annual revisions of historical data and the methodological improvements which have been implemented in this edition.
copy the linklink copied!Country coverage
This publication features data on education from all OECD countries;1 two partner countries that participate in the OECD Indicators of Education Systems programme (INES), namely Brazil and the Russian Federation; and other partner G20 and OECD accession countries that are not INES members (Argentina, the People’s Republic of China, Costa Rica, India, Indonesia, Saudi Arabia and South Africa). Data sources for the non-INES participating countries can come from the regular INES data collections, from the UNESCO Institute of Statistics or from Eurostat.
In some instances, and where relevant, a country may be represented through its subnational entities or specific regions.
The statistical data for Israel are supplied by and under the responsibility of the relevant Israeli authorities. The use of such data by the OECD is without prejudice to the status of the Golan Heights, East Jerusalem and Israeli settlements in the West Bank under the terms of international law.
copy the linklink copied!Note on subnational regions
When interpreting the results on subnational entities, readers should take into account their population as well as their geographical size. For example, in Canada, the population of Nunavut was 37 996 in 2017 and the territory covers 1.9 million square kilometres, while the population of the province of Ontario is 14.2 million and the territory covers 909 000 square kilometres (OECD, 2019[2]). Also, regional disparities tend to be higher when more subnational entities are used in the analysis, especially in big countries like Canada, the Russian Federation or the United States.
copy the linklink copied!Names used for territorial entities
For consistency, national and subnational entities are referred to as “countries” and “economies”, respectively, in the whole publication. Territorial and subnational entities are referred to throughout the publication by their subnational name and country, e.g. England (United Kingdom). For consistency with other indicators from Education at a Glance, the subnational entity “Flanders (Belgium)” used in the OECD Programme for the International Assessment of Adults (Survey of Adult Skills [PIAAC]) and the Teaching and Learning International Survey (TALIS) will be referred to by the name “Flemish Community of Belgium” throughout the publication. The Flemish Community of Belgium and French Community of Belgium are abbreviated in the tables and figures as “Flemish Comm. (Belgium)” and “French Comm. (Belgium)”.
copy the linklink copied!Calculation of international means
The main purpose of Education at a Glance is to provide an authoritative compilation of key international comparisons of education statistics. While overall values are given for countries in these comparisons, readers should not assume that countries themselves are homogeneous. The country averages include significant variations among subnational jurisdictions, much as the OECD average encompasses a variety of national experiences.
For many indicators, an OECD average is presented; for some, an OECD total is shown. The OECD average is calculated as the unweighted mean of the data values of all OECD countries2 for which data are available or can be estimated. The OECD average therefore refers to an average of data values at the level of the national systems and can be used to answer the question of how an indicator value for a given country compares with the value for a typical or average country. It does not take into account the absolute size of the education system in each country.
The OECD total is calculated as the weighted mean of the data values of all OECD countries3 for which data are available or can be estimated. It reflects the value for a given indicator when the OECD area is considered as a whole. This approach is taken for the purpose of comparing, for example, expenditure charts for individual countries with those of the entire OECD area for which valid data are available, with this area considered as a single entity.
For tables using trend series, an additional average is calculated for countries providing data for all reference years used. This allows for a comparison of the OECD average over time with no distortion due to the exclusion of certain countries in the different years.
For many indicators, an EU23 average is also presented. It is calculated as the unweighted mean of the data values of the 23 countries that are members of both the European Union and the OECD for which data are available or can be estimated. These 23 countries are Austria, Belgium, the Czech Republic, Denmark, Estonia, Finland, France, Germany, Greece, Hungary, Ireland, Italy, Latvia, Lithuania, Luxembourg, the Netherlands, Poland, Portugal, the Slovak Republic, Slovenia, Spain, Sweden and the United Kingdom. For some indicators, a G20 average is presented. The G20 average is calculated as the unweighted mean of the data values of all G20 countries for which data are available or can be estimated (Argentina, Australia, Brazil, Canada, China, France, Germany, India, Indonesia, Italy, Japan, Korea, Mexico, the Russian Federation, Saudi Arabia, South Africa, Turkey, the United Kingdom and the United States; the European Union is the 20th member of the G20 but is not included in the calculation). The G20 average is not computed if data for both China and India are not available.
OECD, EU23 and G20 averages and totals can be significantly affected by missing data. In the case of some countries, data may not be available for specific indicators, or specific categories may not apply. Therefore, readers should keep in mind that the term “OECD/EU23/G20 average” refers to the OECD, EU23 or G20 countries included in the respective comparisons. Averages are not calculated if more than 40% of countries have missing information or have information included in other columns.
For some indicators, an average is presented. The average corresponds to the arithmetic mean of the estimates included in the table or figure.
copy the linklink copied!Classification of levels of education
The classification of levels of education is based on the International Standard Classification of Education (ISCED). ISCED is an instrument for compiling statistics on education internationally. ISCED-97 was recently revised, and the new International Standard Classification of Education (ISCED 2011) was formally adopted in November 2011 and is now the basis of the levels presented in this publication, with the exception of tables showing data from the Survey of Adult Skills (PIAAC), which uses the previous ISCED-97 Classification.
In some indicators, intermediate programmes are also used. These correspond to recognised qualifications from an ISCED 2011 level programme, which is not considered as sufficient for ISCED 2011 completion and is classified at a lower ISCED 2011 level.
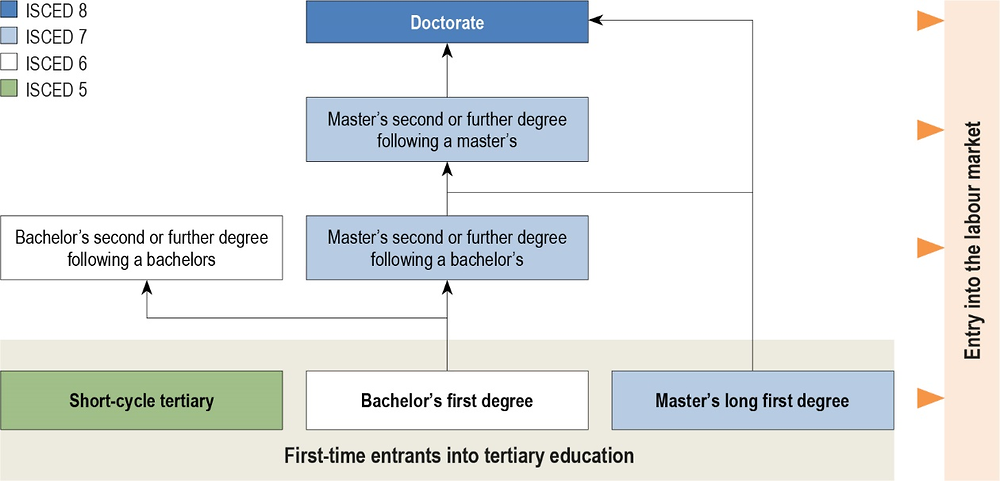
Table B lists the ISCED 2011 levels used in the publication (OECD/Eurostat/UNESCO Institute for Statistics, 2015[3]). Tertiary education, the focus of this year’s publication, builds on secondary education and provides learning activities in specialised fields of study. Tertiary education includes what is commonly understood as academic education, but also includes advanced vocational or professional education. It comprises ISCED levels 5 (short-cycle tertiary programmes), 6 (bachelor’s), 7 (master’s) and 8 (doctoral). Successful completion of an upper secondary programme is a requirement to enter tertiary education, and students can enter through short-cycle tertiary programmes, bachelor’s, or master’s long first degrees (Figure B). Access may also be possible from ISCED level 4 (post-secondary non-tertiary).
Fields of education and training
Within ISCED, programmes and related qualifications can be classified by fields of education and training as well as by levels. Following the adoption of ISCED 2011, a separate review and global consultation process took place on the ISCED fields of education. The ISCED fields were revised, and the UNESCO General Conference adopted the ISCED 2013 Fields of Education and Training classification (ISCED-F 2013) (UNESCO-UIS, 2014[4]) in November 2013 at its 37th session. The broad ISCED-F fields considered in this publication are education; arts and humanities; social sciences, journalism and information; business, administration and law; natural sciences, mathematics and statistics; information and communication technologies (ICT); engineering, manufacturing and construction; and health and welfare. Throughout this publication, the term “field of study” is used to refer to the different fields of this classification.
Source: OECD/Eurostat/UNESCO Institute for Statistics (2015[3]), ISCED 2011 Operational Manual: Guidelines for Classifying National Education Programmes and Related Qualifications, https://dx.doi.org/10.1787/9789264228368-en.
copy the linklink copied!Standard error (S.E.)
The statistical estimates presented in this report are based on samples of adults, rather than values that could be calculated if every person in the target population in every country had answered every question. Therefore, each estimate has a degree of uncertainty associated with sampling and measurement error, which can be expressed as a standard error. The use of confidence intervals is a way to make inferences about the population means and proportions in a manner that reflects the uncertainty associated with the sample estimates. In this report, confidence intervals are stated at a 95% level. In other words, the result for the corresponding population would lie within the confidence interval in 95 out of 100 replications of the measurement on different samples drawn from the same population.
In tables showing standard errors, the column with the heading “%” indicates the average percentage, and the column with the heading “S.E.” indicates the standard error. Given the survey method, there is a sampling uncertainty in the percentages (%) of twice the standard error (S.E.). For example, for the values % = 10 and S.E. = 2.6, 10% has an uncertainty zone of twice (1.96) the standard error of 2.6, assuming an error risk of 5%. Thus, the true percentage would probably (error risk of 5%) be somewhere between 5% and 15% (“confidence interval”). The confidence interval is calculated as: % +/– 1.96 * S.E., i.e. for the previous example, 5% = 10% – 1.96 * 2.6 and 15% = 10% + 1.96 * 2.6.
copy the linklink copied!Symbols for missing data and abbreviations
These symbols and abbreviations are used in the tables and figures:
a Data are not applicable because the category does not apply.
b There is a break in the series (for example when data for the latest year refer to ISCED 2011 and data for previous years refer to ISCED-97).
c There are too few observations to provide reliable estimates.
d Includes data from another category.
m Data are not available – either missing or the indicator could not be computed due to low respondent numbers.
r Values are below a certain reliability threshold and should be interpreted with caution.
q Data have been withdrawn at the request of the country concerned.
x Data included in another category or column of the table (e.g. x(2) means that data are included in Column 2 of the table).
copy the linklink copied!Further resources
The website www.oecd.org/education/education-at-a-glance-19991487.htm provides information on the methods used to calculate the indicators, on the interpretation of the indicators in the respective national contexts, and on the data sources involved. The website also provides access to the data underlying the indicators and to a comprehensive glossary for technical terms used in this publication.
All post-production changes to this publication are listed at www.oecd.org/publishing/corrigenda (corrections) and https://doi.org/10.1787/eag-data-en (updates).
Education at a Glance uses the OECD’s StatLinks service. Below each table and figure in Education at Glance 2019 is a URL that leads to a corresponding Excel file containing the underlying data for the indicator. These URLs are stable and will not change. In addition, readers of the Education at a Glance e-book will be able to click directly on these links and the workbook will open in a separate window.
The Education at a Glance Database on OECD.stat (http://stats.oecd.org/) houses the raw data and indicators presented in Education at a Glance, as well as the metadata that provides context and explanations for countries’ data. The Education at a Glance Database allows users to break down data in more ways than is possible in this publication in order to conduct their own analyses of education systems in participating countries. The Education at a Glance Database can be accessed from the OECD.stat site under the heading “Education and Training”.
copy the linklink copied!Layout of tables
In all tables, the numbers in parentheses at the top of the columns are simply used for reference. When a consecutive number does not appear, that column is available on line only.
copy the linklink copied!Abbreviations used in this report
Information and communication technologies
International Standard Classification of Education
Programme for the International Assessment of Adult Competencies
Purchasing power parity
Standard error
Science, technology, engineering and mathematics
UNESCO Institute of Statistics
Refers to the data collection managed by the three organisations, UNESCO, OECD, Eurostat
References
[2] OECD (2019), OECD Regional Statistics Database, http://stats.oecd.org/Index.aspx?DataSetCode=REGION_DEMOGR.
[1] OECD (2018), OECD Handbook for Internationally Comparative Education Statistics: Concepts, Standards, Definitions and Classifications, OECD Publishing, Paris, https://doi.org/10.1787/9789264304444-en.
[3] OECD/Eurostat/UNESCO Institute for Statistics (2015), ISCED 2011 Operational Manual: Guidelines for Classifying National Education Programmes and Related Qualifications, OECD Publishing, Paris, https://doi.org/10.1787/9789264228368-en.
[4] UNESCO-UIS (2014), ISCED Fields of Education and Training 2013 (ISCED-F 2013): Manual to Accompany the International Standard Classification of Education 2011; 2014, UNESCO Institute for Statistics, Montreal, https://doi.org/10.15220/978-92-9189-150-4-en (accessed on 18 April 2018).
Notes
← 1. On 25 May 2018, the OECD Council invited Colombia to become a Member. While Colombia is included in the OECD averages reported in this publication, at the time of its preparation, Colombia was in the process of completing its domestic procedures for ratification and the deposit of Colombia’s instrument of accession to the OECD Convention was pending.
← 2. See Note 1.
← 3. See Note 1.
Metadata, Legal and Rights
https://doi.org/10.1787/f8d7880d-en
© OECD 2019
The use of this work, whether digital or print, is governed by the Terms and Conditions to be found at http://www.oecd.org/termsandconditions.