copy the linklink copied!Chapter 2. Profile of Indigenous Canada: Trends and data needs
The objective of this chapter is to assess economic development and well-being outcomes for Indigenous peoples in Canada, and how to improve statistical frameworks and data governance. The chapter begins by profiling Indigenous socio-economic and demographic trends. The chapter then examines Indigenous community well-being and the importance of geography particularly remoteness and its implications for economic development. Profiles of Indigenous businesses, entrepreneurship and community-led economic development are then discussed. The chapter ends with a discussion of how Indigenous data could be improved in terms of data collection and dissemination, with a specific focus on understanding Indigenous businesses and economies.
Key findings
-
Indigenous Canadians—First Nations people, Métis and Inuit—are diverse peoples with unique cultures, histories and languages.
-
There are different ways to self-identify as Indigenous on the Canadian Census: as First Nations, Métis, Inuit and/or as a Status Indian and/or as a member of a First Nation/Indian band.
-
Around 1 670 000 individuals in Canada self-identify as Indigenous people, corresponding to 4.9% of the total population in 2016. Among the three groups, First Nations are the largest (at 60% out of total), followed by Métis (36%) and the Inuit population (4%).1
-
Compared to the non-Indigenous population, the Indigenous population is younger, growing faster, and more likely to be located in predominantly rural regions (approximately 60% of Indigenous Canadians compared to 33% for non-Indigenous peoples live in predominantly rural regions).
-
Although the well-being of Indigenous peoples has improved in Canada over recent decades, the pace of improvement has lagged the non-Indigenous population and gaps in well-being have increased. These gaps are also larger in predominantly rural regions.
-
The Indigenous business sector plays an important role in generating wealth and jobs for local communities, and some of these businesses are competitive and national and international markets. They are more likely to export and have a higher propensity to innovate.
-
The national statistical system for Indigenous Canadians is advanced in an international context but gaps remain in terms of business data, and incorporating Indigenous values and perspectives into well-being frameworks. In addition, more can be done to improve local area data and build the data capabilities of Indigenous organisations.
Recommendations
Improve the quality of data about Indigenous businesses and entrepreneurship by:
-
Establishing an agreed national definition of an Indigenous business.
-
Producing an annual state of the Indigenous economy report, highlighting progress and leading practices.
-
Supporting the establishment of a common registry of Indigenous-owned businesses.
-
Supporting Indigenous organisations to develop a typology of community-led business entities.
Improve Indigenous community well-being data by:
-
Working across the Federal Government in collaboration with Indigenous organisations to expand the range indicators and incorporate other data sources.
-
Including or expanding community capacity building and training activities in federal funding for Indigenous organisations.
-
Developing user-friendly data portals designed for local decision makers.
Strengthen engagement with Indigenous organisations regarding data collection by:
-
Developing a multi department strategy to coordinate on Indigenous statistics and data and work with Indigenous communities and organisations on an ongoing basis.
-
Establish more formalised governance arrangements for the inclusion Indigenous peoples and organisations in the work of Statistics Canada through an advisory body.
-
Increase the recruitment of Indigenous persons in Statistics Canada.
copy the linklink copied!Introduction
Indigenous Canadians—First Nations people, Métis and Inuit—are diverse peoples with unique cultures, histories and languages. Socio-economic outcomes and quality of life differ for these populations across Canada and yet, across far too many indicators (e.g., health, education, employment, and access to quality housing) Indigenous peoples fair poorer than non-Indigenous Canadians. These inequalities are well documented and have been the subject of numerous reports and commissions over the years.2
This is a task for reconciliation—to improve the socioeconomic outcomes and quality of life for Indigenous peoples across Canada. This task is all the more pressing due to the fact that the Indigenous population is young and growing. They will be Canada’s future leaders and there is an urgency to ensure that they are enabled to fulfil their vast potential.
A profile of Indigenous businesses across Canada demonstrates this potential. Indigenous businesses are present in every sector of the economy and they, like the Indigenous population, are growing (Canadian Council for Aboriginal Business, 2016[1]).3 An understanding of the unique characteristics and needs of Indigenous businesses, particularly in rural areas, is critical in order design effective policies and programmes to help them flourish. In support of these aims, better mechanisms are needed to collect and share data in a manner that is useful and acceptable to Indigenous peoples and communities.
This chapter presents an overview of Indigenous peoples, communities and businesses in Canada and discusses how data could be strengthened in order to better support evidence-based decision-making for Indigenous economic development and well-being. The chapter proceeds in four parts. It first profiles Indigenous socio-economic and demographic trends. Second, it examines Indigenous community well-being and the importance of geography—that is, the remoteness of Indigenous communities in Canada and implications for economic development. Third, it profiles Indigenous businesses and, entrepreneurship in Canada and community-led economic development. The chapter ends with a discussion of how Indigenous data could be improved in terms of data collection and dissemination, with a specific focus on understanding Indigenous businesses and economies.
Statistics construct a powerful reality and have numerous implications for how public policies are designed and delivered (Walter and Andersen, 1992[2]). The following chapter draws on data produced by Statistics Canada (Canada’s national statistical agency) and the Canadian Council for Aboriginal Business.
The manner in which Indigenous peoples are defined and enumerated differs greatly across countries. In Canada, Aboriginal peoples are defined in the Constitution Act as including the Indian, Inuit and Métis peoples of Canada (1982, Section 35/2). Aboriginal identity refers to whether the person identifies with the Aboriginal peoples of Canada. This includes those who are First Nations (North American Indian), Métis or Inuk (Inuit) and/or those who are Registered or Treaty Indians (that is, registered under the Indian Act of Canada), and/or those who have membership in a First Nation or Indian band. Aboriginal peoples of Canada are defined in the Constitution Act, 1982, Section 35 (2) as including the Indian, Inuit and Métis peoples of Canada.
Registered Indians are persons who are registered under the Indian Act of Canada. Treaty Indians are persons who belong to a First Nation or Indian band that signed a treaty with the Crown. Registered or Treaty Indians are sometimes also called Status Indians.
Membership in a First Nation or Indian band refers to whether or not a person is a member of a First Nation or Indian band. An Indian band is defined as a body of Indians for whose collective use and benefit lands have been set apart or money is held by the Crown, or who have been declared to be a band for the purpose of the Indian Act. Many Indian bands have elected to call themselves a First Nation and have changed their band name to reflect this. With the 1985 amendment to the Indian Act of Canada (Bill C-31), many Indian bands exercised the right to establish their own membership code, whereby it was not always necessary for a band member to be a Registered Indian according to the Indian Act.
Within Statistics Canada’s Canadian Census, Indigenous People are distinguished as Registered Indian, Métis, Non-Status Indian, Inuit and other Aboriginal (respondents who identify with more than one Indigenous group or as a Band member with no Aboriginal identity and no Registered Indian Status) (Statistics Canada, 2017[3]). Practices across government departments can differ. For example, ISC and CIRNAC do not use the same labels or even group definitions as Statistics Canada—e.g., Registered Indian vs. Status First Nations. Not all departments define groups in the same way, which can result in different statistics being reported.
As noted by Guimond et al. (2015[4]) there are ‘fuzzy group boundaries’ between definitions and there are in fact 15 different possible responses related to origin, covering single (e.g., North American Indian) and multiple (e.g., North American Indian and non-Aboriginal) responses. For example, in 2016 census question on Aboriginal identity provided eight possibilities: North American Indian, Métis, Inuit, non-Aboriginal and four multiple Aboriginal responses (e.g., North American Indian and Métis).
Sources: Statistics Canada (2018[5]), Definitions, Data Sources and Methods, https://www.statcan.gc.ca/eng/concepts/index (accessed on 17 December 2018); Statistics Canada (2017[3]), Aboriginal Peoples Reference Guide, Census of Population, 2016, https://www12.statcan.gc.ca/census-recensement/2016/ref/guides/009/98-500-x2016009-eng.cfm; Walter, M. and C. Andersen (1992[2]), Indigenous Statistics: A Quantitative Research Methodology, https://books.google.fr/books?hl=en&lr=&id=ycP_AAAAQBAJ&oi=fnd&pg=PA5&dq (accessed on 2 March 2018); Guimond, É., N. Robitaille and S. Senecal (2015[4]), “Fuzzy definitions and demographic explosion of Aboriginal populations in Canada from 1986 to 2006”, https://doi.org/10.1007/978-3-319-20095-8_12.
copy the linklink copied!Socio-economic and demographic profile of Indigenous Canadians
There are important differences between the three groups of Indigenous peoples—First Nations people, Métis and Inuit—in terms of history, socio economic outcomes, and the places where they reside. For First Nations, a further differentiation is whether individuals live on or off reserve. As such, disaggregation between First Nations people, Métis people and the Inuit is made wherever possible in this report.
It bears acknowledging that there are large number of in-depth studies on Indigenous socio-economic and demographic trends which highlight diverse experiences across Canada, both among and between Indigenous groups and peoples. Furthermore, there is a growing body of scholarship which examines the interconnectedness of social-economic outcomes with health, community wellbeing and historical and contemporary experiences of cultural suppression, racism and gender violence (Harper, Anita Olsen; Thompson, 2017[6]). This section provides but a brief overview of key socio-economic and demographic trends, informing subsequent chapters.
Population and demography
Canada has a diverse and growing Indigenous population
Around 1 670 000 individuals in Canada self-identify as Indigenous people, corresponding to 4.9% of the total population in 2016. Among the three groups, First Nations are the largest (at 60% out of total), followed by Métis (36%) and the Inuit population (4%).4 First Nations people, Métis and Inuit across Canada have diverse histories and cultures and speak numerous languages (around 70 as reported in the 2016 Census).
The First Nations population includes those who are members of a First Nation/Indian Band and those who are not, and those with or without registered or treaty Indian status under the Indian Act. There are more than 600 unique First Nations/Indian Bands in Canada. Around three-quarters (76.2%) of the people who self-identify as First Nation have registered or treaty Indian status (Statistics Canada, 2017[7]). Of those with registered or treaty Indian status, 44.2% lived on reserve in 2016 (Statistics Canada, 2017[7]). Both the on-reserve (+12.8%) and off-reserve (+49.1%) First Nations population grew from 2006 to 2016 (Statistics Canada, 2017[7]).
The Indigenous population represents a larger part of the total population in the West and North
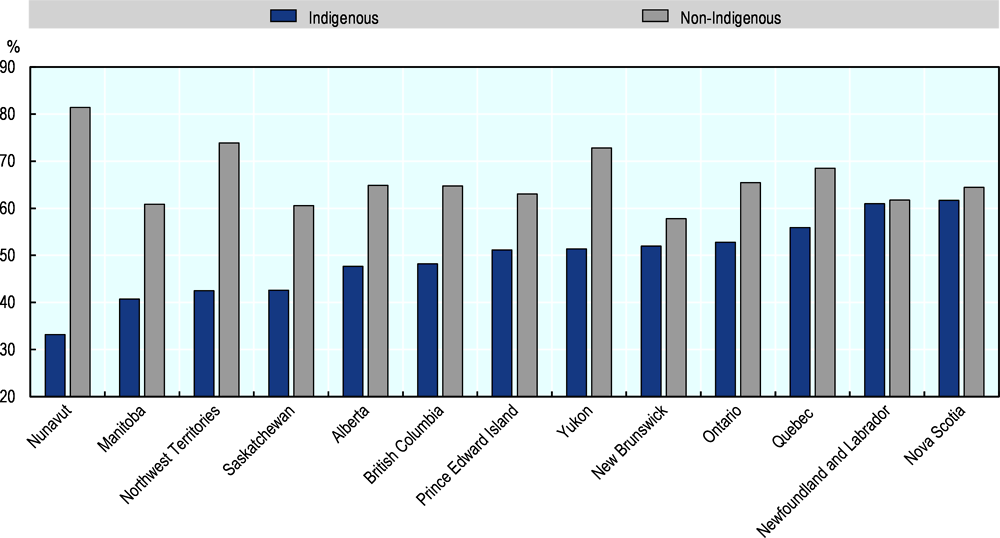
The Indigenous population is concentrated in certain provinces and territories across Canada ranging from as little as 2% of the population in Prince Edward Island (2 730 persons) to as much as 86% in Nunavut (30 545 persons) (Figure 2.1). Across Canada, the First Nations population is mostly concentrated in the western provinces; the majority of Métis reside in Ontario and the western provinces, largely in metropolitan areas; and three quarters of the Inuit reside in Inuit Nunangat (Statistics Canada, 2017[7]).5
Ontario has the largest Indigenous population in terms of total size; approximately 374 400 peoples in Ontario self-identified as Indigenous in 2016 (Statistics Canada, 2017[8]). Ontario is also the most populous province in Canada and as such, while large overall, the Indigenous population constitutes just 3 percent of the total population of the province. However, within the northern Ontario, the Indigenous population comprises 17% out of total (Statistics Canada, 2017[9]). Ontario is home to 127 federally recognised First Nations communities, 109 of which are in Northern Ontario, includes 34 remote reserves. Canada’s northern territories have the highest share of Indigenous population out of the total population, at 86% (Nunavut), 51% (Northwest Territories) and 23% (Yukon).
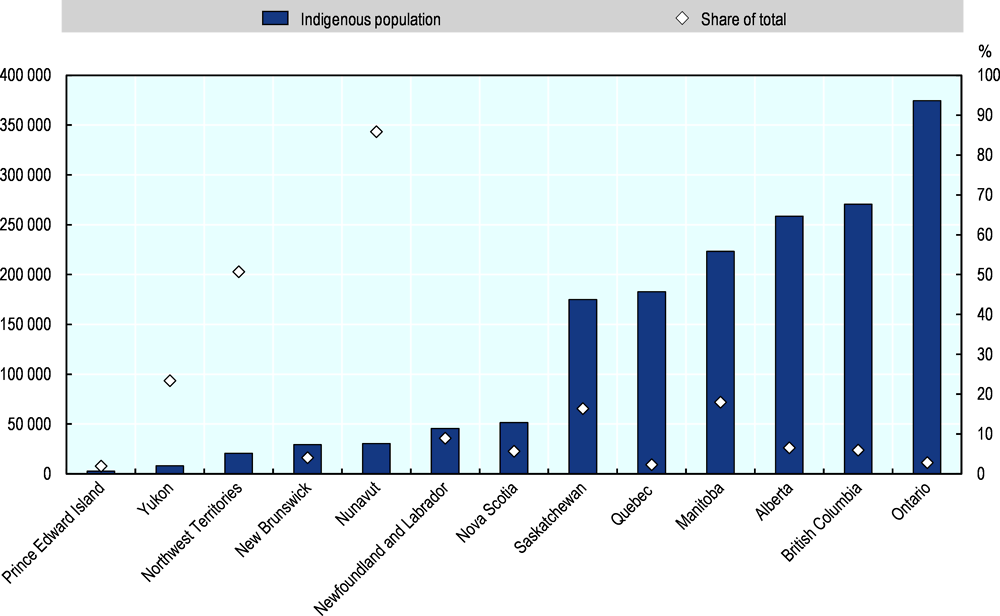
Note: Indigenous population includes individuals who have identified themselves as Indigenous in the 2016 Census of Population survey.
Source: Statistics Canada, (2016[10]), 2016 Census of Population.
Indigenous populations are experiencing a greater pace of demographic change than that of non-Indigenous populations in Canada (Statistics Canada, 2015[11]). From 2006 to 2016, the Indigenous population increased at four times the rate of the non-Indigenous population. Furthermore, the number of individuals who self-identify as Indigenous grew across all groups between 2001-2016: the Métis population doubled and the First Nations grew and Inuit populations grew by respectively by 60% and 44% (Figure 2.2).
The rapid population growth of Indigenous peoples can be explained by two factors. Firstly, Indigenous peoples tend to have higher fertility rates than non-Indigenous people, particularly in the case of First Nations people and Inuit.6 Secondly, response mobility played a key role in the demographic growth of non-Status First Nations and Métis population during 1996-2006 (Caron-Malenfant et al., 2014[12]) (Aboriginal Affairs and Northern Development, 2012[13]). Response mobility refers to the phenomenon where individuals changed their identity from one census to the other (intergenerational response mobility) and where ethnic identity of parents and child differ from each other.

Note: Figures refer to individuals who identified themselves as Indigenous (single identity).
Sources: Calculation based on data from Statistics Canada (2001[14]), 2001 Census of Population; Statistics Canada (2011[15]), 2011 National Household Survey; Statistics Canada, (2017[8]), 2016 Census Population Tabulations, https://www12.statcan.gc.ca/census-recensement/2016/dp-pd/index-eng.cfm.
The Indigenous population is predominantly rural and remote
Roughly 60% of Indigenous peoples lived in predominantly rural areas in 2016 (Statistics Canada, 2016[10]). This was 33% more than the share of non-Indigenous peoples living in predominantly rural regions (see Box 2.2 for an explanation on the OECD TL3 regional typology). In predominantly rural regions, 46% of the Indigenous peoples lived in rural remote regions and about 15% in rural regions close to cities. In contrast, 27% of the Indigenous peoples lived in predominantly urban regions in 2016. This was 30 percentage points less than the share of non-Indigenous Canadians living in predominantly urban regions. The shares of Indigenous and non-Indigenous peoples living in intermediate regions is quite similar; 14% of the Indigenous peoples lived in intermediate regions (2 percentage points less than non-Indigenous).
Low density and remote areas influence resident outcomes. These areas have less diversified economies, more limited access to services and educational opportunities, and face higher transportation costs. In many rural communities, costs of transportation are very high or even for some, precarious (e.g., remote fly-in communities which may only be accessible by winter road). Rurality and remoteness are correlated with such factors as lower labour market attachment, lower educational attainment rates and poorer health outcomes (OECD, 2016[16]).
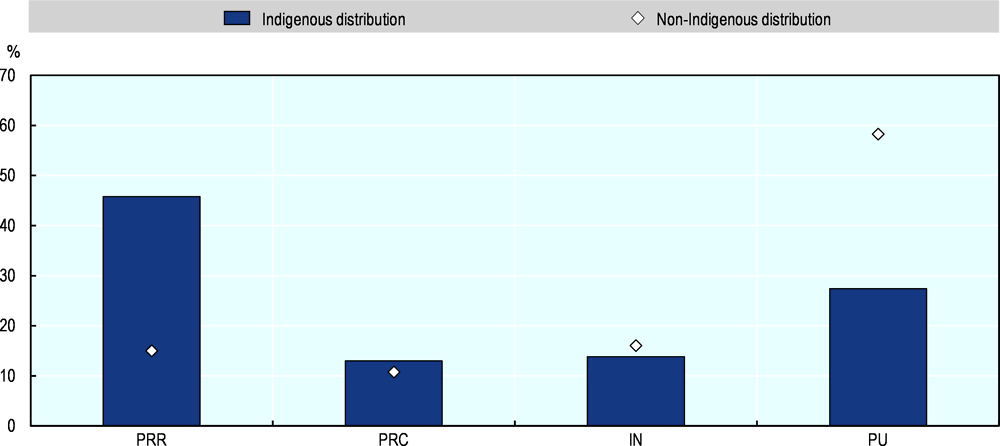
Note: Based on OECD TL3 regional typology: PRR: Predominantly rural remote; PRC: Predominantly rural close to city; IN: Intermediate; and PU: Predominantly urban.
Source: Statistics Canada (2016[10]), 2016 Census of Population.
While a large share of the Indigenous population lives in predominantly rural remote regions, these regions are also experiencing population decline in recent years. The share of Indigenous peoples in rural remote regions has gradually decreased from 63.8% to 59.9% between 2001 and 2011 and from 59.9% to 58.8% between 2011 and 2016 (Figure 2.4). In contrast, the share of Indigenous peoples in urban areas rose from 24.1% to 26.9% between 2001 and 2011 and to 27.4% 2016.
The demographic evolution of Indigenous and non-Indigenous people by type of region is in similar: rural regions are shrinking and urban regions are growing. However, population decline in rural regions is lower for Indigenous peoples than for non-Indigenous people. Response mobility plays a key role in shaping these trends for the Indigenous population. For example, the number of self-reported Métis population in Atlantic Canada experienced a meteoric surge in recent years, with Indigenous population growth rates as high as 237%, 199% and 198% in St. John's, Halifax and Moncton (Statistics Canada, 2017[7]).
The Aboriginal population is growing much faster than the non-Aboriginal population, especially in Canadian cities. From 1996 to 2006, ethnic mobility was the primary factor in that growth. This held true for the Métis in particular. Métis have typically been recognised as a mixed-descent identity—a feature which has been critiqued by some as leading to an ever widening racial category that undermines the Métis Nation as a self-governing Indigenous nation with associated rights (Andersen, 2014[17]).
In terms of geographical mobility (i.e., the movement of people from one place to another), it is important to note that the First Nations population continues to grow both on and off reserve. Therefore, while mobility contributes to some urban population growth, there is no widespread phenomenon of persons moving from reserves to cities (Statistics Canada, 2017[7]).

Note: Based on OECD TL3 typology containing four categories: predominantly urban (PU), intermediate (IN), predominantly rural close to a city (PRC) and predominantly rural remote. (PRR).
Sources: Calculation based on data from Statistics Canada (2001[14]), 2001 Census of Population; Statistics Canada (2011[15]), 2011 National Household Survey; Statistics Canada, (2017[8]), 2016 Census Population Tabulations, https://www12.statcan.gc.ca/census-recensement/2016/dp-pd/index-eng.cfm.
The OECD has developed a regional typology of Territorial Level 3 (TL3) regions to compare regional performance across member countries. The OECD taxonomy defines TL3 regions as predominantly urban (hereafter referred to as urban), intermediate and predominantly rural (hereafter referred to as rural). This taxonomy, established in 1991, is designed for facilitating international comparability of data. With this aim, it applies the same criterion and selects comparable units among OECD member countries. The OECD scheme distinguishes between two levels of geography within countries: a local community level and a regional level. Local communities are defined as basic administrative units or small statistical areas. They are classified as either rural or urban using a population density threshold. In a second step, TL3 regions, which correspond to larger administrative units or functional areas, are defined as predominantly urban, intermediate or rural with a criterion measuring the share of population living in rural communities.
The first step in the OECD territorial typology is that of classifying “local units” (administrative entities at a geographical level lower than TL3) as rural if their population density is below 150 inhabitants per km2. In a second step, the local units are aggregated into TL3 regions and classified as “predominantly urban”, “intermediate” and “predominantly rural” using the percentage of population living in rural local units. A third step takes into account possible reclassification of predominantly rural and intermediate units based on the population size of their main agglomeration.
Source: Brezzi, M., Dijkstra, L. and Ruiz, V. (2011[18]), “OECD Extended Regional Typology: The Economic Performance of Remote Rural Regions”, https://doi.org/10.1787/5kg6z83tw7f4-en.
The Indigenous population is younger on average…
Canada’s Indigenous population is younger on average than the non-Indigenous population (see Figure 2.5). The average age of the Indigenous population was 32.1 years in 2016 while the average age of non-Indigenous population was 40.9 years. Among the different Indigenous groups in Canada, Métis (34.7 years) are on average older than First Nations people (30.6 years) and Inuit (27.7), who are the youngest (Statistics Canada, 2017[19]).
The Indigenous population has a much higher share of children and youth than the non-Indigenous population. Indigenous children, aged 14 and under, represent almost one-third (27%) of the total Indigenous population while the corresponding figure of non-Indigenous peoples stands around 16%. In contrast, the share of the elderly population, aged 65 and above, represent much larger share of non-Indigenous population (16%) than Indigenous population (7%). The share of working age (15-64) of the Indigenous peoples is at the same level as the working age of non-Indigenous peoples; the Indigenous working age population is around one-percentage point smaller than the share of non-Indigenous working age population.

Note: Based on OECD TL3 typology: predominantly urban (PU) and predominantly rural (PR).
Source: Statistics Canada (2016[10]), 2016 Census of Population.
…particularly in rural areas
The Indigenous predominantly rural population is younger than the predominantly urban one (28% versus 24% for people aged 14 years and under), and has a slightly smaller working age population (64% versus 69%) and higher share of elderly persons (38% versus 31% aged over 65) (Figure 2.5). It is as yet unclear what the implications of these demographic and geographic trends will be for the future—e.g., whether younger populations on reserve will move to urban areas in the future or stay where they are leading to increases in the rural working age population. Regardless, Canada’s young Indigenous population will form an important part of the country’s future leaders, employees and entrepreneurs.
The Centre for the Study of Living Standards estimates that over the 2011-2036 period, the contribution of Aboriginal people to future labour force growth in Canada may be “as high as 21 per cent under the scenario that age-specific participation rates between Aboriginal and non-Aboriginal population close by 2036 and response mobility continues as current rates” (Drummond et al., 2017[20]). In terms of regional variations, this contribution may be as high as 83.1 per cent, 72.9 per cent and 52.2 per cent in the three territories (Yukon, Nunavut and Northwest Territories), Saskatchewan, and Manitoba, respectively (Drummond et al., 2017[20]).
While life expectancy is increasing across all Indigenous groups, it remains lower than the non-Indigenous population—by as much as 15 years
Life expectancy at birth, defined as the average number of years a new-born child would live if prevailing patterns of mortality at the time of its birth were to stay the same throughout their life. The life expectancy rates of Indigenous peoples in Canada are lower than that of non-Indigenous peoples in Canada for both men and women. In the case of Inuit men, life expectancy is 15 years lower than that of non-Indigenous men (Table 2.1). Across different Indigenous groups, Métis have the highest life expectancy rate (77 years), followed by First Nations (73 years) (Public Health Agency of Canada, 2017[21]).
Health is a crucial element of well-being. Good health enables individuals to participate in the activities that they value, and to pursue the lives that they want to live. Therefore, it affects people’s ability to take part in the formal and informal economy, acquire new skills and to live good quality lives. Across a wide range of indicators, the health of Indigenous peoples remains poorer than that of non-Indigenous Canadians with higher rates of infant mortality, suicides (particularly among youth), chronic diseases and infectious diseases, especially for those residing on reserves in rural areas (Richmond and Cook, 2016[22]). Self-assessed health status corroborates these disparities (Box 2.3).
The results from perceived health indicators align with the life expectancy rates. Indigenous peoples are less likely to report their health as very good or excellent than non-Indigenous peoples are (Gionet and Roshananfshar, 2013[23]). In 2012, 54% of the Indigenous peoples reported their health as excellent or very good, which is 10 percentage points lower than non-Indigenous peoples (Gionet and Roshananfshar, 2013[23]). Among different Indigenous groups, the Inuit were most likely to report health as excellent or very good (55%) and First Nations living on-reserve were less likely to report their health as excellent or very good (44%) (Gionet and Roshananfshar, 2013[23]). Worryingly, the health status of Indigenous adults has deteriorated from 2001 to 2012 while socioeconomic inequalities in health among Indigenous Canadians have increased between First Nations and Métis groups (Hajizadeh et al., 2018[24]).
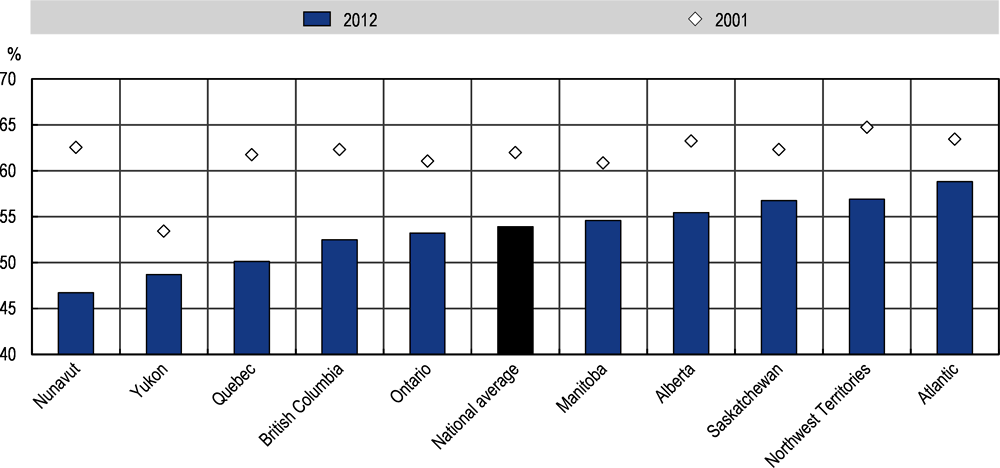
Note: Atlantic includes Newfoundland and Labrador, Prince Edward Island, Nova Scotia, and New Brunswick.
Sources: Statistics Canada (2019[25]), Perceived General Health by Aboriginal Identity, Table 41-10-0001-01, https://www150.statcan.gc.ca/t1/tbl1/en/tv.action?pid=4110000101; Gionet, L. and S. Roshananfshar (2013[23]), “Select health indicators of First Nations people living off reserve, Métis and Inuit”, in Health at a Glance; Hajizadeh, M. et al. (2018[24]), “Socioeconomic inequalities in health among Indigenous peoples living off-reserve in Canada: Trends and determinants”, https://doi.org/10.1016/J.HEALTHPOL.2018.06.011.
Education
Rates of educational attainment for Indigenous peoples are lowest for those residing in rural and remote areas
Levels of educational attainment strongly influence labour force participation. It is associated with better employment possibilities and higher incomes and other aspects of individuals’ well-being beyond material considerations. For instance, there is a positive relationship between better health outcomes and education as well as satisfaction in life in more generally.
Indigenous peoples in Canada have lower rates of educational attainment than their non-Indigenous peers and sizable literacy, numeracy and technology skill gaps, which impacts wages (Hu, Daley and Warman, 2017[26]). These gaps are greatest in the northern territories (Nunavut, Northwest Territories and Yukon) and also in the province of Alberta. It is estimated that the direct cumulative economic benefits to Canada of closing the Aboriginal educational attainment gap between 2011 and 2031 could be as large as $261 billion (Calver, 2015[27]).
Indigenous peoples across Canada face a number of barriers to accessing high quality education in the places where they live. Reflecting this, the educational attainment rate is lowest in rural and remote regions (at 43%), representing a gap of -14% when compared to non-Indigenous peers in these regions. According to the OECD regional TL3 typology, in rural regions close to cities, the rate of educational attainment of Indigenous persons is higher (at 51%) and the gap between Indigenous and non-Indigenous peers is narrowed (-0.8%). Rural and remote communities have more limited educational offerings and may require that students complete secondary schooling and higher in larger towns and cities. Such is the case for example for the remote fly-in community of Neskatanga First Nation in Ontario where children past the ages of grade 8 complete their studies in the city of Thunder Bay, often residing away from their parents to do so (300 kilometres away). Beyond remoteness, socioeconomic conditions, the use of a Eurocentric curriculum and the legacy of residential schools are other factors that have contributed this educational gap (Charbonneau, 2017[28]) (see Box 2.4 on residential schools in Canada).
Note: Educational attainment rate refers to individuals aged 15 years and over with at least secondary education completed.
Source: Statistics Canada, (2016[10]), 2016 Census of Population.
Indigenous peoples have made gains in high school and postsecondary completion in the past decade
The share of Indigenous persons obtaining a secondary degree or higher has increased over the past decade (2006-2016). The greatest increase in educational attainment rates of Indigenous peoples was reported in intermediate regions (6 percentage points) and in rural remote regions (5 percentage points). Respectively, the change in education rates in rural close to cities and urban areas has been a more moderate (3-4 percentage points). However, due to the change in educational attainment rates of non-Indigenous peoples, the gap in education between Indigenous and non-Indigenous peoples have remained unchangeable in rural remote and urban regions. In rural regions close to cities, the gap has reduced by 1 percentage points and increased by 1 percentage points in intermediate regions (between 2006-2016).
Data from the Aboriginal Peoples Survey (Aborigional Peoples Survey, 2017) provides additional context. It indicates that the percentage of the population that completed a postsecondary certificate diploma or degree was highest for the Métis (45%), followed by First Nations persons living off reserve (40%) and Inuit (28%). There is no data for First Nations persons living on reserve. This rate of completion increased for all groups between 2006-16, but was highest in the case of the Métis (increasing by 6%) followed by FN living off reserve (4%) and Inuit (3%). Meanwhile, the percentage with less than a high school diploma dropped in all cases by a similar amount (8-9 percentage points). Again, there is large variation between groups with the Inuit having the highest percentage of the population with less than a high school diploma (52% in 2016), followed by FN off reserve (32%) and Métis (25%).
Indigenous peoples in many countries across the OECD have suffered terribly under policies of assimilation wherein education has played a major role. In Canada, the residential schools system was central to this policy. As noted in the very first paragraph of the Introduction to the 2015 Summary Report of the Truth and Reconciliation Commission published in 2015:
For over a century, the central goals of Canada’s Aboriginal policy were to eliminate Aboriginal governments; ignore Aboriginal rights; terminate the Treaties; and, through a process of assimilation, cause Aboriginal peoples to cease to exist as distinct legal, social, cultural, religious, and racial entities in Canada. The establishment and operation of residential schools were a central element of this policy, which can best be described as “cultural genocide.” (Truth and Reconciliation Commission of Canada, 2015[30])
At least 150 000 First Nation, Métis, and Inuit students passed through residential schools in Canada. They were run by church denominations (mainly Roman Catholic, Anglican, United, Methodist and Presbyterian), and the government’s partnership with them remained in place until the late 1960s. Most of these schools had closed by the 1980s, although the last federally supported residential schools remained in operation until the mid-1990s.
In 2015. The Canadian Government pledged to immediately move to implement all 94 Calls to Action of the Truth and Reconciliation Commission and to make new investments in First Nations education and to enter into detailed negotiations with Indigenous peoples (Truth and Reconciliation Commission of Canada, 2015[31]). Those Calls to Action include following basic equalising measures to address gaps in educational attainment and funding. They also include a call to better reflect Indigenous pedagogies, histories and knowledge in Canadian curriculum.
Sources: OECD (2017[32]), “Indigenous peoples and education in participating Canadian provinces and territories”, https://doi.org/10.1787/9789264279421-5-en; Truth and Reconciliation Commission of Canada (2015[31]), Truth and Reconciliation Commission of Canada: Calls to Action, http://www.trc.ca/websites/trcinstitution/File/2015/Findings/Calls_to_Action_English2.pdf (accessed on 20 December 2018); Truth and Reconciliation Commission of Canada (2015[30]), Honouring the Truth, Reconciling for the Future Honouring the Truth, Reconciling for the Future Summary of the Final Report of the Truth and Reconciliation Commission of Canada, http://www.trc.ca/websites/trcinstitution/File/2015/Findings/Exec_Summary_2015_05_31_web_o.pdf (accessed on 20 December 2018).
Income
Earnings gaps persist and are highest in the northern territories
The persistent and large gaps in average income between Indigenous and non-Indigenous peoples are well documented (Maxim et al., 2008[33]). These differences are partly explained by lower Indigenous labour market force participation rates, lower rates of educational attainment, higher unemployment rates and higher rates of participation in the informal economy (e.g., the social and subsistence economy) (Natcher, 2018[34]).7 Geography also plays a role, with there being fewer employment options for those residing in rural and remote areas. The NAEDB estimates that the economic loss resulting from the gaps in economic outcomes between Indigenous and Non-Indigenous Canadians is as much as $27.7 CAN billion annually (equivalent to around 1.5% of the Canadian economy) (National Aboriginal Economic Development Board, 2017[35]).
Income gaps vary by region across Canada and are largest in the northern territories (Nunavut, the Yukon and the Northwest Territories). Employment in the northern territories are concentrated in the public sector and in the mining, oil and gas extraction industries. These jobs are frequently filled by those from out-of-province and have higher than average salaries to attract mobile labour and expertise. In terms of income gaps, Nunavut stands out; the median after tax income of the non-Indigenous population is significantly higher than that of the Indigenous population (approximately $84 000 versus $23 000). This is partly explained by the prevalence of public service employment, which is the largest source of employment in Canada’s most recently established territory (est. 1999). Of all government employees in Nunavut, just over half were Inuit (52%) in 2017; this is significantly below the share of the Inuit population in the territory overall (86% of total population) (Nunavut Statistics, 2018[36]). It is an ongoing goal of the Nunavut government to increase the share of Indigenous employment in the public service to better reflect the society it serves.

Note: Median after-tax income for individuals ages 15 years and over.
Source: Statistics Canada (2016[10]), 2016 Census of Population, Catalogue no. 98-400-X2016170.
First Nations incomes are lowest on-reserve
Among Indigenous populations, First Nations people living on-reserve experience the largest earnings disparity, followed by males who identify as First Nations and live off-reserve (Lamb, Yap and Turk, 2018[37]). Off-reserve First Nations incomes are higher than those on-reserve. While on-reserve First Nations had a median after tax income of income of $18 222 in 2015, off-reserve First Nations had a median after tax income of $30,983 (Statistics Canada, 2018[38]). This can be due to a range of factors including a lack of access to markets and capital. But the historical legacies of the 1876 Indian Act also loom large. The Indian Act gave the government control of First Nation economic and resource development and land use and treated First Nation peoples as "wards of the state.” It is only in recent decades that this is changing and that First Nations are gaining control over their resources and lands, generating improved employment opportunities on reserve.
Related to this, Indigenous populations face higher rates of relative poverty, especially young First Nations people on reserve. Four out of every five First Nation reserves have median incomes that falls below the poverty line.8

Source: OECD (2018[39]), “Percentage of Indigenous People in each income decile group (after-tax), 2016”, https://doi.org/10.1787/9789264300477-graph14-en.
Non-market activities are also important
Market activities capture just one part of Indigenous income and material wellbeing; informal and subsistence-based economies also play an important role. This may include exchanging services and skills without monetary compensation alongside household provisioning such as harvesting, processing and sharing food. These activities are often characterised as meeting the basic needs of households—however, they may also fill broader cultural and spiritual roles, reinforcing Indigenous knowledge and links to kinship and community (Natcher, 2018[40]; Simpson, 2018[41]).
Canada’s Aboriginal Peoples Survey provides some indication of the importance of informal and subsistence based activities, termed “other labour activities” in the survey.9 Most (59%) First Nations people living off reserve and Métis over the age of 15 reported participating in other labour activities during the year. In order of prevalence these activities include: hunting, fishing or trapping; gathering wild plants; making clothes or footwear; making carvings, drawings, jewellery or other kinds of artwork (Statistics Canada, 2018[42]).
These types of activities are particularly important for the Inuit, most of whom reside in Inuit Nunangat where there is extreme cold for much of the year, high food prices and high rates of food insecurity (Huet, Rosol and Egeland, 2012[43]). Over three quarters (78%) of Inuit aged 15 or older participated in other labour activities during the past year with around 16% undertaking these activities to supplement their income. Over half (56%) reported hunting, fishing and trapping in the past year and 42% gathered wild plants. Making clothes or footwear and making carvings, drawings, jewellery or other kinds of artwork was also common (27% and 18%) respectively (Statistics Canada, 2018[44]).
Labour market participation
Indigenous labour market outcomes are poorest in northern and remote areas
The Indigenous population in Canada has historically had lower labour force participation and employment rates, and a higher unemployment rate than the non-Indigenous population. These gaps in employment rates between Indigenous and non-Indigenous populations in Canada are lowest in the Atlantic Provinces and the greatest in the northern territories (Nunavut, North West Territories, and Yukon) (Figure 2.10). Geography and accessibility influence these outcomes, with Indigenous persons living in remote northern locations having fewer employment opportunities than those nearer urban agglomerations which have more diversified economies. Among Indigenous groups, the employment rate of Métis was the highest, followed by Inuit and First Nations peoples (Statistics Canada, 2017[8]).

Note: Employment rate refers to employed population aged 15 years and over.
Source: Statistics Canada (2016[10]), 2016 Census of Population.
Indigenous employment was severely impacted by the 2008 economic recession
The employment rates of Indigenous people residing in predominantly rural regions in Canada ranged from 46% to 56% in 2016 (Statistics Canada, 2017[8]). Among these, the employment rate of Indigenous people residing in rural regions close to cities was 10 percentage points higher than those in rural remote regions. Employment rate of Indigenous peoples in urban areas stood at 58% in 2016 and the gap between Indigenous people and non-Indigenous people is much lower than in rural regions (at 4 percentage points) (Statistics Canada, 2017[8]).
The employment rates of Indigenous peoples decreased over the past decade and Indigenous people were more severely affected by the 2008 economic recession. The largest decrease is recorded in rural regions close to cities where Indigenous peoples’ employment rates decreased from 60% to 56% in 2006-2016. Similarly, the employment rate of Indigenous peoples in urban regions decreased from 61% to 58% over the same period (Statistics Canada, 2017[8]).
The change has been more moderate in rural remote and intermediate regions. On average, the employment rate decreased from 48% to 46% in rural remote regions and from 55% to 54% in intermediate regions between 2006-2016. An identical pattern is detected when looking at the change of employment rates of non-Indigenous peoples. In rural remote and urban regions the employment rate of non-Indigenous peoples decreased by 2 percentage points (from 59% to 57% and from 64% to 64%) and in rural regions close to cities the decrease was 3 percentage points (from 63% to 60%) between 2006-2016 (Statistics Canada, 2017[8]).
The unemployment rate of Indigenous peoples by province/territory varies from 12.7% to 27.6% (see Figure 2.10). Indigenous peoples in rural remote regions are more likely to report unemployment than Indigenous peoples in other regions. These trends correspond to the unemployment patterns of non-Indigenous peoples; non-Indigenous peoples in rural remote regions have the highest unemployment rate (9%) while those living in urban regions have the lowest (7%) (2016) (Statistics Canada, 2017[8]). The difference in the unemployment rate between Indigenous and non-Indigenous peoples is the largest in rural remote areas, where the unemployment rate of Indigenous peoples is 19% and the unemployment rate of non-Indigenous peoples is 9%, and smallest in urban region, where the unemployment rate of Indigenous peoples is 12% and non-Indigenous peoples is 7%.
Between 2006-2016, the unemployment rate of Indigenous peoples increased. In urban regions, the unemployment rate increased from 10% to 12%; in rural regions close to cities from 11% to 13%; while in rural remote regions, the unemployment rate of Indigenous peoples has remained the same at 19% (Statistics Canada, 2017[8]). Overall, individuals living in rural regions of Canada have lower rates of educational attainment and poorer labour market outcomes. Moreover, inequalities between on-reserve First Nations populations and other communities in Canada have been reported in educational outcomes, housing quality, poverty and health services, among others.
A shortage of jobs was the most commonly self-reported barrier to employment
Responses from the 2017 Aboriginal Peoples Survey illuminate self-reported barriers to finding employment. For all groups surveyed (Métis, Inuit and FN living off reserve), a shortage of jobs was the most commonly reported barrier to employment. Beyond this, there are differences revealed by age and gender. For example, younger Inuit were more likely to report not knowing where to look for work and not know what kind of job to look for than those of core working age. A lack of work experience was another commonly reported barrier to employment among Inuit surveyed. This highlights the importance of labour market training and assistance and job training/work experience.
Similarly, young FNs living off reserve self-reported a lack of work experience and not knowing where to find jobs as a major barrier; also, about half of women (51%) and 40% of men reported that not having enough education or training for available work made it difficult to find work. First Nations people in Saskatchewan (51%) and British Columbia (44%) were more likely to report that not having the means of transportation to get to available jobs caused them difficulty in finding work than those in Atlantic Canada (28%E), Quebec (29%) and Ontario (33%). Métis self-reported similar obstacles to employment to that of FN living off reserve and Inuit, citing a lack of work experience and not enough education and training as common barriers.
Data from the 2011 National Household Survey (NHS) indicates that Aboriginal workers with higher levels of education (bachelor degree or higher) were less likely to be overqualified than their non-Aboriginal counterparts; but Aboriginal workers with lower levels of education (less than university level) were more likely to be overqualified than non-Aboriginal workers (Park, 2018[45]).
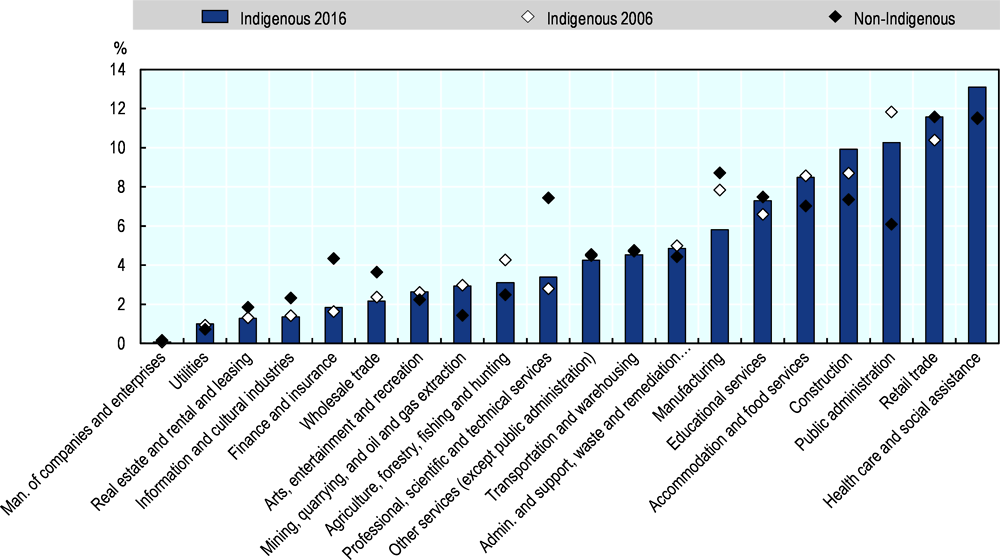
Indigenous peoples have higher propensities for employment in health care, social assistance and public administration than non-Indigenous persons; but they are underrepresented in business services and manufacturing
The top three industries where Indigenous peoples are employed are health care and social assistance (13%), retail trade (12%) and public administration (10%) (Figure 2.11). Indigenous people are more likely to be employed in the health care and social assistance sectors, and in public administration, construction and accommodation and food industries than non-Indigenous people. The share of Indigenous employment in public administration is particularly high compared to non-Indigenous (at 10% versus 6%). Two factors explain this. Firstly, public administration employment is highest in the northern territories, which is mostly covered by modern treaties, and many First Nations in the Northern territories also have self-government agreements. Secondly, Indigenous peoples are underrepresented in "knowledge industries"—e.g., professional, managerial and technical occupations—which tend to require post-secondary education and generally pay better. In this category, there is a 4-percentage point gap between Indigenous and non-Indigenous peoples.
Note: Industry by North American Industry Classification System (NAICS).
Source: Statistics Canada (2016[10]), 2016 Census of Population.
Between 2006-2016, Indigenous employment in the public administration, and agriculture, forestry, fishing and hunting sectors increased at a national level. In contrast, the Indigenous employment rate in tertiary sectors such as health care and social assistance and retail trade declined between 2006 and 2016.
At the occupational level, the Indigenous population has the highest share of employment in sales and service occupations (27%), followed by trades transport and equipment operators (19%), and education, law and social and community government services (14%). The share of employment in these occupational categories is slightly higher than that of the non-Indigenous population (24%, 14% and 12% respectively). As noted above, Indigenous peoples are underrepresented in knowledge professions including business, finance and administration and management and natural and applied sciences in comparison to non-Indigenous shares of employment in these occupations (Figure 2.12).

Note: Employment by National Occupational Classification (NOC).
Source: OECD (2018[46]), “Employment distribution of the Indigenous and non-Indigenous identity populations by occupation, persons aged 15 and older, %, 2016”, https://doi.org/10.1787/9789264300477-graph12-en.
Rates of self-employment among Métis are almost double the Canadian average
In 2016, 85% of Métis worked in a permanent job and of these, 14% reported being self-employed (Statistics Canada, 2017[47]). This rate of self-employment is significantly higher than that of the Canadian average (at 8.3%) and stands out above that of FN living off reserve (11% self-employed) and Inuit self-employment (6%). Of those that were self-employed, 43% owned an incorporated business and over a third of self-employed persons had employees. In contrast, rates of incorporation and employees are lower for FN living off reserve and Inuit.
The vast majority of Indigenous self-employed did not receive outside assistance for their businesses in 2017; 91% of Métis did not receive outside assistance for their business, while for FN living off reserve and Inuit this figure stood at 88% and 72% respectively (Statistics Canada, 2017[47]). Where individuals did receive outside assistance, their sources differ. For example, Métis were mostly likely to use private banks, while FN off reserve were most likely to receive assistance from an Aboriginal Government, Aboriginal organisation, or Aboriginal financial institution.
Community well-being
Indigenous communities have systematically lower level of community well-being than non-Indigenous ones
Well-being has gained attention as a regional development policy concept because it captures a number of factors that are important to the competitiveness of places, and helps to reinforce the importance of complementarities between different sectoral policies.
Indigenous Services Canada (ISC) has developed a Community Well-Being Index that measures the well-being of Indigenous (namely First Nations and Inuit) and non-Indigenous communities across Canada. It is based on the United Nations Development Programme’s Human Development Index (HDI) and it encompasses indicators such as education, labour force activity, income and housing, leaving out indicators measuring the level of social capital or environmental factors.
Communities are scored based on how they perform in these socio-economic indicators for years 1981-2016 (5-year periods). Prior to its first release, there was no method in place to track the level and development/ progress of Indigenous community socio-economic well-being. The community well-being index is the first attempt to measure systematically Indigenous well-being at a community level in Canada.
On average, results from the community well-being index demonstrate that Indigenous communities have systematically lower scores than non-Indigenous peoples with respect to income, education, housing and labour market outcomes. In 2016, the average Indigenous communities index score (the average of First Nation and Inuit communities’ score) was 58.6; this is 18.9 lower than the index of non-Indigenous communities. At the national level, the greatest differences are found in the indicator for housing where the difference between Indigenous and non-Indigenous communities is around 27.1 points. Differences in income are also large (21.9). Indigenous communities have the smallest difference to non-Indigenous communities in labour force participation (15.9).
When comparing the community well-being index of First Nations and Inuit communities at a national level, the results that Inuit Communities have 4.7 higher score than First Nation Communities (35.5). However, there are dimensions, in which First Nations communities tend to perform slightly better than Inuit communities (e.g. education and housing). Inuit communities have generally higher levels of incomes (67.8) and higher rates of labour force participation (75.6) than First Nations communities (53.5 and 69.2).
Indigenous community well-being improved between 1981-2016
The Community Well-being Index (CWB) for Indigenous communities has improved in the past decades. In 2011-16, the CWB index improved for Indigenous communities in general by 1.9 percentage points. In this time, the change of CWB was greater in Inuit communities than in First Nations communities. The CWB index for Inuit communities increased by 3.7 from 36.5 to 40.2, whereas the increase in the CWB index of First Nations Communities was 0.9 points lower. When considering non-Indigenous communities, the Community Well-being Index increased by 2.4 in 2011-16. Generally, Inuit communities have a higher index rating than First Nations communities (on average 4 percentage points).
Despite of the improvements in the overall index scores for Indigenous communities, the gap to non-Indigenous communities have not narrowed. In fact, the gaps for all four components had widened. The widened gap is a result of higher growth rates of the components for non-Indigenous communities.

Source: Indigenous and Northern Affairs Canada (2019[49]), The Community Well-Being (CWB) Index, https://open.canada.ca/data/en/dataset/56578f58-a775-44ea-9cc5-9bf7c78410e6 (accessed on 19 September 2018); 2016. See: Resource Development and Well-being in Northern Canada https://www.iap-socent.be/sites/default/files/ANSERJ%20%2807%29%20104-123.pdf.
Between 2008-2010, the First Nations Information Governance Centre (Ottawa, Ontario) produced a follow up survey to the First national Regional Health Survey focused on community well-being. This survey provides another source of data through which to understand well-being on First Nations communities. Some of the highlights from this work include:
-
Communities are affected by chemical and environmental hazards. 10% of communities indicated being within 100 kilometres of an oil refinery and 11% reported being within 100 kilometres of a chemical factory. More than one-in-three communities indicated experiencing an environmental hazard in the past 5 years, including flooding (40%) and forest fires (33%).
-
Housing shortages are widespread. 94% of communities have a waiting list for housing (80% of which is for at least 2 years). At least one-third of communities report that not all community homes have electricity or indoor plumbing.
-
Nutrition and healthy eating programs are common, but access to healthy food remains a challenge. One out of five communities report not having a store within 20 kilometres where fresh food can be purchased.
-
Band employment predominates. 8 out of 10 jobs involve working for the First Nations band. The majority of residents who complete college and university (60%) did not to return to work in the community.
-
The majority of communities have access to an early childhood program and childcare within the community. The majority of communities (76%) have at least one school the majority of which (86%) are controlled and managed by the First Nation. Of those with one school, 17% offer education up to junior high level (grades 7-8) and 37% offer education up to grade 12. Almost all (91%) offer First Nations language training and First Nations culture and traditions in the curriculum.
-
Health services are focussed on prevention. The majority of communities offered health services oriented toward prevention, such as diabetes prevention (93%), pre/postnatal care (90.0%), foetal alcohol syndrome prevention and awareness (79%), HIV/AIDS prevention and awareness (77%), and suicide prevention (76%). The majority of communities did not have a hospital (2.5%); just over half (56%) reported that an external hospital was within 50 kilometres; while over a quarter (27%) reported that the nearest hospital was more than 100 kilometres away Approximately three out of four communities (71%) indicated that the First Nations managed and controlled its own local health care centre, nursing station, health station, or health office.
-
The majority of the sample communities (86%) reported that they administered their own income support programs. However, only one-in-three communities have developed their own policies related to income support (34%). At least half of communities (51%) reported that the average length of income support was for 4 or more years. More than half of First Nations communities have services and programs targeted for youth. Approximately one in five communities (21%) indicated having a safe care area, such as a shelter or transition home for victims of violence.
-
Cultural Identity: Many communities have avenues for community members to improve, learn or re-learn their First Nations language. Most commonly language training and immersion took place in schools (69%); however, approximately one-third (39%) of communities indicated offering First Nations language classes for adults. Cultural activities were more common than language classes; 91% of communities reported that they arrange traditional cultural activities such as powwows, feasts, or potlatches.
-
A third of all communities have least one self-governance agreement. Of those communities with an agreement, the majority indicated agreements for self-governance of government, education and land management. A higher proportion of communities indicated that they are currently negotiating at least one self-government agreements (48%). More than half of responding communities indicated that they have delegated its government authority to another body within the First Nations. The majority of communities (81.7%) indicated that the First Nation Council/government provides members with regular updates on Chief and Council activity (e.g., activities). A minority of First Nations Council/government councillors/members and Chiefs were female: 89% of communities had 3 or fewer female/government members and 15% of communities had a female chief (leader of the community).
Source: First Nations Information Governance Center (2015[50]), Placing Individual Health in Context: Report of the 2008/10 RHS Community Survey, https://fnigc.ca/sites/default/files/docs/report_of_the_2008_10_rhs_community_survey_revised_july_2015.pdf.
Subjective assessments of well-being highlight the importance of social, cultural and land use issues for First Nations
Empirical assessments of wellbeing can be complemented by subjective assessments—that is, how community members themselves perceive their well-being. A study by Kant et. al (2014[51]) of multi-domain subjective well-being of two Canadian First Nations communities highlights the importance of considering both approaches. Through a structured questionnaire administered to households, community members themselves identified key domains of well-being and contributing factors, and helped specify models linking overall well-being, domains’ satisfactions and contributing factors (Kant et al., 2014[51]). The social, cultural, and land use (SCLU) domain was found to be the most important contributor to well-being, and SCLU factors contributed to all other domains’—Education, Employment, Income, Health, and Housing—satisfactions. Within this key domain, land laws, traditional diets, social ties, and cultural sites were viewed as critical elements.
Social, cultural and land use factors are not included in CIRNAC’s Community Well-being Index; this is perhaps in part because these indicators can be more difficult to measure. However, as the study by Kant et. al. (2014[51]) demonstrate, these factors are deemed to be of highest importance by community members themselves.
Many Indigenous communities face infrastructure deficits and poor housing conditions, particularly those that are rural and remote
Infrastructure—transportation, energy, telecommunications, housing, health and education infrastructure and vital amenities like sewage and water—are fundamental to a community’s well-being and its prospects for economic development. As large landmass with relatively low population density and cold winters, Canada faces a number of infrastructure challenges, particularly in small, rural and remote communities.10 Indigenous peoples, notably First Nations living on reserve and remote Inuit communities, disproportionality face inadequate infrastructure.
A Canada-wide picture of the extent of this infrastructure deficit for Indigenous communities is not available; however, separate studies indicate the scope of the problem. For example:
-
Data from Indigenous communities energy database reveals 70% rely on Diesel fuel generation which is unpredictable and expensive (Natural Resources Canada, 2019[52]).11
-
First Nations communities are 90 times more likely to be without piped water (United Nations, 2009[53]) and half of the water systems on First Nations reserves pose a medium or high health risk to their users (Webster, 2015[54]) (see Box 2.6 for discussion).
-
A reported 40% of Indigenous peoples living in Canada's far north reside in overcrowded households and mould is a frequent problem (Webster, 2015[54]).
-
8% of adults living on-reserve in 2008–2010 lacked any type of sanitation system (FNIGC, 2011[55]).
Of the 100 lowest ranking communities in the Community Wellbeing Index, 98 are First Nations communities. Inadequate infrastructure including overcrowded and mould-ridden housing, unsafe water systems, expensive and unpredictable energy infrastructure are major factors contributing to these low rankings (Webster, 2015[54]).
Homes in First Nations communities are 90 times more likely to be without piped water, and even communities with updated drinking water treatment systems experience frequent drinking water advisories (United Nations, 2009[53]). As of October 2018, there were 67 long-term drinking water advisories (DWAs) and 43 short-term ones for First Nations communities across Canada, excluding the territories and British Columbia (Government of Canada, 2018[56]). DWAs are issued as a preventive measure to protect public health and can be in the form of a boil water advisory (BWA), do not consume (DNC) or do not use (DNU), although BWAs are by far the most common. Although some DWAs are only in place for a day to allow for maintenance or repairs, others can be in effect for years due to problematic treatment systems, poor source water quality, lack of trained operators or damaged infrastructure (Murphy et al., 2016[57]).
The complex governance structures surrounding First Nations in Canada hinders the ability to implement significant change (Morrison, Bradford and Bharadwaj, 2015[58]). In non-First Nations communities, water and wastewater operations are regulated by provincial or territorial governments, and generally administered by municipalities, which own the majority of public water systems and charge residents fees. But on reserves this is a shared responsibility between the First Nations community (Band Councils) and the federal government (ISC/CIRNAC, Health Canada and Environment and Climate Change Canada). Band Councils must ensure that water services follow protocols for the design, construction, maintenance and operation of facilities and are responsible for routine testing and sampling of drinking water. CIRNAC is responsible for funding the capital cost of the treatment and distributions systems, as well as a portion of the operating and maintenance. It can be challenging for First Nations to have the technical capacities on site to manage water utilities; moreover, in some cases, the water infrastructure is simply inadequate and requires capital investments.
The government of Canada has pledged to lift all long-term drinking water advisories by March 2021 (Government of Canada, 2018[59]). Progress has been made in 2018 in reducing the number of communities facing boil-water advisories; and yet, as these advisories are lifted in some communities, more are added to the list. Ensuring that First Nations have reliable access to clean water demands both investments in operations (skills training, recruitment and retention of operators) and ongoing capital investments.
Sources: Government of Canada (2018[59]), Ending Long-term Drinking Water Advisories, https://www.sac-isc.gc.ca/eng/1506514143353/1533317130660 (accessed on 11 October 2018); Thompson, E., Y. Post and E. McBean (2017[60]), “A decade of drinking water advisories: Historical evidence of frequency, duration and causes”, https://doi.org/10.1080/07011784.2017.1387609; Morrison, A., L. Bradford and L. Bharadwaj (2015[58]), “Quantifiable progress of the First Nations Water Management Strategy, 2001-2013: Ready for regulation?”, https://doi.org/10.1080/07011784.2015.1080124; United Nations (2009[53]), State of the World’s Indigenous Peoples, https://books.google.fr/books?hl=en&lr=&id=ko109fkqEGUC&oi (accessed on 11 October 2018); Government of Canada (2018[59]), Ending Long-term Drinking Water Advisories, https://www.sac-isc.gc.ca/eng/1506514143353/1533317130660 (accessed on 11 October 2018); Government of Canada (2018[56]), Short-term Drinking Water Advisories, https://www.canada.ca/en/indigenous-services-canada/services/short-term-drinking-water-advisories-first-nations-south-60.html (accessed on 11 October 2018); Murphy, H. et al. (2016[57]); “Using decision trees to predict drinking water advisories in small water systems”, https://doi.org/10.5942/jawwa.2016.108.0008.
Canada’s commitment to achieving the United Nations’ 2030 Agenda for Sustainable Development presents an opportunity to improve Indigenous community well-being indicators
The government of Canada is committed to implementing the 2030 Agenda which includes commitments to eradicating global poverty, achieving gender equality, fostering economic growth, protecting the environment, and building effective, accountable, and transparent institutions, among other objectives. Five federal organisations have been assigned the lead on coordinated efforts to implement the 2030 Agenda; CIRNAC is one of these lead departments. It is responsible for supporting Indigenous peoples and the North in the implementation of the sustainable development goals that are directly linked to its mandate.
To date CIRNAC has matched a sample of its priorities with 16 sustainable development goals, including some targets (Office of the Auditor General of Canada, 2018[61]). As reported in the 2018 Auditor General of Canada’s 2018 spring report, Canada is presently ill-prepared to track and monitor the implementation of the SDG targets. For example, the report finds that: sustainable development is narrowly defined; there is no federal governance structure in place that articulates roles and responsibilities between departments; there is no federal communications plan or engagement strategy; there is no national implementation plan and few targets; and there is no system to measure results or progress toward national targets (Office of the Auditor General of Canada, 2018[61]). The respective lead departments have committed to progress on developing a coordinated response across all of these areas. Given the large differences in socio-economic outcomes between Indigenous and non-Indigenous communities, the SDG targets present an opportunity to development robust indicators drawing on data from across multiple departments.
Community accessibility
Approximately 46% of Indigenous peoples lived in predominantly rural remote regions in Canada and that those Indigenous peoples in remote regions are worse off in terms of socio-economic factors than Indigenous peoples living urban regions. Empirical evidence has explained regional differences in socio-economic outcomes by geography. It has been recognised that proximity to economic activities plays a key role in shaping a region’s socio-economic opportunities (Alasia et al., 2017[62]). Remote communities face much higher transportation costs which impacts a wide range of factors from the accessibility of services to the cost of doing business. It also impacts the delivery of basic community infrastructure.

Notes: Data for Indigenous Communities excludes Métis Communities. The concepts and methodology of the remoteness index are presented in the following working paper: Alasia et al. (2017[58]).
Source: Elaboration based on data provided by Statistics Canada on 27 September 2018.
Statistics Canada in close collaboration with ISC/CIRNAC has developed an index of remoteness for Canadian communities. The index measures the proximity to centres of economic activity, and accounts for the proximity to and the size of the population agglomerations as well as for actual travel costs by different modes of transportation and their seasonal availability. A comparison across Indigenous groups reveals that Inuit communities have the highest median remoteness index across all groups. Compared to First Nations, the median index of Inuit communities is about 40 index points higher, while it is about 50 index points higher compared to the median index for non-Indigenous communities. This comes as no surprise since approximately 73% of the Inuit population is located in northern parts in Canada with no or limited access to national road network Inuit Nunangat (Inuit regions). In fact, 38 out of 46 Inuit communities are accessible only by air transportation.
When looking at how remoteness index varies among communities, it becomes apparent that the variation observed between Indigenous communities is wider than the variation observed between non-Indigenous communities. The standard deviation of Indigenous communities is 0.19 index points which is 0.04 index points higher than the variation of non-Indigenous communities. The standard deviation summarises the distribution of remoteness index of communities in a single figure. By this measure, the smallest variation in remoteness index is found in Inuit communities with standard deviation of 0.146 index points. Once again this is not surprising, as a majority of the Inuit population is concentrated in specific regions in Canada. First Nations communities has the highest variation of the remoteness index (0.18).
More accessible Indigenous communities have higher levels of well-being, as shown by the correlation between the remoteness index and community well-being (Figure 2.16). The same holds for non-indigenous communities although in this case the association is stronger: the correlation between community well-being and remoteness is relatively small for Indigenous communities (-0.30) and moderate in the case of non-Indigenous ones (-0.38). The comparison between remoteness and community well-being also makes evident that Indigenous communities have high level of remoteness associated with low levels of well-being at levels not observed for non-indigenous communities. In other words, there is no non-indigenous counterpart in terms of the most remote Indigenous communities and communities with the lowest levels of well-being.
Similar trends can be observed, when looking at the correlations between CWB and RI within Indigenous communities. Both cases show a negative linear relationship (Figure 2.16). The Pierson’s coefficient measure reveals a moderate correlation for Inuit and First Nations communities (-0.34 and -0.36 respectively).
In terms of median distance to the closest city, the average median travel time to a closest city in predominantly rural remote regions is 514 minutes. However, travel time does not provide an adequate measure of proximity when comparing communities having no or limited access to the road network, with those connected to the main road network. For instance, the northernmost territory Nunavut is not connected to the mainland by roads and therefor the only option to travel is by airway or sea. Air travel in the north is expensive and often disrupted due to weather conditions in the winter months.

Notes: Data for Indigenous Communities is excludes Métis Communities. The concepts and methodology of the remoteness index are presented in the following working paper: Alasia et al. (2017[58]).
Sources: Elaboration based on data provided by Statistics Canada on 27 September 2018; Indigenous and Northern Affairs Canada (2019[49]), The Community Well-Being (CWB) Index, https://open.canada.ca/data/en/dataset/56578f58-a775-44ea-9cc5-9bf7c78410e6 (accessed on 19 September 2018).

Notes: The concepts and methodology of the remoteness index are presented in the following working paper: Alasia et al. (2017[58]).
Source: Elaboration based on data provided by Statistics Canada on 27 September 2018; Indigenous and Northern Affairs Canada (2019[49]), The Community Well-Being (CWB) Index, https://open.canada.ca/data/en/dataset/56578f58-a775-44ea-9cc5-9bf7c78410e6 (accessed on 19 September 2018).
Digital connectivity
Canada lags behind in digital connectivity compared to other OECD countries. For example, mobile broadband subscriptions per 100 inhabitants stood at 72 in Canada and 102.4 on average across the OECD in 2016 (OECD, 2017[63]). Moreover, despite significant investments by the public and private sectors to support broadband deployment, access to high-speed internet is lowest in rural and remote areas, and continues to lag behind for minority groups including the Inuit and First Nations peoples (Office of the Auditor General of Canada, 2018[64]).
Digital connectivity differs among Indigenous groups according to their geographical location and group age. Most (93% in 2017) Métis have access to the internet at home. A lower share of Métis in rural areas have internet access at home (88%) compared to those in small (93%), medium (94%), and large population centres (95%). Across Canada, home internet access among Métis was higher in BC (96%), than in Quebec (89%), the Northwest Territories (90%) and Saskatchewan (90%). Access also varied across age groups as 98% of young Métis had internet access, compared to 95% of core working age Métis and 86% of older Métis (Statistics Canada, 2018[29]).
While data from the Aboriginal Peoples Survey indicates that the percentage of the population with access to home internet is higher for Métis and First Nations off-reserve than that of Canada overall, this figure should be interpreted with caution as it does not account for the quality of the bandwidth. For example, Groups such as the First Nations Technology Council in British Columbia report that 75 percent of First Nations communities in British Columbia do not have adequate internet (e.g., they are unable to download a pdf attachment in an email due to slow connectivity) (First Nations Technology Council, 2018[65]).
copy the linklink copied!Profile of Indigenous businesses and entrepreneurship
Indigenous entrepreneurship is defined here as the creation, management and development of new ventures by Indigenous people for the benefit of Indigenous people. This encompasses both profit-generating activities and those pursued for social reasons – to the benefit of the community. It may take the form of sole proprietorship, partnership, corporation or cooperative including community-led economic development practices that align with diverse Indigenous cultural, spiritual and environmental worldviews. The outcomes and entitlements derived from Indigenous entrepreneurship may extend to enterprise partners and non-Indigenous stakeholders. This section profiles Indigenous businesses and entrepreneurship by distinguishing between two forms: i) that which is led by individuals and ii) that which is community, band or nation-led.
Profile of Indigenous businesses in Canada
Indigenous businesses demonstrate innovation and – while generally small – they have a higher propensity to export
According to the 2011 National Household Survey (NHS), around 43 000 First Nations, Inuit and Métis in Canada own businesses across Canada (Canadian Council for Aboriginal Business, 2016[1]). Indigenous entrepreneurship is difficult to profile due to a lack of national data, particularly for businesses on reserves. One of the best sources for Indigenous business data is the National Aboriginal Business Survey which is conducted by the Canadian Council for Aboriginal Business.12 The 2016 survey captured data on 1 101 Indigenous business owners across Canada: 2% of whom were Inuk; 46% First Nations and 50% Métis. The majority of the captured Indigenous businesses were male owned (63%) and most of the businesses had no employees (64%) (Table 2.6). Of all of the businesses surveyed, roughly a third (27%) were registered on a reserve. The vast majority of these businesses were concentrated in Ontario (26%), followed by British Colombia (21%) and Alberta (14%) (Canadian Council for Aboriginal Business, 2016[1]).
A higher share of Aboriginal businesses introduce new products/services, or new production/delivery processes relative to the broader Canadian small business sector—thus implying a higher propensity to innovate, particularly in manufacturing industries (TD Economics, 2017[66]).13 Aboriginal businesses are also reported to be more than twice as likely to have introduced a new product or service over the prior three years, and nearly three times more likely to have brought in new ways of doing things than the broader Canadian business sector (TD Economics, 2017[66]). While Aboriginal businesses tend to be small, and like all small businesses, have a relatively lower propensity to export; among small businesses, aboriginal businesses are more than twice as likely as all small businesses to export and sending their products to a broader geographic base than other small exporters (TD Economics, 2017[66]). This may be related to their location. Firms in more rural or remote areas need to seek larger markets for their services and products.
The majority of Indigenous firms surveyed in the National Aboriginal Business Survey are focussed on professional scientific and technical services (13%), other services (12%), and construction (12%). Following this, art (10%) and retail trade (8%) are the most common industries. Business in the remaining industries comprise less than a 5% share each (Figure 2.17).
Access to financing is one of the most commonly reported barriers to business development
The majority (65%) of Indigenous business owners rely on personal savings as a main source of financing their businesses on an initial and ongoing basis (Canadian Council for Aboriginal Business, 2016[1]). More than half reporting finding sources of financing for their business as “very” or “somewhat” difficult and this is deemed to be a growing issue that impairs their businesses growth and development (Canadian Council for Aboriginal Business, 2016[1]). Moreover, when a lender or programs for financing are found, 45% of businesses owners report challenges meeting lender requirements. Related to this point, only three Indigenous entrepreneurs out of ten report having a formal business plan (Canadian Council for Aboriginal Business, 2016[1]).
In terms of business structures, the majority (61%) of Indigenous entrepreneurs are sole proprietary and are unincorporated (73%) (Canadian Council for Aboriginal Business, 2016[1]).14 Sole proprietorship—where the business and the operator are the same—is the most common structure for new business across Canada because it relatively informal and easy to create. Tax law treats a sole proprietorship business as an income source for the proprietor; consequently, the proprietor is personally liable for all functions and debts of the business. Incorporation is usually done for more mature business (those with annual revenue of around CAN $50 000 or more) and requires meticulous financial statements and yearly audits.

Source: Canadian Council for Aboriginal Business (2016[1]), Promise and Prosperity: 2016 Aboriginal Business Survey, https://www.ccab.com/wp-content/uploads/2016/10/CCAB-PP-Report-V2-SQ-Pages.pdf (accessed on 23 October 2018).
Businesses located on reserves have unique characteristics
Probability analysis indicates that Aboriginal businesses are more likely to sell their goods and/or services outside Canada (to US or other countries) if: they are in the arts/entertainment or accommodation and food services industries; have older owners, and have accessed a government loan which may simply reflect that there are specific government programmes targeted to on-reserve (e.g. to address a lack of housing collateral). On the other hand, the likelihood is lower for businesses located on-reserve and for those with no employees (Table 2.8) are.15
It is further found that the probability that a business locates on a reserve is lower: if the business owner has a higher school level; if the business has no employees; or if the business owner identifies as Métis (Table 2.9).
The majority of Indigenous firms registered under the Procurement Strategy for Aboriginal Business (PSAB) are micro enterprises
An additional source of information on Indigenous businesses is the Procurement Strategy for Aboriginal Business (PSAB). PSAB aims to increase the number of Aboriginal firms participating in the federal procurement process. The PSAB is open to all Aboriginal businesses and since its establishment in 1996 has awarded more than 100 000 contracts to Aboriginal suppliers with an estimated value of CAN $3.3 billion (Crown-Indigenous Relations and Northern Affairs Canada, 2019[67]).16
Of the 1 069 registered businesses, the majority are microenterprises with 9 employees or less (78%) are small enterprises with between 10-49 employees (7%). Most are located in Ontario (30% out of total) of British Columbia (25% out of total) and the services industry is the largest industry represented among these firms.
Only five enterprises are large, with over 250 employees (1%) and just 15 are medium enterprises with between 50-249 employees (out of total). Only 16% of Indigenous businesses registered in the PSAB export.
Community-led economic development
While Indigenous entrepreneurship might entail individual, for-profit activities, there is a tenancy towards egalitarianism, sharing and communal activity (Dana, 2015[68]). This communalism extends to business ownership structures such as Aboriginal economic development corporations (EDCs)—the economic and business development arm of a First Nation, Métis or Inuit government. These community-owned businesses invest in, own and/or manage subsidiary businesses with the goal of benefiting the Indigenous citizens that they represent and are a major economic drivers in communities and a source of local employment (Canadian Council of Aboriginal Business, 2016[69]). There are many examples across Canada of EDCs using their revenues to reinvest in the community capital investments as well as education and training for members in order to ensure that they are well placed to take advantage of the community’s economic opportunities.
The Canadian Council of Aboriginal Businesses 2016 survey of EDCs provides a useful overview of this businesses sector:
-
The majority of EDCs (72%) been operational for over a decade; the average length of operation is 18 years.
-
The majority (68%) are small businesses, having less than 100 employees and almost half (46%) had total sales revenues of $5 million or more for the previous fiscal year.
-
Four in ten (38%) EDCs report being a major employer in their community and the majority of employees (72%) are Aboriginal peoples (Canadian Council for Aboriginal Business, 2016[70]).
The growth of these EDCs and other community led forms of economic development are a relatively new endeavour. The 1876 Indian Act gave the government control of Indian economic and resource development and land use. The Act historically prevented First Nations communities from engaging in economic development. The growth of EDCs and other forms of cooperative or community led development is paving the way to self-determination.
Community economic development generates “own-source revenues” (OSR)—money that First Nations earn for themselves rather than receive from government transfers. At a national level, OSR is about one-fifth of the total revenue of First Nations governments. It is estimated the total amount of OSR is now in excess of $2 billion a year (some First Nations do not make public reports). That is a significant amount compared with the roughly $6.5 billion transferred to the same First Nations by governments in fiscal 2016-17. The extent to which First Nations are able to generate own source revenues differs considerably; the top 1 percent of First Nations generated roughly 10% of OSRs (2016).
First Nations in the Atlantic Provinces demonstrate the highest level of Own Source Revenues by share. British Columbia stands out across First Nations in Canada for having a comparatively larger share of tax revenue (Figure 2.8). In an analysis of 64 First Nations in Ontario on the extent to which increases in own-source revenue are associated with improved community wellbeing, the expected benefit is modest; a 20 percent increase in per capita own source revenue is associated with a one percent increase in the CWB index (Vining and Richards, 2016[71]). This outcome could be due to the fact that the CWB index is an imprecise measure of community wellbeing times lags in development outcomes alongside the importance of a community’s framework conditions such as access to quality education and health services. More research is needed to understand different EDC structures and their community benefits.

Note: OSR: Own Source Revenues.
Source: Data provided by Crown-Indigenous Relations and Northern Affairs Canada on 6 September 2018.
First Nations communities pursue a variety of businesses such as natural resources (oil and gas, minerals, agriculture, fishing and forest products), land development (shopping centres, industrial parks and residential housing) and entertainment and hospitality (casinos, hotels and restaurants). These ventures are a key strategy for community economic development as communities with funds/revenue from land claims settlements, natural resources development or other activities seek to leverage these resources to develop sustainable businesses that generate local revenue and employment and improve the lives of their members. The extent to which EDCs may be an effective vehicle for community development depends on a wide range of factors including ownership structures and land rights; a point returned to in Chapter 5.
Indigenous Economic Development Corporations (EDC) form the business arm of First Nations, Métis and Inuit communities. They are typically structured to count the members of the community as their “shareholders” and are governed by an independent corporate board (though some have political representation as well). Taking stock of Indigenous EDCs in Canada, they tend to follow a similar development trajectory, moving from lower-complexity and lower competition ventures towards those that are more complex and increasingly knowledge-based.
A recent survey of EDCs with land holdings in the Saskatoon region found that these entities have mixed outcomes; they tend to either make little or no profits or generate large revenues (over $1 million annually) (Saskatchewan First Nations Economic Development Network, 2019[72]). Some examples of EDCs across Canada include:
-
Shopping centres: Squamish First Nation in North Vancouver and Westbank First Nation in Kelowna, B.C.
-
Winery: Osoyoos First Nation in B.C. (NK'Mip Cellars).
-
Air North airline: Vuntut Gwitchin First Nation in the Yukon, Vuntut Development Corp.
-
Support services to the diamond mining industry: Tlicho First Nations north of Yellowknife.
-
Casinos/gaming: Whitecap Dakota First Nation in Saskatchewan (Dakota Dunes Casino) and the Chippewas of Rama First Nation in Ontario (Casino Rama).
-
Food production: Lac la Ronge First Nation's Northern Lights Foods.
Source: Saskatchewan First Nations Economic Development Network (2019[72]), Aboriginal Economic Development Corporations: A Good Model, But Room for Improvement, http://sfnedn.com/2016/06/11/aboriginal-economic-development-corporations-a-good-model-but-room-for-improvement-by-heather-exner-pirot/ (accessed on 20 March 2019).
copy the linklink copied!Improving Indigenous data and enhancing Indigenous data governance
Addressing gaps in data collected by governments
Despite quality statistical data on Indigenous peoples in Canada, gaps remain
The quality and reliability of data related to the Indigenous population is generally high in Canada compared to other OECD countries with Indigenous populations and draws on consistent and therefore comparable definitions of Indigenous groups. Despite this, data gaps remain and the need for improved data is well recognised. There are ongoing efforts by the government of Canada to enhance both the quality and timeliness of Indigenous related data and to support and partner with Indigenous-led organisations in order to enhance their own data collection efforts. There are also a variety of Indigenous organisations in Canada that collect and disseminate statistical information. Among the various data gaps, there is a clear need for better information on Indigenous businesses and entrepreneurship and Indigenous economies more generally. There is also a need to better capture community well-being and to develop indicators that are useful to communities themselves.
There are two main sources of national statistical information on Indigenous peoples in Canada: the national Census of population and the Survey on Indigenous Peoples. The Census is the basic demographic and socioeconomic information on all Canadians and it provides data at the national, regional, and community levels. There are a number of limitations with the Census that make it difficult to have a complete picture of Indigenous peoples and economies. For example, identity information has been collected differently over the years (e.g., the wording and format of the Aboriginal questions were different between the 2006 and 2011 Census) rendering them less comparable and changes were made to the definition of reserves.17 2016 was the first time that Statistics Canada released results showing specific First Nations ancestry groups (Statistics Canada, 2018[73]).
The Survey of Indigenous Peoples comprises two separate surveys:
-
The Aboriginal Peoples Survey covering First Nations living off reserve, Inuit and Métis, which has been conducted by Statistics Canada since 1991, with an off-reserve focus since 2006. Approximately 44% of the status First Nations population lives in reserve areas and the majority of the Inuit populations live in Northern communities; therefore the surveys (other than the Census), leave out an important part of the Indigenous peoples in Canada. Consequently, some estimates for the First Nations people are imprecise. It is noted that the collection of on-reserve information is part of the mandate of FNIGC—thus, this FNIGC plays a role in filling this data gap.
-
The First Nations Regional Social Survey of on-reserve populations (including northern First Nation communities) which is conducted by the First Nations Information Governance Centre. The name of this survey changes to reflect the theme of the survey cycle. For the previous survey cycle focused on education and employment, the title of the on-reserve survey was “The First Nations Early Childhood, Education, and Employment Survey” (or FNREEES). For the current survey cycle focused on participation in the economy, the title of the survey is the “First Nations Labour and Employment Development Survey” (or FNLED).
Taken together, the two surveys collect data on a different theme every survey cycle, along with core indicators that can be tracked over time. The survey initiative is funded by Indigenous Services Canada, Crown-Indigenous Relations and Northern Affairs, and Employment and Social Development Canada and was provided with permanent funding through Budget 2019.
In terms of other surveys, the Community Well-Being (CWB) database provides data on economic activity for 673 Indigenous communities. However, it only includes consistent data for 357 of these communities every five years between 1991 and 2016 when there are over 1 000 First Nations and Inuit communities in Canada (Feir et al., 2017[74]). Moreover, it measures only four components of well-being: education, employment, housing, and income. While these are important aspects of well-being, the index did not include critical variables such as health, environment, and especially language, and culture which First Nations have identified as critical to well-being (Office of the Auditor General of Canada, 2018[75]). There are many reasons for the lack of ability to follow CSDs over time, such as changes in geography for communities, rules regarding confidentiality, and resulting suppression, etc.
Other national surveys conducted by Statistics Canada such as the General Social Survey, Labour Force Survey and Canadian Community Health Survey include questions that allow for Indigenous identifiers; however, while Indigenous people are identified and selected, there are not always enough Indigenous people included in the sample to provide high quality estimates below the national level and/or disaggregated for the separate Indigenous groups (First Nations, Métis, Inuit). Furthermore, most of these surveys do not collect information either on reserve or in northern communities. About 44% of the status First Nations populations lives in on reserve areas and majority of the Inuit populations lives in Northern communities, therefore the surveys other than Census of population, leaves out important part of the Indigenous peoples in Canada and as a result, some estimates for the First Nations people or the Inuit are imprecise. Table 2.10 outlines the main surveys and the Census which either include Indigenous identity or that are entirely focused in Indigenous peoples and communities in Canada.
While Statistics Canada produces the majority of statistical studies that include Indigenous identity, there are other institutions which have also produced focused studies. For example, the First Nations Information Governance Centre (FNIGC, est. 2005) is an incorporated non-profit organisation operating with a special mandate from the Assembly of First Nations’ Chiefs in Assembly. In collaboration with Regional Partners, FNIGC gathers data on a wide range of issues important to First Nations people and the communities they live including a community survey, regional early childhood, education and employment surveys and a labour and employment and development survey. The First Nations University (FNU, est. 1976)—a post-secondary institution—has also conducted a number of surveys on Indigenous issues over the years such as an Urban Aboriginal Peoples Survey which profiles that population across 11 Canadian cities. A final survey of note is the Aboriginal Business Survey which is conducted by the Canadian Council of Aboriginal Business—a non-profit organisation—that works to improve the economic self-reliance of Aboriginal communities while assisting corporate businesses. The Aboriginal Business Survey is conducted with Aboriginal small businesses across Canada and is presently in its third round.
Improving the quality of Indigenous data on businesses and entrepreneurship and community well-being
Statistics construct power relations – they shape social realities, conveying a powerful truth –and as such, need to be very thoughtfully employed, especially for groups that have been traditionally marginalised (Walter and Andersen, 1992[2]). In effect, the realities that statistics convey influence the design and evaluation of public policies that impact Indigenous peoples and communities. For example, in Canada (as in other countries like Australia), census data is used to construct the funding formulas for Indigenous employment and training programmes and data indicators influence the design and delivery of a range of other programmes and services. As such, it is important that Indigenous perspectives are included in the design and administration of these instruments so that they may be better structured to reflect Indigenous priorities and values such as culture and traditional knowledge and capture the unique aspects of the Indigenous economy.
More needs to be done to capture Indigenous businesses and entrepreneurship
While Canada has relatively good data compared to other OECD countries with Indigenous populations, gaps remain, particularly for data on Indigenous businesses and entrepreneurship. Statistics Canada’s Aboriginal Peoples Survey (conducted every five years) includes some questions related to self-employment, business ownership and the major obstacles to businesses development for First Nations peoples off reserve and Inuit and Métis populations. However, it gives a limited picture of business dynamics and does not survey on-reserve First Nations. The Census asks questions about self-employment and this is used as a proxy in order to gauge levels of entrepreneurship: self-employed persons can be sorted based on Aboriginal identity questions in the Census. However, Indigenous business in Canada may be band owned/community owned – and as such, the scale and scope of Indigenous businesses is under-represented in the Census. Other sources of information on Indigenous businesses in Canada such as Statistics Canada’s Canadian business counts—counts of active businesses by industry classification and employment-size categories for Canada and the provinces and territories—do not include a question on Aboriginal identity.18 This data can be cross-listed with communities where there are large Indigenous populations in order to estimate business activities, but this is far from exact.
On business financing, the National Aboriginal Capital Corporations Association (NACCA) and Crown-Indigenous Relations and Northern Affairs Canada have data from Aboriginal Financial Institutions (AFIs) across the country in addition to CIRNAC program contributions. However, this is not publicly available. As noted by NACCA, AFIs, have adopted a variety of definitions for what constitutes an Aboriginal entrepreneur which is reflective of their client basis (National Aboriginal Capital Corporations Association, 2017[77]). For example, the Alberta Indian Investment Corporation caters to Status Indian entrepreneurs, or corporations/partnerships that are owned in majority by Status Indians (i.e., 51 percent or more) while the Apeetogosan (Métis) Development Inc. caters to Métis and non-status Indian entrepreneurs (National Aboriginal Capital Corporations Association, 2017[77]). In terms of knowledge gaps, there is a limited understanding of the extent to which Indigenous firms are engaged in international trade.
One of the best sources of data on Indigenous business is the Canadian Council of Aboriginal Business’ (CCAB) Aboriginal Business Survey. CCAB’s proprietary list of Aboriginal businesses holds information on close to 10 000 businesses, compared to the Government of Canada’s Aboriginal Business Directory, which contains around 3 000 entries. Their national Promise & Prosperity survey is conducted every five years through telephone interviews with 1 000 Aboriginal businesses and they are developing new research on National Perspectives on Aboriginal Economic Development.19 CCAB’s membership demands that the data that is collected be treated with a great deal of privacy, and as such, the dataset is not readily publicly available – but is accessible by request. It is accessed by a special platform which is designed so that users may use and view the data, but not be holders of it themselves. While this is important for data protection and privacy reasons, it does render the data less readily usable. NACCA has some data on which industries Indigenous businesses operate within. But the larger issue remains, there are major data gaps and different data sources can often not be easily aligned (e.g. NHS, Business Patterns, CCAB, NACCA etc.).
Some steps to take in order to improve Indigenous economic/business data are:
-
Establish an agreed national definition of an Indigenous business. An agreed national definition would greatly improve the comparability of data across organisations. This definition should be developed in close consultation with Indigenous organisations including Aboriginal Finance organisations.
-
Capture more refined data on industry and size. Indigenous economic/business data would be improved by adding a breakdown of employment by industry and additional breakdowns by size of business and employment income and education into key Statistics Canada data sets.
-
Add in Aboriginal identity questions into some of the key datasets. There are many existing datasets that could be used to capture Indigenous businesses data by adding a question on Aboriginal identify – e.g., Canadian business counts.
-
Consider Indigenous territories in standard statistical geography. Indigenous geography can exist within, or cut across the borders of standard statistical geographies. In Canada, Census subdivisions generally match up to First Nations reserve lands and can be identified therein. However, there are other traditional geographies to consider along these lines. Countries like the United States have developed categorisations of Indigenous lands to better capture these Indigenous geographies in national statistics (see Box 2.8).
-
Produce an annual state of the Indigenous economy report, highlighting progress and leading practices. The National Aboriginal Economic Development Board (a Governor in Council appointed board) produced an Aboriginal Economic Progress Report for the first time in 2012 which benchmarks socio-economic indicators and assesses the state of the Aboriginal economy and in 2015 it released a progress report on these indicators (National Aboriginal Economic Development Board, 2015[78]). This is an important resource; however, it relies largely on Census data for which there are a number of limitations. This resource could be improved by including a broader range of resources and potentially, a direct survey of Indigenous business which could capture leading practices.
Support the establishment of a common registry of Indigenous-owned businesses. At present there is no common registry of Indigenous owned businesses. There are registries for Aboriginal Procurement at the federal level and some separate registries at the provincial or territorial levels, but no overall business registry. Even within adjacent communities there can be very low awareness of Indigenous businesses and so, such a resource is of wider interest beyond just government procurement (research interviews).
Statistical agencies also tend not to consider how Indigenous peoples understand territory or geography. National statistical agencies work within their standard statistical geography, which provides them a framework for survey design, sample selection and data collection that has a geographical dimension. The boundaries, determined in the standard statistical geography, reflect how countries are divided into administrative units and in some cases functional economic areas. They tend not to consider how territorial lands of Indigenous peoples are formed.
Indigenous geography can exist within, or cut across the borders of the standard statistical geographies. Without this geography statistics are not going to be as useful as they could be for Indigenous peoples. The United States has sought to address this problem by introducing a Hierarchy of American Indian, Alaska Native, and Native Hawaiian Areas which works as a tool for data agents to collect more useful and accurate data for Indigenous peoples (US Census Bureau, 2019[79]).
This includes, for example:
-
Hawaiian home lands (HHLs). Areas held in trust for Native Hawaiians by the state of Hawaii, pursuant to the Hawaiian Homes Commission Act of 1920, as amended. The Census Bureau obtains the names and boundaries for HHLs from state officials. The names of the homelands are based on the traditional ahupua'a names of the Crown and government lands of the Kingdom of Hawaii from which the lands were designated or from the local name for an area. Being lands held in trust, HHLs are treated as equivalent to off-reservation trust land areas with the American Indian Trust Land/Hawaiian Home Land Indicator coded as "T."
-
Joint-use areas. These are applied to any American Indian area by the Census Bureau, means an area that is administered jointly and/or claimed by two or more American Indian tribes. The Census Bureau designates legal joint-use areas as unique geographic entities equivalent to a reservation for the purpose of presenting statistical data.
-
Off-reservation trust lands: These are areas for which the United States holds title in trust for the benefit of a tribe (tribal trust land) or for an individual American Indian (individual trust land). Trust lands can be alienated or encumbered only by the owner with the approval of the Secretary of the Interior or his/her authorised representative. Trust lands may be located on or off a reservation; however, the Census Bureau tabulates data only for off-reservation trust lands with the off-reservation trust lands always associated with a specific federally recognised reservation and/or tribal government.
Source: US Census Bureau (2019[79]), 2010 Geographic Terms and Concepts - American Indian, Alaska Native and Hawaiian Native Areas, https://www.census.gov/geo/reference/gtc/gtc_aiannha.html (accessed on 14 February 2019).
New surveys and methods are needed in order to capture community-led enterprises
While existing datasets can be strengthened, there is a broader issue that self-employment is a poor proxy for Indigenous entrepreneurship. Self-employment does not capture community led economic activities—e.g., First Nations development corporations, social enterprises. Such economic activities are incredibly important, particularly for First Nations. As noted by Sengupta et al. (2015[80]) the legal organisational structures followed by different Canadian governments have been proven ill-suited for capturing Indigenous social enterprise. There is no nationally recognised status for social enterprise and they take a range of forms—e.g., non-profit or for-profit entities, or incorporated as cooperatives. A large number of Indigenous organisations exhibit characteristics of cooperatives but are not formally registered as such and some may earn revenues in the grey market (Sengupta, Vieta and McMurtry, 2015[80]). The Canadian Council for Aboriginal Business surveys Indigenous business, but does not include any types of non-profit organisations. In sum, these entities are important to the Indigenous economy and moreover to cultural reproduction, self-determination and yet, very little is known about their scale, and scope beyond individual case studies.
Dedicated surveys are needed to capture the important activities and contributions of Indigenous community-led enterprises. This is a sensitive issue. Indigenous communities may not want to share the details of their business activities widely. Any such undertaking should thus be led by an Indigenous organisation (or organisations) and requires consent of participating communities from an early design phase. Some steps towards improving data on community-led enterprises are:
-
Support Indigenous organisations to develop a typology of community-led business entities. Doing so would form the basis of comparative research/survey on this topic. This could be conducted in partnership with government and universities, but should be led by Indigenous organisations themselves.
-
Develop protocols for data protection and privacy for the collection of community-led enterprise data. As an initial step, protocols need to be in place in order to ensure confidentiality and address the need to balance the desire for a strong understanding of business dynamics while protecting information. Communities could be involved in variable selection and structure.
Incorporating Indigenous values and perspectives into measuring economic development and well-being
More robust and timely community well-being indicators are needed
Well-being is a multi-dimensional concept that captures both material and non-material factors, focussing on people’s quality of life. The values and perspectives of Indigenous peoples have generally not been incorporated into countries well-being frameworks and policy agendas. Current debates and perspectives about how to better reflect Indigenous values and perspectives in the Sustainable Development Goals are a good example of this (see Box 2.9) (ILO, 2015[81]). Only a few countries, such a New Zealand, have created frameworks that focus on the well-being of Indigenous people from their perspective (Stats NZ, 2013[82]). The incorporation of Indigenous values and perspectives into well-being frameworks is vital as it helps policymakers to better tailor policies to the needs and aspirations of Indigenous peoples, and monitor progress over time.
Canada’s Community Well-Being (CWB) index includes various indicators of socio-economic well-being which are combined to give each community a well-being "score". These scores are used to compare well-being across First Nations and Inuit communities with well-being in non-Aboriginal communities over time. It is the only index that produces comparative community level data. This data could be an important policy tool to understand conditions in Indigenous communities and how they fare over time. However at present, this index data is not adequately robust and the release of the data post census has been slow (over 2 years).
A 2018 report by Canada’s Auditor General underscored this point; it describes the indicators as “limited”, the sampling methods “poor” and engagement with Indigenous organisations and communities in the production of the index as inadequate (Office of the Auditor General of Canada, 2018[75]). It noted that Indigenous Services Canada has access to volumes of available data from multiple sources which it could draw on to more comprehensively compare well-being relative to other Canadians and across First Nations communities. For example, data from the First Nation Community Profiles with information on housing needs and water quality, Employment and Social Development Canada data about participation in skills training for Indigenous and Health Canada information about First Nations health (Office of the Auditor General of Canada, 2018[75]).
Indigenous Services Canada has responded to the 2018 audit with a commitment to improve this indicator alongside its engagement practices with Indigenous organisations. Some steps to meet these goals are:
-
Work with other federal government departments and Indigenous organisations to expand the range indicators and incorporate other data sources. As noted above, Canada’s Community Well-Being Index considers only a limited number of variables. These should be expanded to include both objective and subjective elements and alongside indicators on civic participation and governance, environmental quality, and accessibility to services. Data on Indigenous income would be more robust if it included indicators that capture the nature of Indigenous hybrid economies (where they exist), food security and cultural values. Several variables such as housing need, water quality etc., many of which are available from other Federal government sources. The Index would also be improved by incorporating provincial data and data from non-governmental sources (e.g., First Nations Information Governance Centre, NACCA).
-
Add subjective assessments of well-being and include indicators that are important to Indigenous peoples such as culture and traditional knowledge. Subjective measures of overall quality of life are built into numerous surveys in Canada and around the world, and are increasingly analysed and used as indicators of human well-being and social progress. Yet, even in Canada, federal surveys exclude Aboriginal peoples on-reserve and, in general, there are very few data sources on life satisfaction among Aboriginal respondents (Barrington-Leigh and Sloman, 2016[83]). For example, First Nations on reserve respondents to life satisfaction questionnaires in Canada have reported that total income is not appropriately measured by the standard income question (Barrington-Leigh and Sloman, 2016[83]).
-
Develop a specific Index to better understand the dynamics among Indigenous communities. While Canada’s Community Well-Being Index focusses on Indigenous and non-Indigenous community comparability at present, an additional Indigenous-focussed index with a broader array of variables could provide a useful tool for understanding community conditions among Indigenous communities wherein the addition of non-Indigenous comparables might otherwise limit culturally relevant questions.
A 2018 Data Strategy Roadmap for the Federal Public Service report reinforces several of these points (Government of Canada, 2018[84]). One of the stated goals of therein is to recognise that Indigenous Peoples have an inherent right to self-determination, co-develop with Indigenous partners distinctions-based strategies to advance Indigenous data governance and institutional capacity. One promising example of how such co-development is proceeding is the work of Indigenous Services Canada and the Assembly of First Nations to co-develop a National Outcomes-Based Framework comprising indicators of mutual interest to ensure accountability in the context of a new fiscal relationship.
International standards provide another starting point for considering how to measure well-being and development outcomes for Indigenous peoples. The United Nations Declaration on the Rights of Indigenous Peoples (UNDRIP) is a non-legally binding instrument that was adopted by the UN General Assembly in 2007 in Resolution 61/295 with 143 votes in favour, 4 against and 11 abstaining. Since then, the four countries voting against (Australia, Canada, New Zealand and the United States) have changed their position and now support the Declaration. The UNDRIP has 46 Articles which identify a number of elements which are important when considering place-based economic development issues for Indigenous peoples. This includes rights to participate in decision-making about development, facilitating cross-border trade and economic activities, free, prior and informed consent about development on Indigenous lands, measures that ensure productivity and conservation of Indigenous lands, and maintaining distinct institutions. It also identifies a number of aspects that should be considered when measuring Indigenous wellbeing such as traditional knowledge and cultural practices, and the maintenance of language.
The UNDRIP was also developed in the context of an increasing recognition of the need to go beyond GDP and other economic measures to develop a better understanding of how societies are performing. This recognition is reflected in the United Nations (UN) Sustainable Development Goals (SDGs). The SDGs were adopted by the UN General Assembly in 2015 in Resolution 70/1 and outline shared development goals and indicators across 17 different areas.
The SDGs include a commitment to “leave no one behind” which is particularly relevant given the poorer socio-economic outcomes generally experienced by Indigenous peoples across different countries. Indigenous peoples make up only 5 per cent of the global population; however, it is estimated that they make up 15 per cent of the world’s poor and about one-third of the world’s 900 million extremely poor rural people (United Nations, 2010). The SDGs include 6 specific references to Indigenous peoples including SDG2 (agricultural output of Indigenous small-scale farmers) and SDG4 (equal access to education for Indigenous children). The UN Permanent Forum on Indigenous Issues has identified a number of ways to strengthen the Indigenous perspectives within the SDGs including developing indicators of land use, disaggregation of measures for Indigenous populations, and strengthening the capacity of Indigenous peoples to participate in reporting on the implementation of the SDGs. The sub-national dimension is particularly important given the heterogeneous conditions facing Indigenous peoples across national territories.
Source: United Nations (2018[85]), The Permanent Forum and the 2030 Agenda, United Nations For Indigenous Peoples, https://www.un.org/development/desa/indigenouspeoples/focus-areas/post-2015-agenda/the-sustainable-development-goals-sdgs-and-indigenous/recommendations.html (accessed on 7 February 2019).
Empowering Indigenous communities to collect and use data to support local decision-making
While data gaps are a long-standing challenge, the field is changing and the number of data sources has multiplied in recent years. For example, the Federal department Natural Resource Canada is now including Indigenous Traditional Knowledge in its impact assessments for major projects. There are opportunities for new approaches to data development such as data sharing, repurposing administrative data and technology-driven data sources. There is also the potential to make greater use of administrative data; though this is difficult due to confidentiality requirements. However, effective data governance underpins the successful uses of these new and emerging sources.
The growing number of Indigenous organisations that are conducting surveys and research on issues that matter to them and their membership is a promising development. These surveys fill an important gap and, – as noted by FNU – Indigenous-led surveys can lead to greater cultural sensitivity.
Previous studies have tended to view Aboriginal Canadians largely through a “problem lens” – that is, simply as targets for social services. The UAPS survey sought to fully capture urban Aboriginal peoples as complex individuals and communities. In doing so, we uncovered a broader range of narratives and scenarios than one typically encounters via the news and other media. Many of the survey findings suggest that Canadian cities are becoming sites of connection, engagement and cultural vitality for a large number of Aboriginal peoples. (UAPS, 2010[86])
Many of the existing data sources are not designed specifically to Indigenous peoples but for the dominant population which leads to that surveys that do not include questions that are specifically important for Indigenous peoples (Kovach, 2015[87]; Riddell et al., 2017[88]). Furthermore, as the sample frames are generally designed for the total population, the sample size of Indigenous peoples is not sufficient to provide reliable data at national and subnational level. As such, existing information fails to capture or provide the essential and relevant information that is needed to make informed decision on how to improve the quality of life for Indigenous peoples.
Beyond the content of such surveys, there is a broader issue of trust which reinforces the importance of Indigenous data sovereignty—particularly with regards to culturally sensitive topics. Indigenous peoples and communities may have a mistrust of government-conducted surveys—for good reason given the long history of discrimination. For example, some First Nations reserves are incompletely enumerated in the Census because the community will not grant permission—though it bears noting that this number has steadily declined since the 1980s (Statistics Canada, 2019[89]).20 Any discussion of improving data quality should proceed with these sensitivities in mind and consider not just data for Indigenous peoples and communities, but also data production with and by Indigenous peoples and communities. This is importance for self-determination.
At their 2016 Annual General Assembly, the AFN Chiefs-In Assembly agreed (Resolution no. 57/ 2016) that Indigenous data sovereignty be recognised as “the cornerstone of nation-building.” In particular that called for the Government of Canada’s support in developing regional information governance centres across Canada. To help realise this aim the FNIGC is working closely with its ten regional survey delivery partners. Each region is unique and at a different stage of development but all ten regions will be engaged in this work via the development of a National Data Governance Strategy, which will determine in part how they will inter-relate and come together to do national-level work, while respecting that the visions and goals of First Nations vary by community and region.
With this in mind, Canada’s First Nations Information Governance Centre (FNIGC) has developed a set of standards on how First Nations data should be collected, protected, used, or shared. Standing for ownership, control, access and possession, OCAP® asserts that First Nations have control over data collection processes in their communities, and that they own and control how this information can be used. FNIGC has developed a training programme around these principles and that note that while the principles provide guidance, their application in use is context dependant and should involve the community in question (FNIGC, 2019[90]). Canada’s First Nations designed, implemented and led FN Regional Health Survey is an example of these principles in action. Across Canada there are different data sharing agreements and governance arrangements with First Nations, Métis and Inuit. For example, the British Columbia First Nations’ Data Governance Initiative (BCFNDGI) which provides community well-being profiles, data governance and community planning tools and Alberta’s Regional First Nations Information Governance Centre which is primarily funded by Health Canada. As noted by BCFNDGI, what is needed is a National Data Governance Strategy that aligns these regional approaches with broader political and reporting reform initiatives across governments (BCFNDGI, 2019[91]).
Enhancing community data for decision making
Data also needs to be collected at a local level because each Indigenous community, and the information that is relevant for them, is different. Indigenous peoples and communities’ vision on economic development and well-being also may differ from the view of the dominant population. Issues such as connection to the land, culture and kinship relationships tend to be more important. Therefore, it is crucial that Indigenous peoples defines measures and methodologies that provide a basis for more informed decisions about realising their aspirations and objectives for development.
Data at the community level encounters a common problem to small areas studies. For example, those communities that had a global non-response greater than or equal to 0.5 (or 50%) are not available in the 2011 Community Well-Being database in accordance with Statistics Canada data quality standards for the 2011 National Household Survey (NHS). For confidentiality reasons, data about populations in small places needs to be supressed. If there is community buy-in, communities may wish to undertake their own studies on such topics as community wellbeing, or, as is increasingly common in Canada, so called ‘leakage studies’ that look at how community members spend money and whether there are greater opportunities to increase spending within the community itself. However, this is not the case of environmental indicators, which can also be important for community development. For example, First Nations communities are beginning to survey their traditional lands in order to create GIS maps of the assets that are important to them. This data will not necessarily be shared with others outside of the community. The government of Canada has supported geospatial mapping in Indigenous communities through the Canadian Geospatial Data Infrastructure (CDGI) User Need Assessments and the Geomatics Community of Practice and Land Use Planning Initiative.
The government of Canada has supported Indigenous data sovereignty by providing funding to such groups as the First Nations Information Governance Centre (FNIGC) that administers surveys on topics that are important to Indigenous Canadians. FNIGC receives its funding through agreements with Health Canada, and Indigenous and Northern Affairs Canada, and Employment and Social Development Canada and the organisation partners with regional organisations and governments across Canada to design and administer surveys (e.g., on health outcomes, early childhood education, and employment).
'Indigenous Data sovereignty' is the management of information in a way that aligns with the laws, practices and customs of a nation-state in which it is located (Daly, Devitt and Mann, n.d.[92]). Articles 18 and 19 of the United Nations Declaration on the Rights of Indigenous Peoples (UNDRIP) have reinforced the importance of Indigenous data sovereignty, stipulating that specifies that “Indigenous peoples have the right to participate in decision-making in matters which affect their rights”, and that “states are required to 'consult and cooperate in good faith with Indigenous peoples through their own representative institutions in order to obtain their free, prior and informed consent before adopting and implementing legislative or administrative measures that may affect them” . In answer to this call, there have been a proliferation of guidelines how to deliver on these principles.
These are important initiatives, but there is also a need to focus on how communities themselves can have better local data for decision-making. Indigenous organisations and communities need to be empowered to collect data about their people, land and resources and businesses to support local planning. Enabling Indigenous peoples’ “data sovereignty” will ensure better alignment between data collection and the needs and aspirations of Indigenous peoples, and also empower them to use it to inform decision-making. The example of Yawuru Nations “Knowing our Community” survey (Western Australian), serves to illustrate this point (Box 2.11).
The Yawuru “Knowing our Community” household survey is a good example of how Indigenous-led survey design and data collection can lead to improved quality of data and meaningful use of information for changes.
The survey was established together with the Kimberley Institute, (a not for profit organisation), and the Australian National University. The need for own survey first occurred after the native title determination that gave Yawuru Nation assets that needed to be allocated efficiently. As a result, NBY, not-for-profit organisation owned by the Yawuru native title holders, started to look for socio-economic information to support the negotiations with public and private investors. However, lack of data about the Yawuru community and poor data quality of official data lead to the decision of designing an own household survey. The results from Yawuru’s own community survey showed how ABS provides under-estimated population counts therefore it provided more accurate information about the community. The Yawuru “Knowing our Community” household survey is a first of its kind in Australia since no other indigenous community have ever been responsible for designing survey, collecting and analysing data about their own community before.
After conducting their first community survey, the Yawuru Nation has continued providing data about their community. In 2015, they conducted a well-being survey that they designed to measure the community’s well-being. Through interviews, they conceptualised their well-being framework and identified the key indicators to describe the well-being of their people. The final indicators included more Indigenous community specific indicators such as access to fishing spots and sharing a catch with family and friends to measure the connection to the country, together with some of the standard socio-economic indicators.
The Yawuru well-being survey is a great example of why and how Indigenous peoples’ well-being should be measured at the local level. One of the key findings were that the individual’s well-being is interlinked with the overall well-being of the community.
The results from these two surveys highlight how designing of well-being surveys at the community level is essential for providing meaningful information about the community for the community to measure and monitor their well-being and make improvements. Indigenous-led survey design enabled the Yawuru Nation, important actors in the Broome society, to work towards fulfilling their goals and responsibilities.
Sources: Taylor, J. et al. (2012[93]), “Statistics for community governance: The Yawuru Indigenous population survey of Broome”, http://caepr.cass.anu.edu.au/research/publications/statistics-community-governance-yawuru-indigenous-population-survey-broome (accessed on 14 February 2019); Yap, M. and E. Yu (2016[94]), Yap, M. and E. Yu (2016), “Operationalising the capability approach: Developing culturally relevant indicators of indigenous wellbeing – An Australian example”, https://doi.org/10.1080/13600818.2016.1178223.
It is important that local data for Indigenous decisions makers be supported by capacity building efforts such as training community members on how to use existing data and how to collect their own indicators, including the use of GIS technologies. The Government of Canada could help to enhance Indigenous community-level data for decision making by:
-
Including or expanding community capacity building and training activities in federal funding for Indigenous organisations. The Government of Canada partners with Indigenous organisations in some cases and also funds them in order to develop new questionnaires and data sets on a wide range of issues. This is important work that has led to more robust indicators on a wider range of variables. However, more could be done to support Indigenous community members and decisions makers through community capacity building and training initiatives. Developing and supporting networks of GIS practitioners should be a key part of this work given how central land use and environmental considerations are to community and economic development.
-
Developing user friendly data portals designed for local decision makers. Data sets need to be accessible and easy to use, while respecting confidentiality requirements. More actions are needed to translate data (often contained only in reports) into a useable and searchable platform comparable across years.
Improving federal engagement with Indigenous organisations on statistics
The Canadian government is strengthening its engagement with Indigenous organisations regarding data collection—but much remains to be done
There are several federal departments and agencies that collect and produce relevant data for Indigenous peoples and communities. The quality of their data and their commitments to effective engagement practices are mixed.
Canada’s national statistical agency—Statistics Canada—has made strides in terms of consultations with national Indigenous organisations in recent years (Morris, 2016[95]). The organisation interacts with a number of National Indigenous Organizations (NIOs) at the working level where NIOs help provide context to Statistics Canada’s analytic research work on Indigenous populations. For example, in anticipation of the 2021 Census of Population, Statistics Canada held over 70 face-to-face discussions with Indigenous groups across the country over 2017/2018 (in addition to public online discussions) (Statistics Canada, 2018[96]). Through its Aboriginal Liaison Program it also works with First Nations, Métis and Inuit communities and organisations to help them determine their data needs, help them find and understand the data that is available for their communities, and keep them informed about Statistics Canada information activities. Aboriginal Liaison Advisors are located across each Province and Territory. The organisation interacts with a number of NIOs at the working level where NIOs help provide context to Statistics Canada’s analytic research work on Indigenous populations. These are positive developments and are similar to practices undertaken by the national statistical bodies in the United States and Australia. However, they do not extend to the inclusion of Indigenous persons and organisations within the governance of statistical matters impacting them as in Australia where an advisory body has been established—for example, the Roundtable on Aboriginal and Torres Strait Islander Statistics (Box 2.12). As such, Statistics Canada’s engagement practices remain more at a working level, addressing issues on an ‘as needed’ basis.
Statistics Canada is just one department among many that develops indicators important to understanding Indigenous peoples and community characteristics. Virtually every federal department has specific responsibilities related to Indigenous–Crown relations and as such, collects some data. Some of the most important federal departments in this regard are Indigenous Services Canada and CIRNAC as well as Health Canada and Natural Resources Canada. Federal departments are working in different ways to strengthen their data on different Indigenous populations and to improve their engagement with Indigenous communities and key stakeholders. This is a work in progress. For example, as has been previously noted, the Auditor General’s 2018 spring report has highlighted improvements that could be made to Indigenous Services Canada. Specifically it noted the inadequate measurement of well-being; the limited use of available data; incomplete reporting on well-being and a lack of meaningful engagement (Office of the Auditor General of Canada, 2018[75]). Similarly, much work remains to be done in tracking and benchmarking the implementation of the UN Sustainable Development Agenda 2030—including the work of lead departments like CIRNAC (Office of the Auditor General of Canada, 2018[61]).
Australian Bureau of Statistics
The Australian Bureau of Statistics (ABS) has two main governance mechanisms to include Indigenous peoples in the development data, methodological issues, and the release, dissemination and use of data. The first is an advisory body - the Roundtable on Aboriginal and Torres Strait Islander Statistics – that was established in 2013. This advisory body provides advice on operational issues related to the enumeration of Indigenous peoples and improving data quality. Its membership is made up of Indigenous peoples who have experience of working with Indigenous communities on data issues. The second are Engagement Managers and Engagement Officers located in various State and Territories offices throughout Australia. These staff engage directly with Indigenous communities and institutions to increase understanding of ABS data and tools, provide statistical training, and improve the quality and relevance of statistics for Indigenous peoples. The work by the ABS on Indigenous issues is coordinated by the Centre of Excellence for Aboriginal and Torres Strait Islander Statistics. Its functions include informing and engaging with Indigenous peoples and institutions, assessing and identifying improvements to the statistical framework, improving enumeration, and assisting Indigenous institutions in the use of statistics.
US Census Bureau
The Inter-governments Affairs Office (IAO) of the U.S Census Bureau serves as the principal coordination point for tribal affairs and is the advisor to the director and executive staff on tribal issues and concerns. The role of IAO includes coordinating across Federal Government agencies on data issues and collaborating with tribal leaders and national organisations. Its core activities include:
-
Developing and promoting use of the “My Tribal Area” data tool.
-
Tribal Affairs Liaison team that works directly with tribal leaders.
-
Supporting the Remote Alaska Enumeration Team.
-
Promoting census products and disseminating information to tribes.
Sources: Australian Bureau of Statistics (2019[97]), ABS Round Table on Aboriginal and Torres Strait Islander Statistics, https://www.abs.gov.au/websitedbs/D3310114.nsf/Home/Round+Table (accessed on 1 April 2019); US Census Bureau (2019[98]), Intergovernmental Affairs: Tribal Affairs, https://www.census.gov/aian (accessed on 1 April 2019).
The Auditor General’s 2018 call to the Government to make better use of the data that it is collecting and to work directly with First Nations has reopened the debate about role that an overarching federal authority dedicated to Indigenous data issues could play (Assembly of First Nations, 2018[99]) (Office of the Auditor General of Canada, 2018[75]). Canada’s creation of such an entity was short lived. The First Nations Statistical Institute (FNSI)—a federal crown corporation—was created through legislation passed in 2005, became operational in 2008 and was abolished in 2014.21 It was established in order to provide statistical information on, and analysis of, the fiscal, economic and social conditions of First Nations; promote the quality, coherence and compatibility of First Nations statistics and their production in accordance with generally accepted standards and practices through collaboration with First Nations, federal departments and agencies, provincial departments and agencies, and other organisations; work with, and provide advice to, federal departments and agencies and provincial departments and agencies on First Nations statistics; work in cooperation with Statistics Canada to ensure that the national statistical system meets the needs of First Nations and Canada; and build statistical capacity within First Nation governments.
The capacity building elements—supporting the data and statistical needs of First Nations so they can better meet their own policy and planning needs—is particularly important. It was intended that this would involve outreach in order to increase the knowledge of the importance of statistics in First Nations communities as well as supporting First Nation capacity to gather, analyse and apply statistics in evidence-based decision-making processes. Despite being quasi-independent from the Government of Canada, FNSI was a Crown corporation, which provides sufficient powers to collect and adequately protect statistical information. Other organisations collecting statistics are not bound to the same privacy provisions (for example, exemption from giving a testimony with respect to personal or sensitive information before a court). One of the organisation’s first pieces of work was to organise an ongoing environmental scan of the types of services needed by First Nation people and organisations. While other agencies have competencies for Indigenous statistics – e.g., Indigenous and Northern Affairs Canada has developed a centre of excellence for statistics within the Department and is supporting other First Nation organisations to conduct work — the FNSI was unique in the way that it could work across departments to bring a global view to these issues.
The federal government could strengthen its inter-departmental collaboration and capacity building activities and engagement with Indigenous organisations regarding data collection by:
-
Developing a multi department strategy to coordinate on Indigenous statistics and data and work with Indigenous communities and organisations on an ongoing basis. The FNSI was one way in which to achieve this objective. There are others. The key issue is that these competencies need to coordinate across departments and engage with Indigenous groups in an ongoing basis that includes capacity building efforts. At the moment, there are separate efforts that often exist around a strategy – e.g., Arctic policy dialogue – absent ongoing coordination and the relationships that support good practices. In the United States, this coordination role across departments is filled by the Inter-governments Affairs Office (IAO) of the U.S Census Bureau and in Australia by the Centre of Excellence for Aboriginal and Torres Strait Islander Statistics (Box 2.12). It is noted that—as one of the five lead departments for Canada’s implementation of the United Nations’ 2030 Agenda for Sustainable Development—CIRNAC together with other federal entities are developing and communicating a governance structure to manage this process.22 This offers an opportunity for multi departmental co-ordination on Indigenous statistics as well.
-
Establishing more formalised governance arrangements for the inclusion Indigenous peoples and organisations in the work of Statistics Canada through an advisory body. Statistics Canada liaises with NIOs and Indigenous communities at a working level on an ongoing basis and related to the timing of major statistical products such as the Census. These are positive practices. Adopting a more formal advisory body on these issues could regularise these practices and help the organisation take a strategic and long-term view on evolving data needs. The Australian Bureau of Statistics’ Roundtable on Aboriginal and Torres Strait Islander Statistics provides one example of how to do this. The Roundtable meets twice a year to work on improving data quality, engagement strategies and statistical literacy. ABS also has an Indigenous Communication Strategy in support of its census work.
-
Increasing the recruitment of Indigenous persons in Statistics Canada. Statistics Canada has the second lowest percentage of Aboriginal employees out of all Canadian departments at 2.4% (Government of Canada, 2018[100]).23 It is a general goal of the Canadian government that the public service reflect the population that it serves (see Public Service Employment Act) and the department is not meeting these goals. Statistics Canada, like other Canadian federal departments, should establish diversity goals, which include Indigenous persons. This forms, for example, one part of the Australian Bureau of Statistics’ Reconciliation Action Plan (2013) which specifies the goal of increasing the recruitment and retention of Aboriginal and Torres Strait Islander peoples in the organisation.
Canada’s research funding (as in Australia and Norway) offer targeted funding support for either Indigenous researchers or Indigenous research. Canada has some of the most comprehensive programmes to support Indigenous research among OECD countries with Indigenous populations. This funding helps to establish the research careers of Indigenous academics in a wide variety of fields and offers targeted supports for Indigenous research including establishing research networks and partnerships with Indigenous communities and peoples. Between these actions and the commitment of Universities across Canada to increase the number of Indigenous students and professors, a new generation of Indigenous scholars are making their mark in a wide array of disciplines.
The Social Sciences and Humanities Research Council of Canada (SSHRC) is implementing several pilot measures intended to support research by and with Aboriginal Peoples (known as Aboriginal Talent Measures). These include:
-
An opportunity for applicants to self-identify as Aboriginal, allowing SSHRC to track and assess participation and success rates for First Nations, Métis, Inuit and other Indigenous doctoral and postdoctoral applicants (this information is not used in the adjudication process).
-
An opportunity to identify a proposed programme of study as Aboriginal research, such that SSHRC’s Guidelines for the Merit Review of Aboriginal Research will apply.
-
An opportunity to identify and detail additional special circumstances that might impact the academic careers of some Aboriginal applicants (Social Sciences and Humanities Research Council of Canada, 2018[101]).
SSHRC has also identified the experiences and aspirations of Aboriginal Peoples in Canada as essential to building a successful shared future as one of six key future challenge areas that are likely to emerge for Canada in the next few decades. SSHRC encourages and promotes research on this topic through several of its funding programmes (Social Sciences and Humanities Research Council of Canada, 2018[101]).
Similarly, Canada’s Institute of Indigenous Peoples’ Health (IIPH) fosters the advancement of a national health research agenda to improve and promote the health of First Nations, Inuit and Métis peoples in Canada, through research, knowledge translation and capacity building (Canadian Institutes of Health Research, 2018[102]). It is one of the thirteen Institutes of Canadian Institutes of Health Research (CIHR). IIPH provides research funding supports in the form of grants, funding of capacity building programmes and training for aboriginal researchers. This work is supported by the IIPH Network Environments for Aboriginal Health Research (NEAHR) initiative which allows researchers to continue their studies while working alongside aboriginal people (Canadian Institutes of Health Research, 2018[102]).
Sources: Canadian Institutes of Health Research (2018[102]), Institute of Indigenous Peoples’ Health, http://www.cihr-irsc.gc.ca/e/8172.html (accessed on 8 April 2018); Social Sciences and Humanities Research Council of Canada (2018[101]), Social Sciences and Humanities Research Council of Canada, http://www.sshrc-crsh.gc.ca/home-accueil-eng.aspx (accessed on 8 April 2018).
References
[13] Aboriginal Affairs and Northern Development (2012), Aboriginal Populations in Canadian Cities: Why Are They Growing So Fast?, Aboriginal Affairs and Northern Development, http://www.aadnc-aandc.gc.ca/eng/1352402108618/1352402154515 (accessed on 19 September 2018).
[108] Adelson, N. (2005), “The embodiment of inequality: Health disparities in Aboriginal Canada”, Canadian Journal of Public Health, Vol. 96/2, pp. S45-S61.
[62] Alasia, A. et al. (2017), Measuring Remoteness and Accessibility - A Set of Indices for Canadian Economies, https://trid.trb.org/view/1470512 (accessed on 28 January 2019).
[17] Andersen, C. (2014), “Métis”: Race, Recognition, and the Struggle for Indigenous Peoplehood, UBC Press, https://books.google.fr/books?id=-_4hAwAAQBAJ&printsec=frontcover&dq=M%C3%A9tis:+Race,+Recognition+and+the+Struggle+for+Indigenous+Peoplehood&hl=en&sa=X&ved=0ahUKEwjE0pqjnYrcAhUMsBQKHWZnBaEQ6AEIKDAA#v=onepage&q=M%C3%A9tis%3A%20Race%2C%20Recognition%20and%20the%20Struggle%20for%20Indigenous%20Peoplehood&f=false (accessed on 6 July 2018).
[99] Assembly of First Nations (2018), “Auditor General Report shows need for government to make better use of data, work with first nations to make faster progress on closing the gap”, https://www.newswire.ca/news-releases/auditor-general-report-shows-need-for-government-to-make-better-use-of-data-work-with-first-nations-to-make-faster-progress-on-closing-the-gap-683982701.html (accessed on 5 February 2019).
[97] Australian Bureau of Statistics (2019), ABS Round Table on Aboriginal and Torres Strait Islander Statistics, https://www.abs.gov.au/websitedbs/D3310114.nsf/Home/Round+Table (accessed on 1 April 2019).
[83] Barrington-Leigh, C. and S. Sloman (2016), “Life satisfaction among Aboriginal peoples in the Canadian prairies: Evidence from the Equality, Security and Community Survey”, International Indigenous Policy Journal, Vol. 7/2, https://doi.org/10.18584/iipj.2016.7.2.2.
[91] BCFNDGI (2019), Initiative History, BC First Nations Data Governance Initiative, https://www.bcfndgi.com/initiative-history (accessed on 27 April 2019).
[18] Brezzi, M., L. Dijkstra and V. Ruiz (2011), “OECD Extended Regional Typology: The Economic Performance of Remote Rural Regions”, OECD Regional Development Working Papers, No. 2011/6, OECD Publishing, Paris, https://dx.doi.org/10.1787/5kg6z83tw7f4-en.
[103] Brittain, M. and C. Blackstock (2015), First Nations Child Poverty: A Literature Review and Analysis, http://www.fncaringsociety.com/fncares (accessed on 25 January 2019).
[27] Calver, M. (2015), Closing the Aboriginal Education Gap in Canada: Assessing Progress and Estimating the Economic Benefits, Center for the Study of Living Standards, http://www.csls.ca/reports/csls2015-03.pdf (accessed on 19 September 2018).
[70] Canadian Council for Aboriginal Business (2016), Community and Commerce: A Survey of Aboriginal Economic Development Corporations, http://www.ccab.com (accessed on 26 October 2018).
[1] Canadian Council for Aboriginal Business (2016), Promise and Prosperity: 2016 Aboriginal Business Survey, https://www.ccab.com/wp-content/uploads/2016/10/CCAB-PP-Report-V2-SQ-Pages.pdf (accessed on 23 October 2018).
[69] Canadian Council of Aboriginal Business (2016), Community and Compromise: A Survey of Aboriginal Economic Development Corporations, http://www.ccab.com (accessed on 23 October 2018).
[102] Canadian Institutes of Health Research (2018), Institute of Indigenous Peoples’ Health, http://www.cihr-irsc.gc.ca/e/8172.html (accessed on 8 April 2018).
[12] Caron-Malenfant, É. et al. (2014), “La mobilité ethnique des Autochtones du Canada entre les recensements de 2001 et 2006”, Population, Vol. 69/1, p. 29, https://doi.org/10.3917/popu.1401.0029.
[104] CBC News (2016), “Diesel-generated electricity costly for environment, economy, Ontario First Nations say”, CBC News, https://www.cbc.ca/news/canada/thunder-bay/diesel-power-first-nations-1.3557769 (accessed on 28 January 2019).
[28] Charbonneau, J. (2017), “The educational gap between Indigenous and non-Indigenous people in Canada”, Journal of Student Affairs, Vol. XXVI, https://mountainscholar.org/bitstream/handle/10217/180886/JOUF_JOSA_v26-2016-17.pdf?sequence=1&isAllowed=y#page=84 (accessed on 23 January 2019).
[67] Crown-Indigenous Relations and Northern Affairs Canada (2019), Procurement Strategy for Aboriginal Business – Booklet, https://www.aadnc-aandc.gc.ca/eng/1354798736570/1354798836012 (accessed on 30 January 2019).
[92] Daly, A., S. Devitt and M. Mann (eds.) (n.d.), Good Data, Theory on Demand, Issue 29, https://eprints.qut.edu.au/125605/1/Good_Data_book.pdf#page=28 (accessed on 21 March 2019).
[68] Dana, L. (2015), “Indigenous entrepreneurship: An emerging field of research”, Business and Globalisation, Vol. 14/2, pp. 158-169, https://www.datocms-assets.com/4974/1529092966-indigenous-entrepreneurship-an-emerging-field-of-research-leo-dana-montpellier-business-school.pdf (accessed on 22 October 2018).
[20] Drummond, D. et al. (2017), The Contribution of Aboriginal People to Future Labour Force Growth in Canada, http://www.csls.ca/reports/csls2017-07.pdf (accessed on 23 January 2019).
[74] Feir, D. et al. (2017), Illuminating Economic Development in Indigenous Communities, http://www12.statcan.gc.ca/nhs-enm/2011/ref/aboriginal-autochtones-eng.cfm (accessed on 11 October 2018).
[65] First Nations Technology Council (2018), Digital Equity, http://www.technologycouncil.ca/digital-equity-campaign.
[90] FNIGC (2019), OCAP®, First Nations Information Governance Centre, https://fnigc.ca/ocapr.html (accessed on 21 March 2019).
[50] FNIGC (2015), Placing Individual Health in Context: Report of the 2008/10 RHS Community Survey, First Nations Information Governance Centre, https://fnigc.ca/sites/default/files/docs/report_of_the_2008_10_rhs_community_survey_revised_july_2015.pdf (accessed on 31 January 2019).
[55] FNIGC (2011), First Nations Regional Health Survey, First Nations Information Governance Centre, https://fnigc.ca/dataonline/.
[23] Gionet, L. and S. Roshananfshar (2013), “Select health indicators of First Nations people living off reserve, Métis and Inuit”, in Health at a Glance.
[109] Gordon, C. and J. White (2014), “Indigenous educational atainment in Canada”, International Indigenous Policy Journal, Vol. 5/3.
[84] Government of Canada (2018), A Data Strategy Roadmap for the Federal Public Service Report to the Clerk of the Privy Council.
[100] Government of Canada (2018), Employment Equity in the Public Service of Canada for the Fiscal Year 2016 to 2017: Statistical tables - Canada.ca, https://www.canada.ca/en/treasury-board-secretariat/services/values-ethics/diversity-equity/employment-equity-annual-reports/employment-equity-public-service-canada-2016-2017-statistical-tables.html#toc1 (accessed on 31 March 2019).
[59] Government of Canada (2018), Ending Long-term Drinking Water Advisories, https://www.sac-isc.gc.ca/eng/1506514143353/1533317130660 (accessed on 11 October 2018).
[56] Government of Canada (2018), Short-term Drinking Water Advisories, https://www.canada.ca/en/indigenous-services-canada/services/short-term-drinking-water-advisories-first-nations-south-60.html (accessed on 11 October 2018).
[4] Guimond, É., N. Robitaille and S. Senecal (2015), “Fuzzy definitions and demographic explosion of Aboriginal populations in Canada from 1986 to 2006”, in Social Statistics and Ethnic Diversity, Springer, Cham, https://doi.org/10.1007/978-3-319-20095-8_12.
[24] Hajizadeh, M. et al. (2018), “Socioeconomic inequalities in health among Indigenous peoples living off-reserve in Canada: Trends and determinants”, Health Policy, Vol. 122/8, pp. 854-865, https://doi.org/10.1016/J.HEALTHPOL.2018.06.011.
[6] Harper, Anita Olsen; Thompson, S. (2017), “Structural oppressions facing Indigenous students in Canadian education”, Fourth World Journal, Vol. 15/2, https://search.informit.com.au/documentSummary;dn=655021915836359;res=IELIND (accessed on 18 December 2018).
[43] Huet, C., R. Rosol and G. Egeland (2012), “The prevalence of food insecurity is high and the diet quality poor in Inuit communities”, The Journal of Nutrition, Vol. 142/3, pp. 541-547, https://doi.org/10.3945/jn.111.149278.
[26] Hu, M., A. Daley and C. Warman (2017), “Literacy, numeracy, technology skill and labour market outcomes among Indigenous peoples in Canada”, SSRN Electronic Journal, https://doi.org/10.2139/ssrn.3050663.
[81] ILO (2015), The 2030 Agenda for Sustainable Development recog-nizes, International Labour Organization, https://www.ilo.org/wcmsp5/groups/public/---ed_emp/---ifp_skills/documents/publication/wcms_503715.pdf (accessed on 22 October 2018).
[49] Indigenous and Northern Affairs Canada (2019), The Community Well-Being (CWB) Index, https://open.canada.ca/data/en/dataset/56578f58-a775-44ea-9cc5-9bf7c78410e6 (accessed on 19 September 2018).
[107] Justice Laws (2005), First Nations Fiscal and Statistical Management Act, https://laws-lois.justice.gc.ca/eng/annualstatutes/2005_9/FullText.html (accessed on 4 February 2019).
[51] Kant, S. et al. (2014), “Multi-domain subjective wellbeing of two Canadian First Nations communities”, World Development, Vol. 64, pp. 140-157, https://doi.org/10.1016/J.WORLDDEV.2014.05.023.
[87] Kovach, M. (2015), “Emerging from the margins: Indigenous methodologies”, in Brown, L. and S. Strega (eds.), Research as Resistance: Revisiting Critical, Indigenous, and Anti-Oppressive Approaches, Canadian Scholars’ Press, https://books.google.fr/books?hl=en&lr=&id=4UNVCgAAQBAJ&oi=fnd&pg=PA43&dq=ethical+guidelines+for+indigenous+research+in+canada&ots=WMAgWs9WjI&sig=6e8tPLNYLX3aVAJ7nma1d5OWGOs#v=onepage&q=ethical%20guidelines%20for%20indigenous%20research%20in%20canada&f=false (accessed on 17 October 2018).
[37] Lamb, D., M. Yap and M. Turk (2018), “Aboriginal/non-Aboriginal wage gaps in Canada: Evidence from the 2011 National Household Survey”, Relations industrielles, Vol. 73/2, p. 225, https://doi.org/10.7202/1048569ar.
[33] Maxim, P. et al. (2008), “Dispersion and polarization of income among Aboriginal and non-Aboriginal Canadians”, Canadian Review of Sociology/Revue canadienne de sociologie, Vol. 38/4, pp. 465-476, https://doi.org/10.1111/j.1755-618X.2001.tb00982.x.
[76] Mckellips, F. (2015), Aboriginal Labour Market Information in Canada: An Overview, Prepared for the National Association of Friendship Centers, Centre for the Study of Living Standards, http://www.csls.ca/reports/csls2015-15.pdf (accessed on 4 February 2019).
[95] Morris, M. (2016), “Statistics Canada data collection on Inuit: The importance of consultation and context”, Aboriginal Policy Studies, Vol. 5/2, https://doi.org/10.5663/APS.V5I2.25452.
[58] Morrison, A., L. Bradford and L. Bharadwaj (2015), “Quantifiable progress of the First Nations Water Management Strategy, 2001-2013: Ready for regulation?”, Canadian Water Resources Journal/Revue canadienne des ressources hydriques, Vol. 40/4, pp. 352-372, https://doi.org/10.1080/07011784.2015.1080124.
[57] Murphy, H. et al. (2016), “Using decision trees to predict drinking water advisories in small water systems”, American Water Works Association Journal, Vol. 108/2, pp. E109-E118, https://doi.org/10.5942/jawwa.2016.108.0008.
[40] Natcher, D. (2018), Normalizing Aboriginal Subsistence Economies in the Canadian North, Resources and Sustainable Development in the Arctic, http://yukonresearch.yukoncollege.yk.ca/resda/wp-content/uploads/sites/2/2013/09/Natcher-Gap-Analysis-final-for-web.pdf (accessed on 23 January 2019).
[34] Natcher, D. (2018), Normalizing Aboriginal Subsistence Economies in the Canadian North, Resources and Sustainable Development in the Arctic, http://yukonresearch.yukoncollege.yk.ca/resda/wp-content/uploads/sites/2/2013/09/Natcher-Gap-Analysis-final-for-web.pdf (accessed on 22 October 2018).
[77] National Aboriginal Capital Corporations Association (2017), Aboriginal Entrepreneurship in Canada, National Aboriginal Capital Corporations Association, https://nacca.ca/wp-content/uploads/2017/04/Research-Module-1_NACCA-BDC_Feb14_2017.pdf (accessed on 29 January 2019).
[35] National Aboriginal Economic Development Board (2017), Reconciliation: Growing Canada’s Economy by $27.7 billion, http://naedb-cndea.com/reports/infographic_reconciliation_27_7_billion.pdf (accessed on 11 October 2018).
[78] National Aboriginal Economic Development Board (2015), The Aboriginal Economic Progress Report 2015, http://www.naedb-cndea.com/reports/NAEDB-progress-report-june-2015.pdf (accessed on 20 February 2019).
[52] Natural Resources Canada (2019), Remote Communities Energy Database, http://atlas.gc.ca/rced-bdece/en/index.html (accessed on 28 January 2019).
[36] Nunavut Statistics (2018), Labour Force and Employment Data, Nunavut Statistics, Government of Nunavut, https://www.gov.nu.ca/eia/information/labour-force-and-employment-data (accessed on 17 December 2018).
[48] OECD (2019), “Self-employment rate”, (indicator), https://dx.doi.org/10.1787/fb58715e-en (accessed on 24 January 2019).
[46] OECD (2018), “Employment distribution of the Indigenous and non-Indigenous identity populations by occupation, 15 and older, %, 2016”, in Indigenous Employment and Skills Strategies in Canada, OECD Reviews on Local Job Creation, OECD Publishing, Paris, https://doi.org/10.1787/9789264300477-graph12-en.
[39] OECD (2018), Percentage of Indigenous People in each income decile group (after-tax), 2016, OECD Reviews on Local Job Creation, OECD Publishing, Paris, https://doi.org/10.1787/9789264300477-graph.
[32] OECD (2017), “Indigenous peoples and education in participating Canadian provinces and territories”, in Promising Practices in Supporting Success for Indigenous Students, OECD Publishing, Paris, https://doi.org/10.1787/9789264279421-5-en.
[63] OECD (2017), OECD Digital Economy Outlook 2017, OECD Publishing, Paris, https://dx.doi.org/10.1787/9789264276284-en.
[16] OECD (2016), OECD Regional Outlook 2016: Productive Regions for Inclusive Societies, OECD Publishing, Paris, https://dx.doi.org/10.1787/9789264260245-en.
[64] Office of the Auditor General of Canada (2018), Report 1 - Connectivity in Rural and Remote Areas, Office of the Auditor General of Canada, Ottawa, http://www.oag-bvg.gc.ca/internet/English/att__e_43221.html (accessed on 23 January 2019).
[61] Office of the Auditor General of Canada (2018), Report 2 - Canada’s Preparedness to Implement the United Nations’ Sustainable Development Goals, http://www.oag-bvg.gc.ca/internet/English/parl_cesd_201804_02_e_42993.html (accessed on 31 March 2019).
[75] Office of the Auditor General of Canada (2018), Report 5 - Socio-economic Gaps on First Nations Reserves, Indigenous Services Canada, http://www.oag-bvg.gc.ca/internet/English/parl_oag_201805_05_e_43037.html (accessed on 4 February 2019).
[106] Open Canada (2017), Procurement Vendor Contracts (dataset), https://open.canada.ca/data/dataset/d8f85d91-7dec-4fd1-8055-483b77225d8b/resource/fac950c0-00d5-4ec1-a4d3-9cbebf98a305/download/contracts.csv.
[45] Park, J. (2018), “Overqualification among Aboriginal workers in Canada”, International Indigenous Policy Journal, Vol. 9/1, https://doi.org/10.18584/iipj.2018.9.1.2.
[21] Public Health Agency of Canada (2017), Health Status of Canadians 2016: Report of the Chief Public Health Officer - How Healthy Are We?, Health Status of Canadians 2016, https://www.canada.ca/en/public-health/corporate/publications/chief-public-health-officer-reports-state-public-health-canada/2016-health-status-canadians/page-4-how-healthy-are-we-life-expectancy-birth.html (accessed on 28 January 2019).
[22] Richmond, C. and C. Cook (2016), “Creating conditions for Canadian aboriginal health equity: The promise of healthy public policy”, Public Health Reviews, Vol. 37/1, p. 2, https://doi.org/10.1186/s40985-016-0016-5.
[88] Riddell, J. et al. (2017), “Laying the groundwork: A practical guide for ethical research with Indigenous communities”, International Indigenous Policy Journal, Vol. 8/2, https://doi.org/10.18584/iipj.2017.8.2.6.
[72] Saskatchewan First Nations Economic Development Network (2019), Aboriginal Economic Development Corporations: A Good Model, But Room for Improvement, Saskatchewan First Nations Economic Development Network, http://sfnedn.com/2016/06/11/aboriginal-economic-development-corporations-a-good-model-but-room-for-improvement-by-heather-exner-pirot/ (accessed on 20 March 2019).
[80] Sengupta, U., M. Vieta and J. McMurtry (2015), Indigenous Communities and Social Enterprise in Canada, https://www.iap-socent.be/sites/default/files/ANSERJ%20%2807%29%20104-123.pdf (accessed on 4 February 2019).
[41] Simpson, L. (2018), Nunavut 99 - The Subsistence Economy, http://www.nunavut.com/nunavut99/english/subsistence.html (accessed on 24 January 2019).
[101] Social Sciences and Humanities Research Council of Canada (2018), Social Sciences and Humanities Research Council of Canada, http://www.sshrc-crsh.gc.ca/home-accueil-eng.aspx (accessed on 8 April 2018).
[89] Statistics Canada (2019), Incompletely Enumerated Indian Reserves and Indian Settlements, https://www12.statcan.gc.ca/census-recensement/2016/ref/dq-qd/iir-rii-eng.cfm.
[25] Statistics Canada (2019), Perceived General Health by Aboriginal Identity, Table 41-10-0001-01, https://www150.statcan.gc.ca/t1/tbl1/en/tv.action?pid=4110000101.
[38] Statistics Canada (2018), Aboriginal Population Profile, 2016 Census, https://www12.statcan.gc.ca/census-recensement/2016/dp-pd/abpopprof/index.cfm?Lang=E (accessed on 27 October 2019).
[5] Statistics Canada (2018), Definitions, Data Sources and Methods, https://www.statcan.gc.ca/eng/concepts/index (accessed on 17 December 2018).
[96] Statistics Canada (2018), Departmental Results Report 2017-18, https://www.statcan.gc.ca/eng/about/drr/2017-2018/index (accessed on 31 March 2019).
[73] Statistics Canada (2018), First Nations, Métis and Inuit: The Way Forward, https://www150.statcan.gc.ca/n1/pub/11-631-x/11-631-x2018005-eng.pdf.
[42] Statistics Canada (2018), Labour Market Experiences of First Nations People Living Off Reserve: Key Findings from the 2017 Aboriginal Peoples Survey, https://www150.statcan.gc.ca/n1/pub/89-653-x/89-653-x2018003-eng.htm.
[44] Statistics Canada (2018), Labour Market Experiences of Inuit: Key Findings from the 2017 Aboriginal Peoples Survey, https://www150.statcan.gc.ca/n1/pub/89-653-x/89-653-x2018004-eng.htm.
[29] Statistics Canada (2018), Labour Market Experiences of Métis: Key Findings from the 2017 Aboriginal Peoples Survey, https://www150.statcan.gc.ca/n1/pub/89-653-x/89-653-x2018002-eng.htm.
[8] Statistics Canada (2017), 2016 Census Population Tabulations, Provided by Statistics Canada in September 2018, https://www12.statcan.gc.ca/census-recensement/2016/dp-pd/index-eng.cfm.
[7] Statistics Canada (2017), Aboriginal Peoples in Canada: Key Results from the 2016 Census, https://www150.statcan.gc.ca/n1/daily-quotidien/171025/dq171025a-eng.htm.
[3] Statistics Canada (2017), Aboriginal Peoples Reference Guide, Census of Population, 2016, https://www12.statcan.gc.ca/census-recensement/2016/ref/guides/009/98-500-x2016009-eng.cfm.
[47] Statistics Canada (2017), Aboriginal Peoples Survey (APS), https://www.statcan.gc.ca/eng/survey/household/3250 (accessed on 27 October 2019).
[105] Statistics Canada (2017), Dictionary, Census of Population, 2016: Aboriginal Identity, https://www12.statcan.gc.ca/census-recensement/2016/ref/dict/pop001-eng.cfm.
[19] Statistics Canada (2017), Focus on Geography Series, 2016 Census, Statistics Canada Catalogue no. 98-404-X2016001.
[9] Statistics Canada (2017), The Daily: Aboriginal Peoples in Canada, Key Results, https://www150.statcan.gc.ca/n1/en/daily-quotidien/171025/dq171025a-eng.pdf?st=jmMcZhtz.
[10] Statistics Canada (2016), 2016 Census of Population.
[11] Statistics Canada (2015), Projections of the Aboriginal Population and Households in Canada, 2011 to 2036, https://www150.statcan.gc.ca/n1/pub/91-552-x/91-552-x2015001-eng.htm.
[15] Statistics Canada (2011), 2011 National Household Survey.
[14] Statistics Canada (2001), 2001 Census of Population.
[82] Stats NZ (2013), Te Kupenga, http://archive.stats.govt.nz/browse_for_stats/people_and_communities/maori/te-kupenga.aspx (accessed on 25 January 2019).
[93] Taylor, J. et al. (2012), “Statistics for community governance: The Yawuru Indigenous population survey of Broome”, Vol. 82, p. 30, http://caepr.cass.anu.edu.au/research/publications/statistics-community-governance-yawuru-indigenous-population-survey-broome (accessed on 14 February 2019).
[66] TD Economics (2017), Aboriginal Businesses Increasingly Embracing Innovation, TD Economics, http://www.td.com/economics (accessed on 19 September 2018).
[60] Thompson, E., Y. Post and E. McBean (2017), “A decade of drinking water advisories: Historical evidence of frequency, duration and causes”, Canadian Water Resources Journal/Revue canadienne des ressources hydriques, Vol. 42/4, pp. 378-390, https://doi.org/10.1080/07011784.2017.1387609.
[30] Truth and Reconciliation Commission of Canada (2015), Honouring the Truth, Reconciling for the Future Honouring the Truth, Reconciling for the Future Summary of the Final Report of the Truth and Reconciliation Commission of Canada, Truth and Reconciliation Commission of Canada, http://www.trc.ca/websites/trcinstitution/File/2015/Findings/Exec_Summary_2015_05_31_web_o.pdf (accessed on 20 December 2018).
[31] Truth and Reconciliation Commission of Canada (2015), Truth and Reconciliation Commission of Canada: Calls to Action, http://www.trc.ca/websites/trcinstitution/File/2015/Findings/Calls_to_Action_English2.pdf (accessed on 20 December 2018).
[86] UAPS (2010), Urban Aboriginal Peoples Survey, http://www.gravityinc.ca (accessed on 4 February 2019).
[85] United Nations (2018), The Permanent Forum and the 2030 Agenda, United Nations For Indigenous Peoples, https://www.un.org/development/desa/indigenouspeoples/focus-areas/post-2015-agenda/the-sustainable-development-goals-sdgs-and-indigenous/recommendations.html (accessed on 7 February 2019).
[53] United Nations (2009), State of the World’s Indigenous Peoples, United Nations Permanent Forum on Indigenous Issues, https://books.google.fr/books?hl=en&lr=&id=ko109fkqEGUC&oi=fnd&pg=PA1&ots=DSZCEa7qkL&sig=A2Z0_onVJ7lGgcT--QesVV4IUWQ&redir_esc=y#v=onepage&q&f=false (accessed on 11 October 2018).
[79] US Census Bureau (2019), 2010 Geographic Terms and Concepts - American Indian, Alaska Native and Hawaiian Native Areas, https://www.census.gov/geo/reference/gtc/gtc_aiannha.html (accessed on 14 February 2019).
[98] US Census Bureau (2019), Intergovernmental Affairs: Tribal Affairs, https://www.census.gov/aian (accessed on 1 April 2019).
[71] Vining, A. and J. Richards (2016), “Indigenous economic development in Canada: Confronting principal-agent and principal–principal problems to reduce resource rent dissipation”, Resources Policy, Vol. 49, pp. 358-367, https://doi.org/10.1016/J.RESOURPOL.2016.07.006.
[2] Walter, M. and C. Andersen (1992), Indigenous Statistics: A Quantitative Research Methodology, https://books.google.fr/books?hl=en&lr=&id=ycP_AAAAQBAJ&oi=fnd&pg=PA5&dq=identification+of+indigenous+people+in+statistics&ots=NLcTVmy34u&sig=JZgO1DeVc76GJthp_DLzwN12LwI#v=onepage&q=sami&f=false (accessed on 2 March 2018).
[54] Webster, P. (2015), “Housing triggers health problems for Canada’s First Nations”, The Lancet, Vol. 385/9967, pp. 495-496, https://doi.org/10.1016/S0140-6736(15)60187-8.
[110] Wilson, D. and D. Macdonald (2010), The Income Gap Between Aboriginal Peoples and the Rest of Canada, Canadian Centre For Policy Alternatives.
[94] Yap, M. and E. Yu (2016), “Operationalising the capability approach: Developing culturally relevant indicators of indigenous wellbeing – An Australian example”, Oxford Development Studies, Vol. 44/3, pp. 315-331, https://doi.org/10.1080/13600818.2016.1178223.
Notes
← 1. These figures refer to those who identified as single identity.
← 2. For example Adelson (2005[108]), Wilson and Macdonald (2010[110]), Gordon and White (2014[109]).
← 3. While there is a lack of longitudinal data on Indigenous businesses in Canada, 2011 National Household Survey estimated that 37 685 Aboriginal individuals were self-employed across Canada, which is an increase from 34 045 in 2006; 27 210 in 2001; and 20 195 in 1996 (National Aboriginal Capital Corporations Association, 2017[77]).
With little to no longitudinal data available to track the growth and decline of Aboriginal businesses, we’re left to guess what the possible trends mean
← 4. Statistics Canada has defined the Aboriginal population in Canada the same way since 1996. Prior to that, the Indigenous population was defined on the basis of reported ancestry. The figures refers to single response.
← 5. Inuit Nunangat is composed of four regions in Canada: The Inuvialuit Region in the Northwest Territories, the territory of Nunavut, Nunavik in northern Quebec, and Nunatsiavut in northern Labrador.
← 6. The fertility rates of Indigenous people are higher than that of the non-Indigenous population in Canada (2.2 versus 1.6 children per woman in 2011). Among the three Indigenous groups, Inuit women and First Nations women had the highest fertility rates (at 2.7 and 2.4 children per woman respectively in 2011); the rate for Métis women was lower (at 1.8 children per woman in 2011) (Statistics Canada, 2017[7]).
← 7. The income figures analysed here do not include non-monetary income of Indigenous peoples. Non-monetary sources of income are generated through traditional activities such as subsistence hunting, fishing and farming. Usually, the market prices of these sources of income cannot be estimated which may be due to the reluctance of Indigenous populations to monetise these activities. Non-monetary income is likely to be more significant for the quality of life of Indigenous people than for non-indigenous people, particularly in rural areas, due to the role of subsistence hunting, fishing and harvesting.
← 8. 81% of reserves had median incomes below the low-income measure of $22,133 per individual (2016 Census).
Canada uses the Low Income Cut Off (LICO, Low Income Measure (LIM) and the Market Basket Measure (MBM) in order to measure relative poverty; Statistics Canada does not use any absolute poverty measures). Each of these measures have some drawbacks for Indigenous populations. The LICO and MBM are not available for peoples living on reserves, and while the LIM includes calculation with data from on reserves, the last tem this was conducted in 2006 (Brittain and Blackstock, 2015[103]). The LICOs also does not cover individuals living in the northern territories (Brittain and Blackstock, 2015[103]).
← 9. The 2017 Aboriginal Peoples Survey is a voluntary national survey of Inuit, Métis and First Nations people living off reserve, aged 15 years or older. The 2017 survey was its fifth cycle.
← 10. Canada’s population density in 2016 was around 4 persons per square kilometre; this stands in contrast to the figure of the OECD as a whole, at approximately 38 persons per square kilometre.
← 11. Costs for diesel generation varies by community. As one example, the North Spirit Lake First Nation reportedly spends 1 million dollars CAN on diesel fuel each year which is equivalent to approximately $2 400 per person yearly heating costs (CBC News, 2016[104]).
← 12. The 2016 Aboriginal Business Survey is a “telephone survey with 1,101 First Nations, Métis and Inuit business owners across Canada, conducted from February 10 to March 10, 2015. The margin of error for a sample of 1,101 is +/- 3.0 percentage points, 19 times in 20. The margin of error is greater for results pertaining to regional or other subgroups of the total sample” (Canadian Council for Aboriginal Business, 2016, p. 51[1]).
← 13. The study reports that “among the major industries, particularly strong incidences of innovation were reported among those in the manufacturing (where 94% of firms reported introducing a new product and/or service), management (79%), consulting (76%), and education (74%) sectors” (TD Economics, 2017[66]).
← 14. There are for types of business structures in Canada: sole proprietorship, partnership, corporation and co-operative.
← 15. All regressions include province dummies, sector of activity dummies, gender, indigenous group, dummy for in/out reserve, dummies for number of employees, dummies for educational level of owner, age of owner, dummy for government loan. The estimation method is generalised linear regression (binomial with logit link) using weights from survey. So if a variable is not mentioned in the results it’s because it wasn’t significant (this does not apply to the province and sector of activity dummies).
← 16. The list of procurement vendor contracts adds to around 242 million (Open Canada, 2017[106]).
← 17. Note that the 2011 Canadian Census is in fact a National Household Survey as the mandatory long form Census was abolished in 2011. It was later reinstated for the 2016 Census of population.
← 18. Statistics Canada defines Aboriginal identity' as: “whether the person identified with the Aboriginal peoples of Canada. This includes those who are First Nations (North American Indian), Métis or Inuk (Inuit) and/or those who are Registered or Treaty Indians (that is, registered under the Indian Act of Canada), and/or those who have membership in a First Nation or Indian band. Aboriginal peoples of Canada are defined in the Constitution Act, 1982, Section 35 (2) as including the Indian, Inuit and Métis peoples of Canada.” In the Canadian Census, Aboriginal identity is derived from data collected in three questions: Aboriginal group (Question 18); Registered or Treaty Indian status (Question 20); and Membership in a First Nation or Indian band (Question 21). In Question 18, respondents could respond 'Yes, First Nations (North American Indian),' 'Yes, Métis,' 'Yes, Inuk (Inuit)' or 'No, not an Aboriginal person' by checking off the appropriate mark-in circle. In Question 20, respondents could respond 'No' or 'Yes, Status Indian (Registered or Treaty).' In Question 21, respondents could respond 'No' or 'Yes, member of a First Nation/Indian band.' (Statistics Canada, 2017[105]).
← 19. In 2019 CCAB completed in-person interviews in more than 100 Aboriginal communities located across Canada as part of the National Perspectives on Aboriginal Economic Development research project. This research is the first to be completed of its kind in Canada – providing insights directly from the actors involved in driving economic prosperity within urban and on-reserve Aboriginal community economies. The actors surveyed include: Chief and Councils, Aboriginal Economic Development Corporations, Trust Officers, Economic Development Officers, Band-Owned Businesses and Financial Lenders, the National Perspectives on Aboriginal Economic Development research provides valuable insight into the economic realities of Aboriginal communities.
← 20. For example, while in 1986, there were 136 incompletely enumerated Indian reserves and Settlements, this number was just 14 in the 2016 Census (Statistics Canada, 2018[73]).
← 21. The Act created four new institutions and was titled: An Act to provide for real property taxation powers of first nations, to create a First Nations Tax Commission, First Nations Financial Management Board, First Nations Finance Authority and First Nations Statistical Institute (Justice Laws, 2005[107]).
← 22. The five lead departments for Canada’s response to the United Nations’ 2030 Agenda for Sustainable Development are: Employment and Social Development Canada,, Environment and Climate Change Canada, Global Affairs Canada, Indigenous and Northern Affairs Canada, and Status of Women Canada.
← 23. Data on employment equity in the Public Service of Canada is for the fiscal year 2016 to 2017 Office of the Governor General's Secretary. Statistics Canada has the second lowest percentage of Aboriginal employees among federal departments; the department of Finance has the lowest at 2.4%. This analysis excludes the small agencies of the International Joint Commission, Office of the Commissioner of Lobbying of Canada, Copyright Board Canada, RCMP External Review Committee, Canadian Space Agency, Administrative Tribunals Support Service of Canada all of whom have a much lower % of Aboriginal employees out of total or for which data is unreported because data for small numbers is supressed (Government of Canada, 2018[100]).
Metadata, Legal and Rights
https://doi.org/10.1787/fa0f60c6-en
© OECD 2020
The use of this work, whether digital or print, is governed by the Terms and Conditions to be found at http://www.oecd.org/termsandconditions.