copy the linklink copied!Gross pension replacement rates
The future gross replacement rate represents the level of pension benefits in retirement from mandatory public and private pension schemes relative to earnings when working. For workers with average earnings and a full career from age 22, the future gross replacement rate at the normal retirement age averages 49.0% for men and 48.2% for women in the 36 OECD countries, with substantial cross-country variation. At the bottom of the range, five countries offer future gross replacement rates from mandatory schemes below 30% at the average wage: Ireland, Lithuania, Mexico, Poland and the United Kingdom. Austria, Italy and Luxembourg, at the top of the range, offers replacement rates higher than 75%.
Most OECD countries aim to protect low-income workers (here defined as workers earning half of average worker earnings) from old-age poverty, which results in higher replacement rates for them than for average earners. Low-income workers would receive gross replacement rates averaging 60%, compared with 49% for average-wage workers. Some countries, such as Australia, Ireland and Korea, pay relatively small benefits to average earners, but are closer to or even above average for low-income workers. However, projected replacement rates in nine countries are the same for a full career at average and half-average pay: Austria, Finland, Germany, Hungary, Italy, Latvia, Spain, Sweden and Turkey.
At the top of the range, based on current legislation, low earners in Denmark will receive a future gross replacement rate of 114% after a full career; retirement benefits are thus higher than their earnings when working. At the other end of the scale, Germany, Lithuania and Mexico offer gross replacement rates below 40% to low-income earners, thus implying a gross retirement income lower than 20% of average earnings after a full career. On average in the 36 OECD countries, the gross replacement rate at 1.5 times average earnings (here called “high earnings”) is 45%, somewhat below the 49% figure for average earners. Replacement rates for these high earners equal 80% in Italy, while at the other end of the spectrum, the United Kingdom offers a replacement rate of around 15%.
For the non-OECD countries, the projected replacement rates for average earners range from 17% in South Africa to 83% in India.
All of the replacement rates are calculated for full-career workers from the age of 22, which means that career lengths differ between countries. Denmark has an estimated long-term retirement age of 74 years for those starting in 2018, whilst in Turkey it will be 60 for women and 62 for men, and in both Luxembourg and Slovenia retirement will still be possible with a full pension at age 62 for both men and women (Table 5.1).
Gross pension replacement rates differ for women in nine countries, due to a lower pension eligibility age than for men (Hungary, Israel, Poland, Switzerland and Turkey), gender specific accrual rates (Slovenia) or the use of sex specific mortality rates to compute annuities (Australia, Chile and Mexico). The replacement rates are expressed as percentage of earnings which are not gender specific. Differences between the sexes are substantial in Australia, Chile, Hungary, and especially Israel and Poland, with replacement rates (i.e. monthly benefits) for women being between 7% and 27% lower than for men. In Slovenia, however, the replacement rates for women are 5% greater due to a higher accrual rate. This difference will be phased out for those entering the labour market from 2023.
Gross pension replacement rates fall with age from 49% on average at the time of retirement to 43% at age of 80, a fall of 12% relative to wages. This difference is due to the indexation of pension benefits in payment, which do not follow wages in many countries. With price indexation from a normal retirement age of 65, the fall is equal to 17% based on the OECD model assumptions. The earlier the normal retirement age the larger the fall with price indexation. The largest fall of about 20% are found in Greece and Turkey as the normal retirement age is 62, and in Sweden because the indexation of the NDC schemes is wages minus 1.6%, which is less than price indexation in the OECD model. Countries where the indexation of pension benefits follows wages – Ireland, Luxembourg, the Netherlands, New Zealand, Slovenia and the United Kingdom - have the same replacement rate at age 80 than at the normal retirement age.
Definition and measurement
The old-age pension replacement rate measures how effectively a pension system provides a retirement income to replace earnings, the main source of income before retirement. The gross replacement rate is defined as gross pension entitlement divided by gross pre-retirement earnings.
Often, the replacement rate is expressed as the ratio of the pension to final earnings (just before retirement). Under the baseline assumptions, workers earn the same percentage of average worker earnings throughout their career. Therefore, final earnings are equal to lifetime average earnings revalued in line with economy-wide earnings growth. Replacement rates expressed as a percentage of final earnings are thus identical to those expressed as a percentage of lifetime earnings.
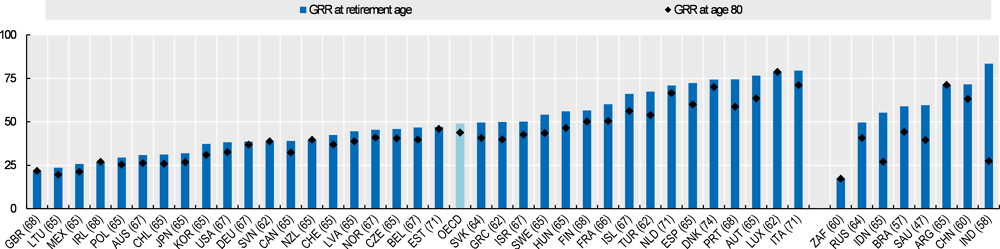
Source: OECD pension models.
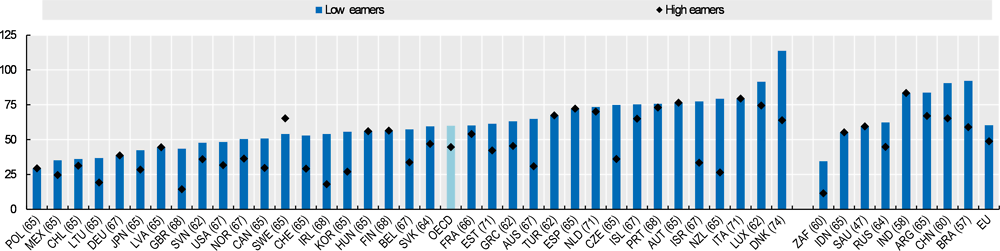
Source: OECD pension models.