copy the linklink copied!2. Collective bargaining systems and workers’ voice arrangements in OECD countries
Sandrine Cazes, Andrea Garnero, Sébastien Martin and Chloé Touzet
This chapter provides a comprehensive and up-to-date review of collective bargaining systems and workers’ voice arrangements across OECD countries. Despite the fall in trade union density and collective bargaining coverage in the last 40 years, collective bargaining remains a key labour market institution. Yet, the understanding of this key institution is limited by the fact that collective bargaining systems are often described with crude indicators and oversimplified in the literature. This chapter describes in more details the features of collective bargaining systems that are particularly important for labour market outcomes.
The statistical data for Israel are supplied by and under the responsibility of the relevant Israeli authorities. The use of such data by the OECD is without prejudice to the status of the Golan Heights, East Jerusalem and Israeli settlements in the West Bank under the terms of international law.
Across OECD countries, workers and employers can associate to express their interests and concerns, as well as to bargain over the terms and conditions of employment. However, in the last decades, this process of collective representation and negotiation has been tested by a series of challenges. Policy reforms have modified the scope and functioning of collective bargaining systems. At the same time, the coverage of collective bargaining, and the number of workers who are members of trade unions have fallen.
When not simply overlooked, the role of collective bargaining as a labour market institution is often based on crude indicators of trade union density. Building on a rich set of survey and administrative data, going back to the 1960s, this chapter sheds new light on collective bargaining systems currently in place in OECD countries, taking into account their diversity, their complexity and their internal institutional complementarities. In particular, this chapter shows that:
-
In 2018, about 82 million workers were members of trade unions in OECD countries, and about 160 million were covered by collective agreements concluded either at the national, regional, sectoral, occupational or firm level. Trade union density, the proportion of employees who are union members, varies considerably across OECD countries, ranging from 4.7% in Estonia to 91% in Iceland in 2018.
-
On average, 16% of employees were members of trade unions in 2018, down from 33% in 1975. While this decline characterises a majority of countries, union density has been relatively stable since the mid-1970s in Canada, Korea and Norway, and has increased in Iceland and Belgium.
-
Decomposition analyses reveal that trade union density decline is a multi-faceted phenomenon that varies across countries and time: there is no single story of union density decline across OECD countries. Future research on the issue should focus on country-specific analyses.
-
In particular, contrary to a commonly held belief, the contribution to union density decline of demographic transformations affecting the composition of the workforce, and of changes affecting the labour demand (such as the shrinking of the manufacturing sector) is small. It leaves the bigger part of the observed decline unexplained. Neither is union density decline linked to a declining propensity to unionise with passing generations in most countries studied.
-
The latest data available for OECD countries show that, on average, 59% of workers were employed in a firm that is member of an employer organisation and this share has been relatively stable over the last 15 years. Medium and large firms tend to be better represented by employer organisations than small firms, while sectoral coverage varies significantly across countries.
-
Declining union density has been accompanied by a reduction of the share of workers covered by a collective agreement, which has shrunk to 32% in 2017 from 46% in 1985 on average in OECD countries. The decline was strongest in Central and Eastern European countries, with steep decreases also observed in Australia, New Zealand and the United Kingdom, and, more recently, in Greece. Coverage has been relatively stable in most continental European countries, except for Germany where it has decreased significantly since reunification in 1990.
-
Overall, collective bargaining coverage is high and stable only in countries where multi-employer agreements (i.e. at sectoral or national level) are negotiated and where the share of firms that are members of an employer association is high, or where agreements are extended also to workers working in firms which are not members of a signatory employer association. In countries where collective agreements are signed mainly at firm level, coverage tends to go hand-in-hand with trade union density. Workers in small firms are generally less likely to be covered, as these firms often do not have the capacity to negotiate a firm-level agreement, or a union or another form of worker representation is absent in the workplace.
Using detailed information collected through OECD policy questionnaires addressed to Labour Ministries and social partners, the chapter provides a detailed picture of collective bargaining systems by unpacking their different building blocks. In particular, the chapter shows that:
-
In two-thirds of OECD countries, collective bargaining takes place predominantly at firm level. Sectoral agreements play a significant role only in continental European countries. However, this does not tell the whole story about the actual degree of centralisation or decentralisation as countries differ greatly in terms of the flexibility for firm-level agreements to modify the terms set out in higher-level agreements. In some contexts (particularly Scandinavian countries), sectoral agreements define the broad framework but leave considerable scope for bargaining at the firm level. In other countries (such as Germany and Austria and more recently Spain), sectoral agreements dominate but they leave room for firm-level agreements to apply less favourable terms for employees, either in a generalised way or only temporarily in case of a crisis. In a third group of countries (including Italy, Slovenia and, despite the 2012 reform, Portugal), firm-level bargaining remains limited and in most cases strictly regulated by higher-level agreements.
-
Collective bargaining systems across OECD countries also differ greatly in the degree of co-ordination between bargaining units – essentially the extent to which common (wage) targets are pursued and/or minor players follow what major players decide. Co-ordination is a key factor behind macro flexibility (i.e. the ability of the economy to adjust to macroeconomic shocks) and is strong, at least in certain sectors, in Austria, Denmark, Germany, the Netherlands, Norway and Sweden, and also in Japan.
-
Workers’ voice is often mediated through representative institutions – such as local trade union representatives, works councils, and/or workers’ delegates – whose prerogatives range from information, to consultation and co-determination in some contexts. At company level, employees’ and/or trade unions’ can also be present in supervisory and management boards. Beyond representation, voice also materialises in practice through the organisation of direct exchanges between workers and managers (e.g. via regular town hall meetings and/or direct consultations). The two forms of voice, however, are not substitutes, notably because the legal protections and rights attached to the status of workers’ representatives are absent in direct voice. In European countries, mixed forms of voice, combining both representation and direct dialogue are the most prevalent. The proportion of workers with access to mixed-voice systems higher in well-co-ordinated bargaining systems.
-
There is significant variation across countries in the overall quality of labour relations as assessed by senior executives and the trust in trade unions among the population at large. These factors are not apparently linked to any specific model of bargaining nor do they show any clear trend over the last 10-15 years. In most OECD countries, the number of workdays lost due to strikes and lockouts has decreased markedly since the 1990s.
There are no comparable and comprehensive indicators on the level of enforcement of collective agreements across countries. However, where estimates are available, compliance with negotiated wage floors is shown to be far from perfect.
copy the linklink copied!Introduction
About 82 million workers are members of trade unions in OECD countries, and about 160 million1 are covered by collective agreements concluded either at the national, regional, sectoral, occupational or firm2 level. In all OECD countries, workers and employers associate to express their interests and concerns and to negotiate the terms and conditions of employment. This process of collective representation, negotiation and decision-making is a key labour market institution and, together with the “right to organise”, is a “fundamental principle and right at work” set by the ILO Convention No. 98 and a key pillar of social dialogue3 at national level.
In the last four decades, collective bargaining systems have weakened. The long-standing decline in union membership rates and increasing individualisation of employment relationships combined with policy reforms fostering the decentralisation of collective bargaining, have severely tested existing collective bargaining systems. Yet as traditional institutions of labour relations are under increasing pressure, the need for mechanisms to overcome conflicts and reach a balance between the interests of workers and employers’ will not fade away. Individual bargaining is not a realistic alternative to collective bargaining as only few employees can effectively negotiate their terms of employment with their employer. Rather, in the absence of functioning collective bargaining, countries are faced with a choice between no negotiation mechanisms at all (which could be particularly problematic in situations where some employers have monopsony power) and state regulation (which might not always allow reaching the best compromise between a diversity of interest).
Even though these general patterns have been widely noted, there is a lack of detailed, comprehensive and comparable information on the evolving nature and scope of collective bargaining in OECD countries. For example, reliable and up-to-date information on the membership of unions and employer organisations and collective bargaining coverage across countries and sectors is limited. Up-to-date and systematic analyses of the drivers of trade union density decline across OECD countries are also missing.
Moreover, standard cross-country analyses of collective bargaining and the summary indicators they typically rely on often do not provide as precise an indication of the actual functioning of collective bargaining as would be desirable. Most of the early empirical work on collective bargaining has been conducted at the macroeconomic level, with an almost exclusive focus on the predominant level of bargaining and the degree of co-ordination. For example, the policy assessment and recommendations of the original and reassessed OECD Jobs Strategy (1994 and 2006, respectively) largely focused on the degree of centralisation of wage bargaining and co-ordination among unions and employer association. The Jobs Strategy suggested that both centralisation and decentralisation could perform well, while a system dominated by sectoral bargaining lacking co-ordination may deliver worse results, as previously had been argued by Calmfors and Driffill (1988[1]).
However, the evidence of recent decades demonstrates the need for a more nuanced picture of how institutional settings in collective bargaining affect labour market and economic outcomes. Indeed, formally similar systems can lead to very different outcomes, depending on the specific ways the system works in practice. For instance, in Denmark, Germany, France, Portugal or Italy, wages are typically negotiated at the sectoral level, but the large differences in the rules and uses of extensions, derogations and opt-out clauses and co-ordination practices lead to significant differences in labour market outcomes, but also in the level of trust in the national collective bargaining system and its functioning.
Therefore, this chapter sheds new light on collective bargaining by providing an updated and comprehensive review of the main features of collective bargaining going beyond the usual indicators, while also documenting recent trends and exploring their causes. The analysis relies on the detailed information collected through the OECD policy questionnaires that were addressed to Labour Ministries, trade unions and employer organisations (see Box 2.1 for more information) and on a rich set of survey and administrative data. The more finely grained description of collective bargaining that emerges will enable better analyses of how collective bargaining affects labour market performance. The chapter is organised as follows: Section 2.1 introduces the main functions and building blocks of collective bargaining systems in place in OECD countries. Section 2.2 presents a detailed and up-to-date portrait of the actors and the scope of bargaining systems. In particular, it provides comparable estimates of trade union density and employer organisation density by country, but also by sector, firms’ and workers’ characteristics. Section 2.3 looks into the drivers of trade union density decline across OECD countries. Section 2.4 provides comparable estimates of collective bargaining coverage by country. It discusses the application of agreements beyond the signatory parties through erga omnes clauses and administrative extensions as well as those regulating the duration of collective agreements. Section 2.5 unpacks collective bargaining systems into their various components. It considers the degree of centralisation, the mechanisms linking different bargaining levels and the use of derogations and opt-out clauses. The different modes and degree of bargaining co-ordination found in OECD countries are also explored together with the actual enforcement of agreements and the quality of labour relations. Section 2.6 describes the types of workers’ voice arrangements that are present at firm level. Section 2.7 provides a summary comparison of the different national collective bargaining systems in OECD countries. It intends to provide a detailed portrait of the system as a whole, rather than just as the sum of its parts. Finally, the last section concludes by discussing the main challenges ahead for collective bargaining systems.
copy the linklink copied!2.1. The functions and features of collective bargaining systems
2.1.1. The functions of collective bargaining
From the perspective of workers, collective bargaining aims at ensuring a fair sharing of the benefits of training, technology and productive growth (inclusive function), at maintaining social peace (conflict management function), and at guaranteeing adequate conditions of employment (protective function).4
Indeed, while often considered mainly as a wage setting institution, collective bargaining also plays an important role for setting other conditions of employment such as job security, working-time regulation, occupational safety and health, provision or access to training (Chapter 4 explores in more details the effect of collective bargaining on these non-monetary aspects). Unions and employer organisations also provide important services to their members such as legal support or public advocacy.
Collective bargaining can also have an impact on wage dispersion and income inequalities (e.g. by affecting employment but also through its influence on management pay at firm level and the tax and benefit system at country level), unemployment levels and competitiveness as well as the way labour market responds to unexpected shocks (see Chapter 3).
Finally, collective bargaining can improve the quality of the employment relationship between workers and firms. It can be a useful tool for self-regulation between workers and employers and bring more stable labour relations and industrial peace, leading to a more efficient allocation of resources, greater motivation and ultimately productivity.
Beyond ensuring those functions for workers, collective bargaining is also a key tool of market control, i.e. reining in wage competition between companies or, on the opposite, limiting the monopsony power of firms which in some cases may profit from a lack of bargaining power of workers. It can increase incentives for companies to invest in innovation, if the presence of a bargaining setting prevents the option of increasing profits by simply reducing wages.
Collective bargaining can also help correcting market failures (such as asymmetry of information and of bargaining power between workers and employers, possibly reflecting monopsony and other labour market frictions). It reduces transactions costs involved in individual bargaining. It can ensure that workers’ requests for pay to increase with productivity are heard therefore preventing excessive turnover of staff, and limiting the extent of costly procedures for handling grievances and complaints.
By contrast, economic theory argues that collective bargaining can introduce market distortions (e.g. “rent seeking behaviour”) by strengthening the power of insiders – both workers (e.g. those with full-time permanent contract) and firms (e.g. companies already operating in the market). When it comes to workers, the logic is that unions are less likely to take the interests of outsiders (e.g. less-skilled, temporary or young workers or young/small firms) into account. However, empirical evidence backing this theory is scarce. Research based on the content of collective agreements shows that the extent to which concerns from outsiders are taken into account does not depend on membership composition (Benassi and Vlandas, 2016[2]). Research in Canada showed that union wage premiums are in fact significantly larger for women, Indigenous persons, non-standard workers, young workers, and new immigrants; while union wage premiums have declined in general over the last two decades in Canada, they have grown amongst women, non-standard workers, and young workers (Gomez and Lamb, 2016[3]). Finally, the recourse to non-standard workers (e.g. temporary workers or agency workers) is found to be higher in unionised workplaces in some studies (Salvatori, 2009[4]), but not in others (Gramm and Schnell, 2001[5]; Autor, 2003[6]). Besides, these associations, where observed, do not back the insider/outsider theory insofar as they do not disentangle between the effect of union and management in hiring decisions.
The overall effect of collective bargaining on economic performance largely depends on the specific features of the system of each country, how they interact with other key parameters of labour market institutions, such as employment protection or minimum wage legislation, but also on prevailing macroeconomic and labour market conditions and policies. Chapter 3 explores the effect of collective bargaining on labour market performance in more details.
Finally, social dialogue can constitute an efficient tool to promote effective consultation and implementation of structural reforms. When social dialogue is well organised and representative, it can help manage and reduce the extent of any trade-offs between different policy objectives.
2.1.2. The building blocks of collective bargaining
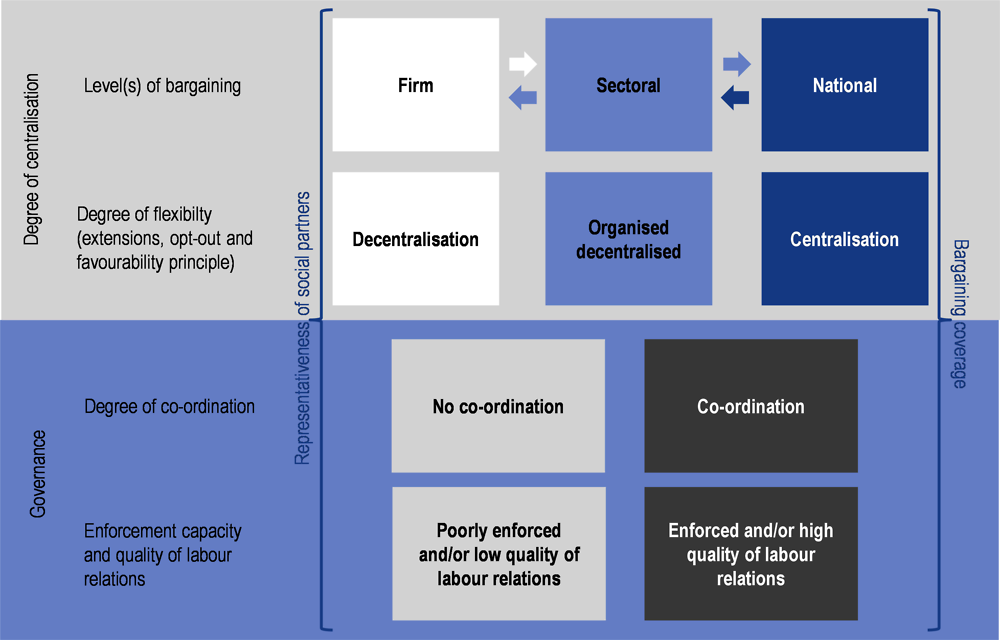
Collective bargaining systems are generally characterised solely based on the (predominant) level at which collective agreements are negotiated (firm level, sector/branch level and the national/cross-sectoral level), and the degree of co-ordination within and between social partners. This is not sufficient to reflect the granularity of the different systems, especially among those where bargaining predominantly takes place at the sectoral level. Beyond bargaining level and coordination, other building blocks of collective bargaining systems need to be integrated to the analysis. Figure 2.1 sketches these key components of collective bargaining systems, which should be taken into account for a comprehensive comparison of national systems:
First, the representativeness of trade unions and employer organisations, measured as the share of workers (firms) who are members of trade unions (employer organisations), as well as the share of workers covered by collective agreements, are key indicators of the strength of social partners and the scope of the bargaining systems. However, they are not enough on their own: the rules governing the administrative extension of collective agreements beyond the signatory parties, and the frequency with which these extensions are used, are also critical determinants of the coverage of collective agreements.
Second, while the predominant level of bargaining (e.g. firm level, sector/branch level or national/cross-sectoral level) defines where parties negotiate, it does not fully capture the actual degree of centralisation or decentralisation. The latter also depends on the rules governing the hierarchy between the different levels, and the possibility for firms to derogate from higher-level agreements or to opt-out of their own agreement in case of economic difficulties. In particular, systems based on sectoral or national/cross-sectoral level bargaining are not necessarily centralised. They can be, if they leave no or little room to modify the terms of agreements to lower-level agreements; or they can be decentralised but in an organised way when firm-level agreements have a significant role in determining the terms of employment but are subject to specific conditions set either by law or by the social partners themselves.
Third, the presence and degree of different forms of co-ordination within and between social partners is also very important to differentiate between systems producing totally independent and atomised negotiations, and those ensuring some synchronisation of different bargaining units when setting their strategy and targets.
Finally, the quality of labour relations, in particular the level of trust between social partners, as well as the enforcement capacity of the terms set in collective agreements, and the ability of employer organisations and trade unions to control the behaviour of their constituency at lower levels, can make a difference between formally similar systems.
copy the linklink copied!2.2. The actors of collective bargaining
2.2.1. Trade unions
Trade (or labour) unions are voluntary organisations of workers that are present in all OECD countries. Sixteen per cent of employees are members of a union on average across OECD countries. However, trade union density, the proportion of employees who are union members, varies considerably across OECD countries, going from 4.7% in Estonia, to about 65% in Sweden, Denmark and Finland and 91% in Iceland.
Trade union density also varies considerably across workforce groups (Figure 2.2). On average across OECD countries, public administrations workers are those most likely to be unionised (Panel A) but only represent 13% of total union members (Panel B). Those working in the good-producing sector (mining, manufacturing, constructions and energy and electricity supply) and in social and personal services (including education and health) respectively represent 25% and 35% of total union members. There are however significant differences in terms of composition across countries: correcting for the various sectors’ weight in the economy, employees in the good-producing sector still represent a much higher proportion of union members in Germany and the Netherlands than in Portugal or the United Kingdom – see Annex 4.A1 in OECD (2017[7]).
The description of the functioning of collective bargaining systems in OECD countries that is presented in this chapter mainly relies on information provided by the responses to the detailed policy questionnaires that were sent to Labour Ministries, employer organisations and trade unions in 2016 (and partly updated in late 2018). The information reported in the chapter (unless otherwise stated) represents the situation in 2018. The focus is on collective bargaining practices in the private sector. In the case of institutional differences across sectors, the answers focus on what is applicable in the agreement that prevails for the manufacturing sector (in case of differences within the manufacturing sector, for the metal workers). Unless otherwise stated, the information in the chapter refers to the entire economy, even if the actual application and use of certain instruments may differ across sectors. The questionnaire addressed to Labour Ministries focused on: i) the architecture of collective bargaining (e.g. structure of bargaining, hierarchy between levels, wage co-ordination, use of extensions, derogations, duration of agreements, etc.); ii) labour relations at firm level (e.g. presence and role of works councils and of other forms of employee representation bodies in the workplace5, rules for unions activity at firm level); iii) the topics covered by collective bargaining (e.g. if and where wages, hiring and firing rules, occupational health and safety, working time are set by collective bargaining and if collective agreements also cover training and/or unemployment insurance); iv) collective bargaining and non-standard forms of work (if and how social partners and collective bargaining also cover flexible forms of work); and v) recent changes (if any) in collective bargaining. The questionnaires addressed to social partners were intended to complement the information provided by Labour Ministries and focused on: i) the actors of collective bargaining (e.g. functioning and membership of employer organisations and unions); ii) the topics of collective bargaining (same as for Labour Ministries); iii) the quality of labour relations; iv) collective bargaining and flexible forms of work (same as for Labour Ministries); and v) recent changes in collective bargaining. All OECD countries have filled in the questionnaire. Canada has sent detailed answers for the federal level and the four biggest provinces (Alberta, British Columbia, Ontario and Québec). The information collected via the policy questionnaires has been complemented and cross-checked with existing data sources (in particular using data from ICTWSS, Eurofound, European Commission, ILO and various individual- and firm-level surveys and administrative data) and the relevant research literature and updated in 2019.
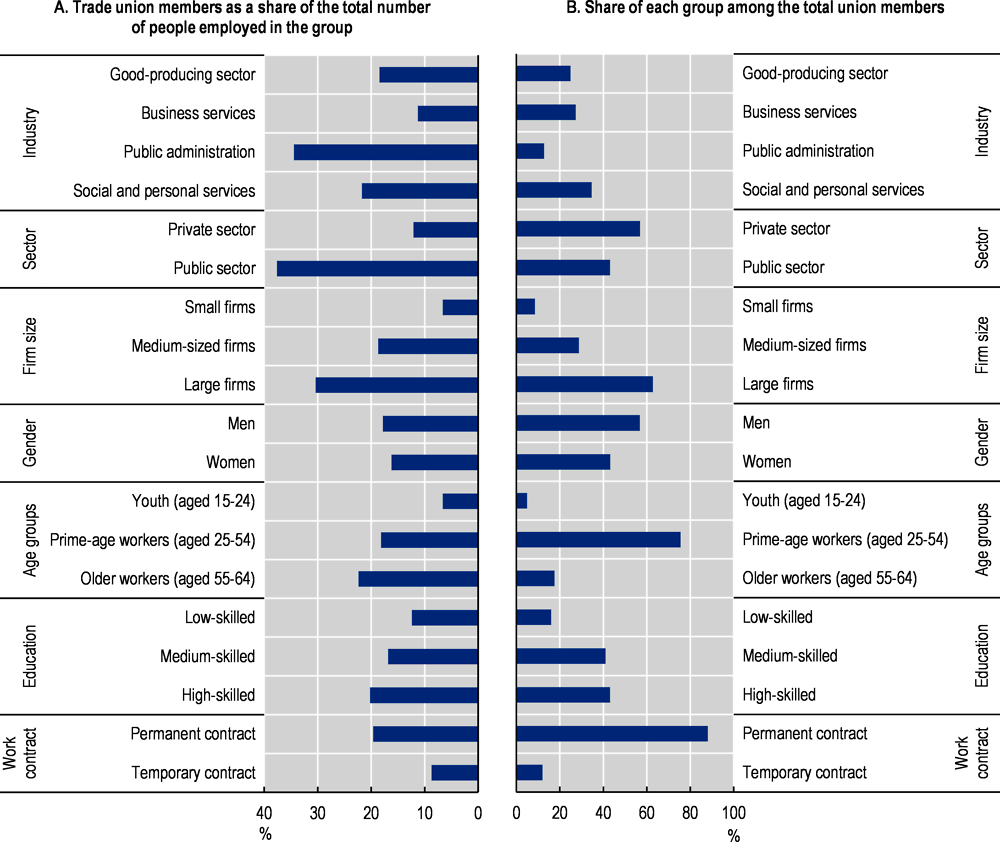
Note: Trade union density by group presented in this figure has been adjusted for the overall trade union density shown in Figure 2.4 by using the share of each individual group in total union membership and total number of employees. For further details on definition, country covered and data sources, see Annex Figures 4.A1 to 4.A7 in Annex 4.A1 in OECD (2017[7]), “Collective bargaining in a changing world of work” in OECD Employment Outlook 2017, https://dx.doi.org/10.1787/empl_outlook-2017-8-en.
Source: Annex Figures 4.A1 to 4.A7 in Annex 4.A1 in OECD (2017[7]), “Collective bargaining in a changing world of work” in OECD Employment Outlook 2017, https://dx.doi.org/10.1787/empl_outlook-2017-8-en.
Only 7% of employees in small firms belong to a union on average across OECD countries, as union members tend to work in large and medium firms. Yet patterns differ across countries: employees in small firms represent a larger share of trade union members in Belgium and Sweden while unions in Japan have no affiliates at all in small firms. Women and men show little difference in terms of their likelihood to be union members when employed (Panel A) but since employment rates are higher for men than women, unions have on average a more masculine membership (Panel B). In 15 OECD countries women outnumber men among union members – see Annex 4.A1 in OECD (2017[7]). Prime age workers constitute the core of trade union affiliates but as a share of the working population, older workers are those more likely to be union members. Youth only represent 7% of total union members in the OECD area, and are the age group least likely to unionise in all countries (see specific discussion on youth and unions in Chapter 2. Union members tend to be medium or high skilled (around 40% of total union members in each group). Finally, union members in all OECD are overwhelmingly workers with a permanent contract, with only 9% being temporary workers.
2.2.2. Employer and business organisations
Employers, business and employer organisations are the other key actors of collective bargaining. In most OECD countries outside Europe, employer associations represent the interests of business (i.e. lobby and voice) but do not bargain collective agreements, with most – if not all – bargaining taking place at the firm level. However, the role of employer organisations in wage bargaining processes is institutionalised in many European countries.
Compared with union density, much less is known about the membership and representativeness of these organisations across OECD countries. Representativeness, in particular, is very difficult to assess: official and up-to-date statistics on the number of workers covered, as distinct from the number of affiliated firms, are very limited, partial and often based only on self-reported data. Further difficulty in providing a precise assessment arises also from the possibility for firms to belong to several employer associations.
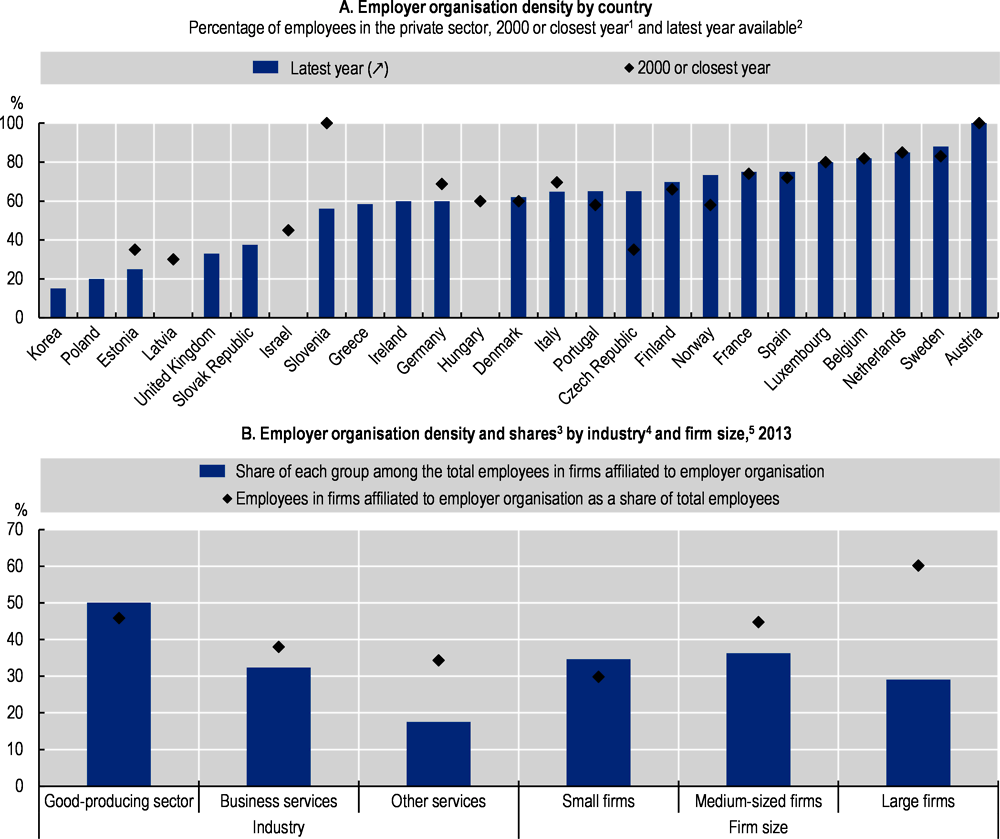
Using available information, Figure 2.3 shows the share of employees in the private sector working in firms affiliated to an employer organisation. On average, employer organisation density in the 25 OECD countries for which data are available is close to 60%. Like trade union density, employer organisation density varies considerably across OECD countries: it is very low in Central and Eastern European countries and Korea, but up to about 80% in the Belgium, Luxembourg, the Netherlands and Sweden (and at 100% in Austria due to compulsory affiliation for all firms).
Membership rates and membership composition are not the (only) elements to gauge the influence and legitimacy of unions and employer organisations. In fact, these rates are closely interlinked with collective bargaining system themselves and often reflect long-term historical patterns. However, they are still good proxies to measure the ability of unions and employers to represent a broad base of workers and firms or in contrast, merely a narrow segment of them.
Differences across OECD countries in employer organisation density partly mirror those in trade union density (the correlation between trade union density and employer organisation density is 0.55 – Annex 4.A1 in OECD (2017[7]). In Austria, Finland, Sweden or Belgium both trade union and employer organisations display high rates, while in Central and Eastern European countries, Korea or Turkey both memberships rates are low. However, based on the number of employees covered, Denmark combines one of the highest union densities among OECD countries with an average employer organisation density; and France has a high employer organisation density together with one of the lowest trade union densities among OECD countries.
In most OECD countries, the share of employees working for a firm that is part of an employer organisation is larger in the good-producing sector compared with the service sector. Employer organisations also tend to be more representative of medium and large firms.
Employer organisations density has been quite stable in the last decades. Most countries (at least for those for which time series are available) show a remarkable stability. Brandl and Lehr (2016[8]) argue that employer associations have been able to adapt their organisational structure as well as their activities to the changing needs of business (for instance by offering negotiation training, legal representation, industrial information, health and safety advice, wage surveys and marketing).
1. 2000 for Austria, Finland, Norway, Slovenia and Sweden; 2002 for Belgium, the Czech Republic, Denmark, Estonia, France, Germany, Italy, Luxembourg, Latvia, Netherlands, Portugal and Spain; 2004 for Hungary; and 2005 for Israel. No data for Greece, Ireland, Korea, Lithuania, Poland, the Slovak Republic and the United Kingdom.
2. 2008 for Greece, Ireland and Portugal; 2009 for Korea; 2012 for Denmark, France and Italy; 2013 for the Netherlands, Slovenia and Spain; 2014 for Belgium, the Czech Republic, Finland, Germany and Luxembourg; 2015 for Estonia and the Slovak Republic; 2016 for Norway, Sweden and the United Kingdom; and 2017 for Austria. No data for Hungary, Israel and Latvia.
3. Statistics refer to establishments of the private sector with ten or more employees in all economic sectors except agriculture, activities of households as employers and activities of extraterritorial organisations. Unweighted average of 24 OECD countries (not including Australia, Canada, Chile, Israel, Japan, Korea, Mexico, New Zealand, Norway, Switzerland and the United States).
4. All sectors reported in Panel B refer to the private sector. Good-producing sector refers to manufacturing (including mining and utilities) and construction; business services refers to commerce and hospitality, transport and communication and financial services and real estate; other services refers to remaining social and personal services excepted activities of households as employers and activities of extraterritorial organisations.
5. “Small firms” refers to firms with fewer than 50 employees; “Medium-sized firms” to firms with 50 to 249 employees; and “Large firms” to firms with 250 employees or more.
Source: Panel A: J. Visser, ICTWSS Database version 6.0. Amsterdam: Amsterdam Institute for Advanced Labour Studies (AIAS), University of Amsterdam. June 2019. Panel B: OECD estimates based on the third Eurofound European Company Survey (ECS 2013).
copy the linklink copied!2.3. Why has trade union density been declining in the last decades?
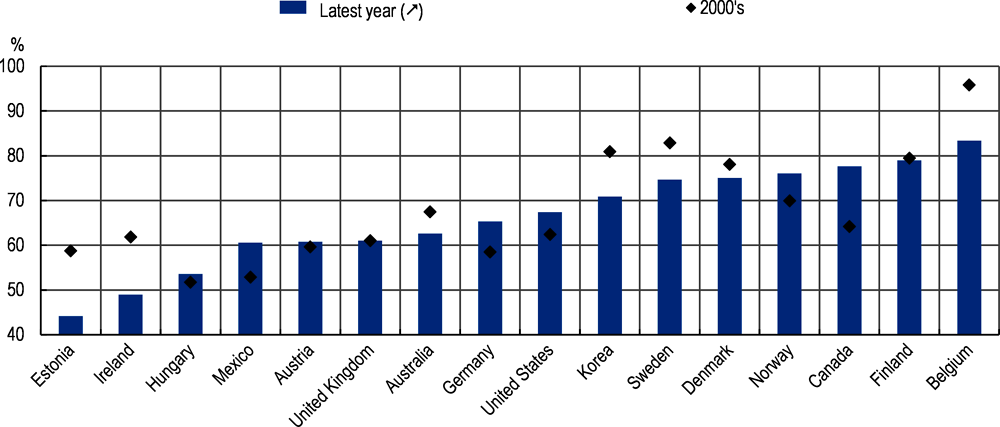
The stability of employer organisations density sharply contrasts with trends in trade union density. Trade union density has been declining in most OECD countries over the last four decades. On average across OECD countries, it went from 33% in 1975, to 16% in 2018 (Figure 2.4).
This average downward trend, however, masks important cross-country variations in terms of initial unionisation levels, the actual direction of trends, and, in countries where it happened, the pace, intensity and timing of the decline.6 First, trade union density in the mid-1970s varied from around 75% in Sweden, to around 20% in France and just above 10% in Korea. Second, while union density declined in a majority of countries, it increased in Iceland and Belgium and was relatively stable over the last four decades in Canada, Korea and Norway. Third, decline was much faster and more abrupt in some countries than in others. In the 1990s, Eastern European countries7, Israel, and New Zealand experienced a fall of at least 30% of union density (Turkey in the 2000s is another example) over a relatively short time-span. By contrast, decline was much more gradual (and much smaller) in countries like Denmark, Switzerland or Chile – where it was more akin, in fact, to a progressive erosion than to a drop. Finally, the timing of decline also differs: it starts in the 1980s in several countries, but already in the 1960s in the United States, Austria or the Netherlands, and much later – in the 1990s-in several Nordic countries. Changes in union density accelerated at various points in time over the period, with individual countries exhibiting specific spikes.
This heterogeneity of the evolution of union density across countries suggests that it may be the result of a combination of country-specific factors rather than global forces – although some drivers might be common across countries or groups of countries.
2.3.1. A literature review of the potential drivers of changes in union density
Globalisation, demographic changes in the workforce, de-industrialisation and the shrinking size of the manufacturing sector, the fall of public sector jobs and the spread of flexible forms of contracts are among the most common hypotheses explored in the literature to explain trade union density decline.
The role of economic globalisation and the related increase in competitive pressure faced by firms is frequently mentioned as a driver of union density decline. For instance Vachon and Wallace (2013[9]) argue that global competition reduces unions’ bargaining capacity, while dependence on Foreign Direct Investments decreases workers’ organising capacity, and immigration affects union density, as non-citizens workers might feel too vulnerable to join them.
Among demographic factors, the increasing participation of women to the labour market used to be considered as a potential driver of decline, as women had lower unionisation rates. Yet, recent empirical studies find that the gender gap in unionisation has closed in many countries, and even reversed in some (Visser, 2006[10]; Schnabel and Wagner, 2007[11]). The rising proportion of workers with a university degree is also discussed as a potential driver of density decline (Morisette, Schellenberg and Johnson, 2005[12]) – but theoretical expectations on this issue in the literature are contrasted. Finally, changes in the age composition of the workforce could also explain the decline in union membership. Blanchflower (2007[13]) argues that the probability of being unionised follows “an inverted U-shaped pattern in age, maximising in the mid-to-late 40s”. As shown in Figure 2.5 above, young workers across OECD countries are less unionised than older ones.

Note: OECD is the employee-weighted average of the 36 OECD Member countries.
Source: OECD/ICTWSS database on trade union density.
This age effect could also hide a cohort effect, if younger generations of workers have a systematically lower propensity to unionise than previous generations. This lower propensity to unionise could stem from various factors, including changes in preferences, or changes in the institutional environment of collective bargaining. Workers coming of age and “learning” about the labour market in an environment where unionisation is more constrained, less efficient because unions have less power, or less socially valued, might have a lower propensity to unionise as a result (Bryson and Davies, 2018[14]; Visser, 2002[15]). Most empirical studies find that changes in preferences do not explain much of the decline in density (see Box 2.2 below). However, studies show that individuals’ willingness to join a union rises after workers have “sampled” membership at work or experienced “unionism by proxy through social interaction” (Bryson and Gomez, 2005[16]; Bryson and Davies, 2018[14]). In that sense, the fall in union density could be a snowballing phenomenon: after an initial fall, further decreases might be the consequence of workers from younger cohorts being less exposed to the benefit of unionisation, and to unionism by proxy.
Another frequent explanation of union decline is that it stems from shifts in the structure of the economy, and in particular from the shrinking of the generally heavily unionised manufacturing sector, and the concomitant rise of the service sector, where workers tend to be less unionised (Gilfillan and McGann, 2018[17]; Farber and Krueger, 1992[18]; Visser, forthcoming[19]). Some studies also find that reduction in average firm size, a corollary of the disappearance of large manufacturing plants, had a negative impact on unionisation (Peetz, 1990[20]; Schnabel, 2013[21]). However, there is also long-standing8 and mounting empirical evidence showing that decline in unionisation within industries is in fact more important in explaining the overall union density decline than industrial re-composition between industries (Schnabel, 2013[21]; OECD, 1991[22]). Another common hypothesis relates the decline in union density to the decreasing share of public sector jobs (Schnabel, 2013[21]; Lesch, 2004[23]).
The increasing prevalence of non-standard forms of employment, such as part-time, fixed term contracts, or employment through temporary work agencies, is another potential driver of density decline (Ebbinghaus, Göbel and Koos, 2011[24]; Fitzenberger, Kohn and Wang, 2011[25]). Across OECD countries, non-standard workers have a lower unionisation rate compared with standard ones (see Figure 5.1 in Chapter 5). Increasing shares of non-standard forms of employment might therefore drive unionisation down. Higher job turnover and smaller average job tenure, resulting in workers’ limited attachment to workplaces, could also reduce their incentives to join unions as well as their opportunities to do so.
Changes linked to social partners themselves could also explain density decline. Numerous studies point to increases in management resistance as a potential cause, especially in countries where unions have to be certified at the workplace level (Legree, Schirle and Skuterud, 2014[26]). Forms of employers’ resistance to unionisation include the use of union avoidance consultants, threats to close workplaces, or illegal firings of workers’ representatives (Bronfenbrenner, 2009[27]). The use of individualised performance management systems, of incentive-based pay structures and other employer-driven changes to work organisation which participate to the individualisation of the working relationship are also evoked as potential causes of union density decline (Bennett and Kaufman, 2002[28]). Authors also point to the inefficiency of unions’ recruitment strategies, arguing that they have failed to expand their reach into growing sectors of the economy (Visser, forthcoming[19]). Inter-union competition for members and union fragmentation are also identified as potential drivers of union decline. Conversely, union amalgamation into larger, less responsive confederations could also foster membership decline (Wooden, 1999[29]).
Trade-union density is particularly low among young workers and has fallen by more than the rate for older workers since 2000 in close to half of the countries shown in Figure 2.5. According to some, this pattern reflects the different preferences of younger generations (Blanchflower, 2007[13]). Young workers have been described as more individualistic than older ones (Berry and Mcdaniel, 2018[30]), less attached to a given firm, and less prone to engage in collective action. Alternatively, some say that they favour environmental and consumer organisations, thus crowding out unions (Inglehart, 1997[31])). Yet another argument is that younger workers find unions unattractive and old-fashioned.
Note: Trade union density by age group for Austria, Belgium, Denmark, Finland, Germany, Norway and Sweden have been adjusted for the overall trade union density by using the share of age groups in total union membership and total number of employees. Estimates based on the European Social Survey (due to size of the sample or of subcategories in certain countries) may be imprecise and are only reproduced to illustrate common patterns across OECD countries. 2000's refers to 2000 for Australia, Canada, Estonia, Sweden, the United Kingdom and the United States; 2001 for Germany; 2002 for Austria, Belgium, Denmark, Finland and Norway; 2003 for Ireland; 2004 for Hungary (second quarter) and Korea; and 2005 for Mexico. The latest year available is 2014 for Denmark; 2015 for Germany and Hungary (second quarter); 2016 for Austria, Belgium, Finland and Norway; 2017 for Canada, Estonia, Ireland, Sweden and the United Kingdom; and 2018 for Australia, Korea, Mexico and the United States. Youth refers to employees aged 20-34 and adults to those aged 35-54.
Source: OECD estimates based on the European Social Survey (ESS) for Austria, Belgium, Denmark and Norway, the Labour Force Survey (LFS) for Canada, the Finnish Working Life Barometer (FWLB) for Finland, the German Socio-Economic Panel (SOEP) for Germany, the Quarterly National Household Survey (QNHS) for Ireland, the Encuesta Nacional de Ocupación y Empleo (ENOE) for Mexico, and the Current Population Survey Merged Outgoing Rotation Groups (CPS-MORG) for the United States. Data provided by national statistical authorities based on the Survey of Employee Earnings, Benefits and Trade Union Membership (EEBTUM) and the Characteristics of Employment (COE) Survey for Australia, the Labour Force Survey (LFS) for Estonia, the Labour Force Survey (LFS) for Hungary, the Economically Active Population Survey (EAPS) for Korea, the Labour Force Survey for Sweden, and the Labour Force Survey for the United Kingdom.
Could systematically different preferences among young workers explain their lower rates of unionisation? Using available longitudinal survey data on attitudes, it is hard to find clear evidence supporting this hypothesis. As shown in Figure 2.6 (Panels A and B), in a majority of countries, respondents aged 20 to 34 are more attached to both individual freedom and solidarity with others than those aged 35-54. Young respondents are also more supportive of collective actions such as attending a demonstration or raising funds for a social or political cause than their older peers in most countries (Panels C and D). Finally, the proportion of 20-34 year olds who are members of environmental (8.4%) or consumer organisations (6.5%) is on par with that of older respondents (9.5% and 7.7%) (World Value Survey, 2010-2014). In addition, contrary to the “crowding out” hypothesis, Ebbinghaus et al. (2011[24]) find that such engagement is in fact positively associated with union membership.
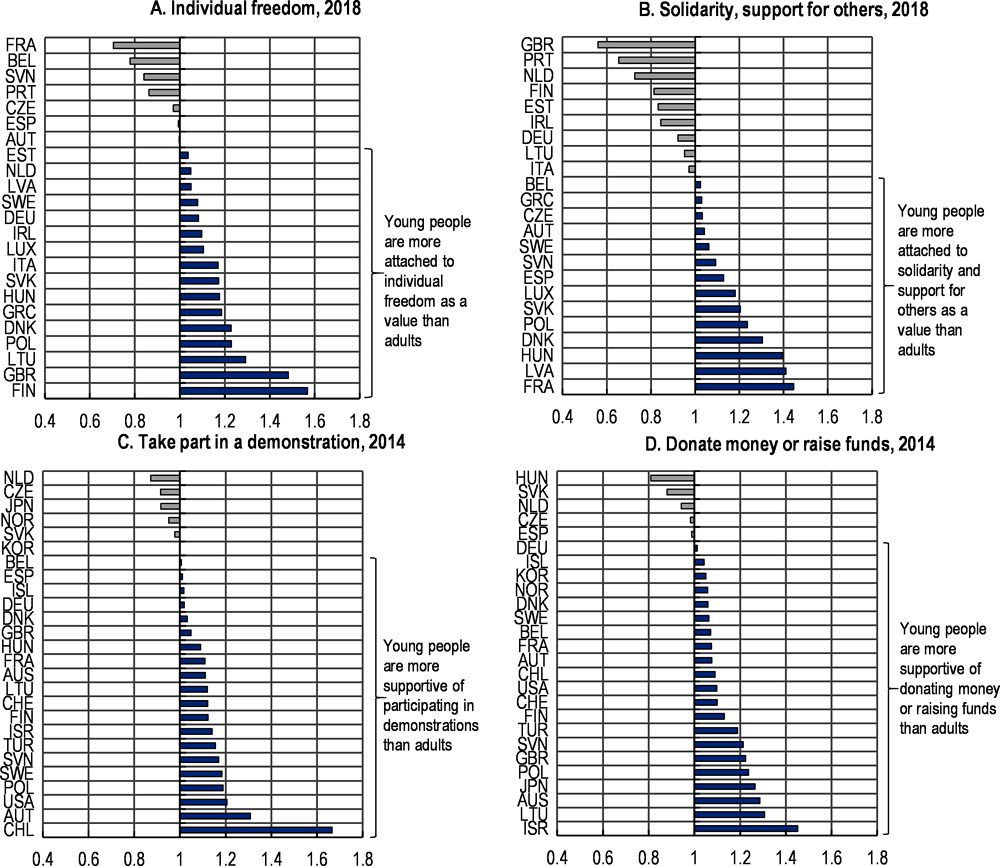
Note: Statistics in Panels A and B are based on a question about respondents’ three most important personal values. In Panels C and D, statistics refer to individuals who ever participated or might participate in particular collective actions. See Annex 2.D for further details.
Source: OECD calculations based on the Standard Eurobarometer 89, March 2018 (Panels A and B) and the International Social Survey Programme (ISSP) 2014, Citizenship module II (Panels C and D).
Moreover, in contrast with commonly held ideas about young workers disliking unions, confidence in trade unions is higher among young workers than among older ones in 23 out of 32 countries (Figure 2.7, Panel A). These measures are consistent with various country case studies: for instance, Bryson et al. (2005[32]) found a substantial frustrated demand for unionisation among young workers in Canada, the United Kingdom and the United States.
In these latter two countries, higher trust in trade unions among young workers is associated with a higher perception of unions’ indispensability in protecting workers’ rights. However, in two-thirds of the countries represented in Figure 2.7 (Panel B), young workers appear less convinced than older ones that workers need strong unions to protect their interests. This leads to a surprising pattern in countries like Denmark, France, Latvia, Lithuania, Slovenia, or Sweden, where young respondents are more confident in unions than older respondents but less convinced that workers need them to protect their rights. Explaining these contradictory patterns is beyond the scope of this box. However, these data do not support strong claims about young workers’ weaker interest in collective action driving the age related membership differential.
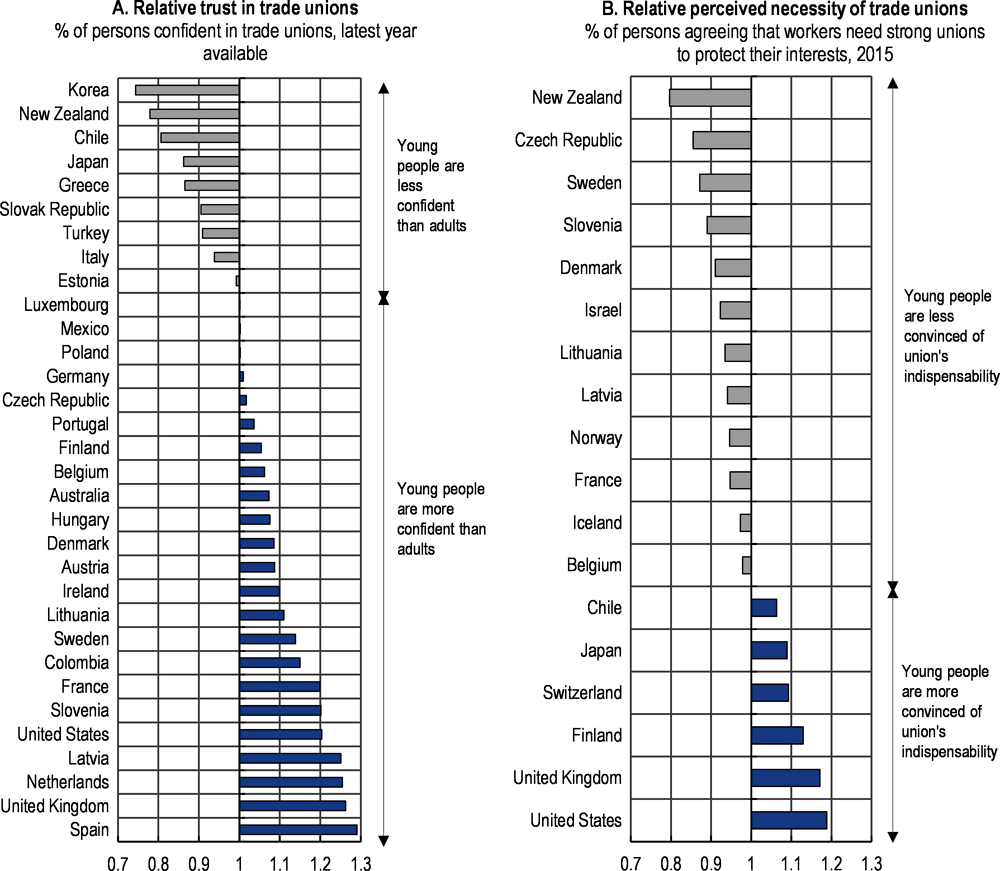
Note: Youth refers to persons aged 20-34 and adults to those aged 35-54. The latest year available in Panel A refers to 2010 for Japan and Korea; 2011 for Chile, New Zealand and the United States; 2012 for Colombia and Mexico; 2016 for Australia; and 2018 for all the European countries. In Panel B, Belgium refers to Flanders only and age groups for Denmark refer to youth aged 26-35 and adults aged 36-55. For further details, see Annex 2.D.
Source: Panel A: OECD calculations based on the Australian Election Study (AES) for Australia, Eurobarometer 89.1, March 2018 for the European countries, and the World Value Survey (WVS) for all other countries. Panel B: OECD calculations based on the International Social Survey Program (ISSP) 2015, Work Orientation module IV and the Pew research Center Poll (March 2015) for the United States.
If not preferences, then what could explain the membership differential between younger and older workers? Structural labour market factors are good candidates for an explanation. Indeed, young workers tend to work in sectors characterised by weak union presence, which limits their opportunity to join unions in the first place. They are also disproportionately employed on non-standard contracts, which reduces the benefits and increases the costs of union membership (Ebbinghaus, Göbel and Koos, 2011[24]). Annex Figure 2.D.1 shows that composition effects provide a partial answer to the puzzle of young people’s lower unionisation. When controlling for various factors including gender, educational level, type of contract (temporary vs open-ended), industry, public vs. private sector, occupation, firm size and full time vs. part-time employment, the gap in young-to-adult union membership is reduced in all countries studied. However, it is closed in none. Composition effects significantly close the gap in the United States, Canada, or France but explain relatively little in the United Kingdom or Germany – while a differential of around 30% remain in these last three countries. While non-standard employment has developed in the last two decades, composition effects are not explaining a larger part of the membership differential in recent years compared with the 2000s.
Another prevalent explanation in the literature is that union density is lower among young workers because they have not yet had a chance to evaluate the benefit of union membership. Exposure to union benefit and union membership would be part of one positive self-reinforcing loop (Givan and Hipp, 2012[33]). Yet because of their limited labour market experience, young workers might have a limited awareness of unions and their purpose (Keune, 2015[34]) – in other words the probability that they have not yet entered that loop is high. This is consistent with Bryson et al. (2005[32])’s description of union membership as an experience good: it can only be properly valued after one has been exposed to it.
Young workers also face higher entry barriers to unionisation. Supply-side constraints such as employers’ resistance to unionism, the lack of dedicated recruitment efforts from unions (Vandaele, 2012[35]), or the relatively high cost of membership rates might also explain the lower unionisation of young workers.
A last group of hypotheses considers the role of institutional change. First, a large number of studies point to reforms of national legislations regulating collective bargaining as important determinants of density decline. Some policy reforms have made it harder for unions to recruit members. For instance, in Sweden, policy-mandated increases in membership fees have driven membership down (Kjellberg, 2011[36]). In some countries, the move towards firm-level bargaining has contributed to reduce union bargaining power and as a result their relevance and attractiveness to workers (Australian Bureau of Statistics, 2000[37]; Legree, Schirle and Skuterud, 2014[26]). Second, the deterioration or erosion of institutions that historically favoured unionisation could explain part of the density decline. For instance, while the existence of insurance funds administered by union-affiliated institutions9 historically encouraged workers’ unionisation, their erosion – following reforms or the development of private alternatives – might explain part of the decline in union density (Cohen, Haberfeld and Mundlak, 2007[38]; Ebbinghaus, Göbel and Koos, 2011[24]). Böckerman and Uusitalo (2006[39]) show that the erosion of the Ghent system in Finland following the development of private insurance funds explains density decline there – see also Høgedahl and Kongshøj (2017[40]). Third and finally, other labour market institutions could have crowded out unions by granting workers protections and thus decreasing the need for unions. Legislative progress in matters of employment protection, benefit duration, or indexation clauses (Checchi and Lucifora, 2002[41]) as well as the use of mandatory extension provisions and/or the presence of a minimum wage could decrease workers’ demand for union protection (Flanagan, 2005[42]). The development of alternative means of meeting workers’ demand for voice, such as employee involvement initiatives could also generate a crowding out effect (Morisette, Schellenberg and Johnson, 2005[12]).
2.3.2. Contrary to an enduring notion, demographic and structural shifts in the economy explain only a marginal part of the fall in trade union density
Available data10 do not allow undertaking reliable analyses on the role of economic globalisation, changes characterising social partners themselves, and institutional change on a cross-country basis.11 The relevance of these macro-level drivers can only be properly assessed through longitudinal country-specific analyses; these should be the object of future research. This chapter focuses on what can be done using individual-level data, and tests the effect of: i) demographic changes; ii) changes in jobs characteristics (changes in the size of sectors/industries and the development of non-standard jobs); and iii) generational replacement (i.e. the replacement of older cohorts by younger ones).
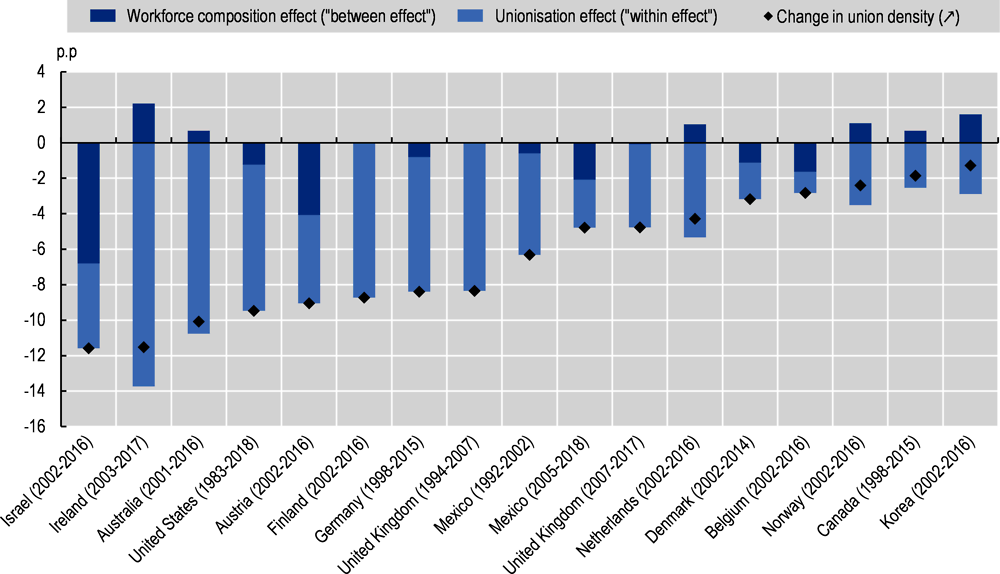
A multivariate decomposition analysis is used to test the first two hypotheses (see Annex 2.A for details on the method, the data, the model specification, and the time-periods covered by this analysis).12 Changes in trade union density are decomposed in two parts. The first part (“workforce composition effect”) is linked to changes in the relative size of particular groups of workers, such as female workers, highly educated workers, or workers on particular type of contracts, who are characterised by different propensities to unionise. The second part (“unionisation effect”13) is linked to changes in individuals’ propensity to unionise within groups. Using a multivariate decomposition approach allows identifying the effect linked to changes in the relative size of each particular group in the workforce.
Figure 2.8 below presents results from this analysis. Transformations affecting the composition of the workforce are no silver bullet explanatory factors of union decline across OECD countries. They contribute a small amount to a decrease of trade union density in 8 out of the 15 countries studied (Austria, Belgium, Denmark, Germany, Israel, Mexico, the United Kingdom and the United States), but to an increase in others. In Australia, Finland, Germany, the United Kingdom, and the United States, the contribution of composition changes to density decline is very small. Composition changes contributed substantially to union density decline (Annex Table 2.C.1) in Austria (45% of the 9 percentage point drop in union density over the observed period) and Israel (59% of a 11.6 percentage point drop). In Belgium and Denmark, composition changes explain a substantial part of what is a relatively small decline in union density (58% of a 2.8 percentage point drop and 36% of a 3.2 percentage point drop respectively).
Looking at particular factors in more details, the effect of demographic changes is generally very small (Figure 2.9). Demographic changes contributed to increasing, rather than decreasing, trade union density in 12 out of 15 countries studied. No clear cross-country pattern emerge when looking at the effect of particular demographic drivers (Annex Figure 2.C.1). Increases in the share of women in the workforce resulted in small decreases of union density in Austria, Belgium, Norway and the United Kingdom (1994-2007). Changes in education levels contributed to decreasing union density in Austria, Belgium, Denmark, Israel, Korea, the Netherlands, the United Kingdom (1994-2007) and the United States.14 Finally, changes in the age composition of the workforce contributed to decreasing union density over the whole period considered in Canada, Israel, Mexico (2005-18) and the United Kingdom (1994-2007).15 Effects also vary when considering different sub-periods (Annex Table 2.C.2). For instance, demographic changes contributed negatively to changes in union density between 1994 and 2007 in the United Kingdom, but positively after that. Overall, these results suggest that demographic changes are a (minor) part of the equation in some countries and in particular sub-periods, but did not drive density decline in all countries over the whole period considered.
Changes in job characteristics (i.e. industry, sector, occupation) contributed a relatively bigger but still minor part to union density decline. Overall changes in job characteristics contributed to the decrease in trade union density in 8 out of 15 countries. Occupational shifts and industrial re-compositions contributed to union density decline in 10 countries (Annex Figure 2.C.2). Changes in average firm size contributed to decrease in union density over the observed period in Israel, Mexico (2005-18) and the Netherlands.16 Finally, changes in the size of the public sector contributed to small decreases of union density in Australia, Germany, Mexico, the United Kingdom (2007-17) and the United States.17 Again, these effects vary across time within countries (Annex Table 2.C.2).
Note: Multivariate decompositions analysis based on probit regressions including control for sex (female), age groups, education, migrant workers, job tenure, type of contract (part-time), contract duration (temporary jobs), occupation, industry, quintiles of the hourly earnings, sector (public sector) and firm size. See Annex 2.A for further details on the methodology and Annex 2.B for details on definitions and variables included in the analysis.
Source: See Annex Table 2.B.1.
Finally, increases in the share of non-standard forms of employment, and in particular the increasing incidence of part-time employment, contributed a minor part to union density decline in some countries (Annex Figure 2.C.3). Changes in the proportion of part-time employment18 contributed a little to union density decline in Australia, Belgium, Denmark, Finland, Germany, Ireland, Israel, Korea, Mexico (1992-2002) and the Netherlands. The effect of changes in job tenure could only be tested for a limited number of countries. Changes in job tenure contributed a little to union density decline in Germany and the United Kingdom (1994-2007). Shifts in the proportion of temporary vs. permanent workers contributed to small decreases in union density in 11 cases.19 However, again, these changes leave the bigger part of union density decline unexplained.

Note: Multivariate decompositions analysis based on probit regressions including control for sex (female), age groups, education, migrant workers, job tenure, type of contract (part-time), contract duration (temporary jobs), occupation, industry, quintiles of the hourly earnings, sector (public sector) and firm size. See Annex 2.A for further details on the methodology and Annex 2.B for details on definitions and variables included in the analysis.
Source: See Annex Table 2.B.1.
2.3.3. Density decline is not linked to generational replacement in most countries studied
As explained in the literature review above, union density decline could be a cohort effect, if workers from younger cohorts have a systematically lower propensity to unionise than their older peers. This third hypothesis is tested through a regression analysis using individual-level data on unionisation. Results are presented in Figure 2.10, which shows, again, a contrasted picture across countries: differences in propensity to unionise between the cohort of workers who came of age in the 1960s and later cohorts are statistically significant in some, but not all contexts. Further, workers’ propensity to unionise appears to have decreased over time in some countries, but increased in others.
In a limited number of contexts, changes in the propensity to unionise in later cohorts compared to that of workers socialised20 in the 1960s coincide with movements in trade union density, and could potentially be explained by generational replacement. In Germany notably, union density started falling in the early 1990s, and Figure 2.10 shows that cohorts of workers socialised in the 1990s and the 2000s were significantly less likely to unionise than colleagues who preceded them. By contrast, cohort effects are unlikely to be involved at all in the explanation of density decline in Ireland, where workers’ propensity to unionise continuously increased since the generation of those socialised in the 1960s, while trade union density started falling in the 1980s. Cohort effects in Korea are also continuously positive (and increasing) since the 1960s. In Austria, differences in propensity to unionise between cohorts are never statistically significant.

Note: Logit regressions on trade union density controlling for cohorts (as reported), sex (female), age groups, education, migrant workers, job tenure, type of contract (part-time), contract duration (temporary jobs), occupation, industry, quintiles of the hourly earnings, sector (public sector) and firm size. See Annex 2.B for details on definitions and variables included in the analysis. n.a: not available.
Source: See Annex Table 2.B.1.
However, in countries where union density decline looks like a cohort phenomenon, it is unclear whether generational replacement itself is the driver or trade union density decline, or whether both phenomenon (declining union density and the cohort effect) are caused by another factor, e.g. institutional changes characterising the moment when workers from younger cohorts were socialised. For instance, the negative effect on unionisation observed for German workers socialised in the 1990s and 2000s might at least partly reflect the effect of German reunification on workers who were 20 years old in the 1990s. If union density decline is indeed a snowballing phenomenon as suggested above, declining propensities to unionise in younger cohorts might in fact be consequences of earlier falls. For instance, in Finland, negative cohort effects appear after the start of trade union density decline. Finally, even in cases where generational change could have fostered union density decline, the exact mechanisms driving the decline in unionisation in younger cohorts remains unclear.
2.3.4. Country-specific research is necessary to understand the variety of union density decline stories unfolding across country and time
Four main messages emerge from the analyses presented above. First, contrary to a commonly held belief, the cumulative contribution of transformations affecting the composition of the workforce and the nature of jobs supplied is relatively small: it leaves the bigger part of the phenomenon unexplained. Hypotheses that could not be tested to characterise this unexplained component (related to the changing attitudes of social partners, an increasing exposure to global competition, or institutional changes ranging from the erosion of institutions favouring unionisation, to changes in collective bargaining legislation) appear like promising avenues for future research.
Second, union density decline is not linked to generational replacement in most countries studied. Where density decline looks like a cohort phenomenon, the precise mechanism driving down unionisation in younger cohorts remains to be explored; it is likely to vary across countries.
Third, trade union density appears to be a largely multifaceted phenomenon, which varies across countries and time. Behind the apparently common trend characterising OECD countries, there appears to be a collection of country-specific stories. Within countries, trade union density decline is likely to be the cumulative product of a variety of smaller episodes of decline at particular points in time, driven by particular causes.
These three messages point to a fourth one, namely that future research should focus on country-specific analyses. This would also allow properly testing the hypotheses related to institutional change, which are largely context-specific.
copy the linklink copied!2.4. The scope of collective bargaining
2.4.1. Collective bargaining coverage
The share of employees covered by collective agreements (the collective bargaining coverage21) also declined significantly over the past 30 years. This indicator is key for comparing the relative strength of collective bargaining across countries since it captures the extent to which workers’ employment conditions are actually influenced by collective negotiation. On average across OECD countries, it shrunk by a fourth, from 45% in 1985 to 32% in 2017 (Figure 2.11). With the exception of some of the countries which passed major labour market reforms during the last five years, the recent economic crisis did not represent a particular turning point and coverage continued to decline.
As with trade union density, the decline was the strongest in Central and Eastern European countries where the collapse of the old regimes led to abrupt changes in the role of trade unions and collective bargaining. Steep decreases were also observed in Australia, New Zealand and the United Kingdom where deep reforms took place in the 1980s. Coverage has been relatively stable in most continental European countries except for Germany and coverage also decreased more recently in Greece. The drop in collective bargaining coverage in Portugal during the crisis years is the subject to methodological controversies which are discussed in Box 2.3.
All in all, collective bargaining coverage is high and stable only in countries where multi-employer agreements (mainly sectoral or national) are negotiated (even in several of the Southern European countries where trade union density is quite low). A second key element which matters for bargaining coverage is the relative strength, and willingness to negotiate, of employer organisations since they negotiate and sign collective agreements which in most countries then apply to all workers of their affiliated firms.22 Indeed in countries where employers’ density is high, coverage is also relatively broad and vice versa (with a correlation of 0.90; see Annex Figure 4.A1.11 in OECD (2017[7])). The relationship with trade union density is weaker (correlation of 0.64) and collective bargaining coverage is significantly higher than trade union density as in most countries agreements also apply to non-union members (see below the detailed discussion on erga omnes clauses and administrative extensions).

Note: OECD is the employee-weighted average of the 36 OECD Member countries.
Source: J. Visser, ICTWSS Database version 6.0. Amsterdam: Amsterdam Institute for Advanced Labour Studies (AIAS), University of Amsterdam. June 2019, http://uva-aias.net/en/ictwss.
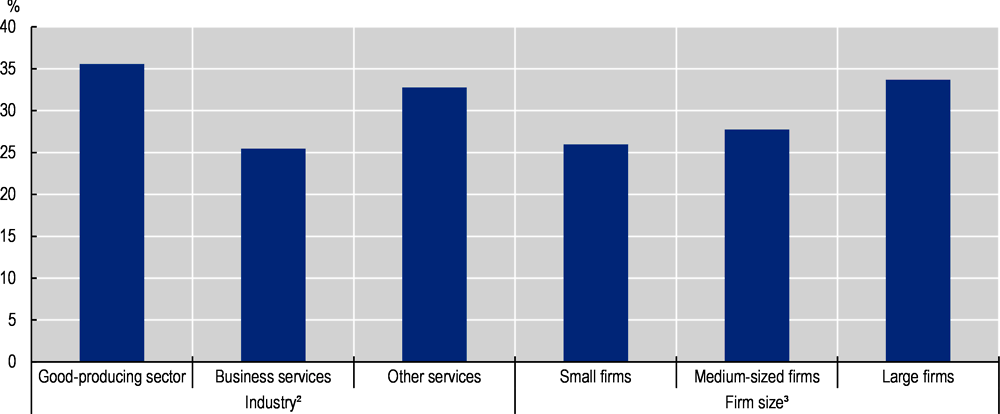
On average across OECD countries, collective bargaining coverage is slightly higher in the good-producing sectors (manufacturing, constructions and energy and electricity supply) than in business services or other sectors (Figure 2.12). However, firm size matters: 26% of workers are covered by a collective agreement in small firms while 34% are covered in large firms. In small firms, the probability of being covered by a collective agreement is much lower in the absence of a multi-employer agreement at sectoral or national level as small firms are much less likely to negotiate and sign a firm-level agreement. Indeed, in Chile, Estonia or Turkey collective agreements cover a negligible share of small firms, contrary to what happens in Nordic or continental European countries.
Note: Statistics refer to the private sector only and to all firms for Australia and Canada excepted firms with less than five employees for Chile, firms with less than ten employees for Belgium, Greece, Italy, Slovenia and Sweden, and firms with less than 11 employees for other countries. OECD weighted average of 30 OECD countries (not including Israel, Japan, Korea, Mexico and New Zealand) for statistics by industry and 29 OECD countries (not including countries previously listed and the United States) for statistics by firm size.
← 1. Statistics refer to 2013 for Belgium, Greece, Iceland, Ireland, Italy, Slovenia and Sweden; 2014 for Chile and all other European countries; 2015 for Canada and the United States; and 2016 for Australia.
2. Good-producing sector refers to manufacturing (including mining and utilities) and construction; business services refers to commerce and hospitality, transport and communication and financial services and real estate; other services refers to remaining social and personal services excepted activities of households as employers and activities of extraterritorial organisations.
3. “Small firms” refers to firms with fewer than 50 employees; “Medium-sized firms” to firms with 50 to 249 employees; and “Large firms” to firms with 250 employees or more.
Source: OECD calculations based on the Survey of Employee Earnings and Hours (EEH) for Australia, Labour Force Survey for Canada, administrative data for Chile, the Current Population Survey (CPS) for the United States, the third Eurofound European Company Survey (ECS 2013) for Belgium, Greece, Iceland, Ireland, Italy, Slovenia and Sweden, and the 2014 Structure of Earnings Survey (SES 2014) for all other European countries.
In the wake of the Portuguese labour market reform that introduced in 2012 significant changes to the way collective bargaining works (largely reversed since then), making notably the rules for administrative extensions more rigid, there has been much debate on the extent of bargaining coverage decrease. Indeed, computing collective bargaining coverage is not straightforward, despite good and detailed data (Quadros de Pessoal, Personnel Records, a compulsory survey of all firms, conducted annually in October) as it requires a series of assumptions.
An ILO report (ILO, 2014[43]) for instance argues that the 2012 reform led to a 80% decrease in coverage based on the drop of the number of sectoral and firm-level agreements between 2008 and 2012 (from 300 down to 85) bringing the number of workers covered by these agreements from 1.9 million down to 300 000.
Addison et al. (2016[44]) counter that these figures mix stocks and flows. In particular they point out that, while the flow of new agreements considerably slowed down after the reform, the stock of workers covered by collective agreements barely changed between 2008 and 2012 (at around 90%), as many workers remained covered by the former agreements. This stability has also been confirmed using more recent data for 2014 (OECD, 2017[45]).
National estimates based on Quadros de Pessoal published by the Portuguese Labour Ministry in its recent Green Paper on Labour Relations (Ministério do Trabalho, 2016[46]) show a decrease in the stock of workers covered from 85.4% in 2010 to 80.5% in 2014 and a large decrease in terms of flows of workers covered, from 54.1% in 2010 to 10% in 2014.
Data from the Institutional Characteristics of Trade Unions, Wage setting, State Intervention and Social Pacts (ICTWSS Database) are less dramatic than those of ILO report, but they also find a significant fall of coverage rate from 84.9% in 2007 to 72.2% in 2013. These estimates are based on the same numerator (i.e. stock of workers covered by collective agreements) as Addison et al. (2016) but use a different denominator (e.g. OECD employment data to include temporary, part-time and agricultural workers, yet excluding employees in the public sector whose terms of employment are not set by collective agreements).
However, Visser (2016[47]) argues that even the ICTWSS estimates should be taken with great caution given that many workers are actually covered by old agreements whose wage floors may not be binding anymore as they are probably below the minimum wage level (but non-wage conditions still apply). Fougère et al. (2016[48]) report the same for France. Naumann (2018[49]) finds that, in 2013, at least half of valid collective agreements in Portugal have more than eight years and around 30% of employees covered by collective agreements have not had their contracts renewed since 2009. While similar computing problems are encountered in France for instance, in the Netherlands expired agreements are removed from the register and no longer counted (with one year delay).
In conclusion, providing clear-cut estimates of effective collective bargaining coverage is far from easy, in Portugal as in most of other countries. Using only flow data (new agreements) is not correct as it would lead to ignore workers who are still covered by old agreements. At the same time, using stock data is also problematic, as in some cases agreements may not be binding anymore, or only partially, leading to an overestimation of coverage. Changes in average duration of agreements and possible retroactivity of agreements further complicate the estimation. Furthermore, the choice of the denominator is also crucial in the computation, especially in light of the widespread use of non-standard forms of employment, not systematically well covered in standard surveys.
2.4.2. Extensions and erga omnes provisions
In many OECD countries, the share of workers covered by collective agreements is significantly higher than the share of workers who are member of a trade union. At the same time, collective bargaining coverage patterns have been much more stable than trade union membership. This difference is sometimes somewhat improperly referred to as “excess bargaining coverage” and used as a proxy for administrative extensions of collective agreements, while it is actually the result of both erga omnes (literally in Latin, “towards everybody”) clauses and administrative extensions.
In principle, an agreement between unions and an employer or employer organisations applies only to the signatory parties (“double affiliation principle”). Erga omnes clauses extend the terms set in a collective agreement to all workers, not only to the members of signatories unions. Erga omnes clauses are usually embedded in the law. However in most countries where agreements are legally binding only for members of the signatory trade unions (Table 2.1), employers often voluntarily provide the same or similar conditions for all employees within the company (sometimes because employers do not know who is a union member). Erga omnes clauses simplify the system (since the same terms apply to all workers), increase fairness, limit rivalries and help social peace and reduce transaction costs. However, erga omnes clauses may also represent a disincentive for workers to become members of a union (a typical free-rider problem).
Extensions (or administrative extensions) go one step further and cover workers in all firms within an industrial sector, including also firms that have not signed the agreement or are not affiliated to an employer organisation which signed the agreement. Extensions are usually an “act of public policy based on an explicit legislation mandating the government, a public agency or in some cases a court to apply the collective agreement beyond its signatories” (Visser, 2018[50]). Extensions, or their functional equivalent,23 are present in two-thirds of OECD countries. However, their specific functioning is extremely diverse: in some countries agreements are extended by default (e.g. in Iceland, Italy and Spain where agreements cover all firms), in some quasi automatic (e.g. in France), in others very rare (e.g. Japan or Central and Eastern European countries). In some countries they are subject to some criteria. In Germany, for instance, any extension decision has to pass a binding advice of the tripartite committee in the Labour Ministry (until 2015 there was also a threshold of 50% of workers covered by signing firms) and is de facto subject to a veto from employers. Table 2.2 summarises the frequency of extensions and the criteria used to grant them across OECD countries. The figures in parenthesis refer to the additional coverage rate (as a percentage of employees) provided by extension measures.
Extensions are often issued out of fairness considerations to ensure the same treatment and standards to all workers in the same sector, in particular for workers for foreign firms or service providers, and migrant and posted workers (Hayter and Visser, 2018[51]). By doing so, extensions can level the playing field across firms and ensure a fair competition.24 Extensions also reduce the transactions costs linked to lengthy and detailed negotiations over the terms of employment, especially for small firms that lack the resources (or do not have workers representation) to engage in firm-level bargaining in which case workers would never be covered by an agreement (Blanchard, Jaumotte and Loungani, 2014[52]). In some cases, extensions are also issued in order to guarantee the stability of the collective bargaining system and the sustainability of some forms of “public goods” such as sectoral training and mobility schemes that are funded via collective agreements (De Ridder and Euwals, 2016[53]; Hayter and Visser, 2018[51]). Finally, extensions also contribute to spread best practices in terms of personnel management, training, health and safety, technology usage, insurance, retirement packages, or performance-related incentives.
On the opposite, extensions can become a tool of unfair competition, for instance when extensions are used by “insider” firms to drive competitors out of the market (Haucap, Pauly and Wey, 2001[54]); Magruder, (2012[55]); Martins (2014[56]). More in general, extensions may also have a negative impact when the terms set in the agreement do not account for the economic situation of a majority of firms in the sector: for instance, when the employer association is representative only of large and relatively more productive firms (and hence willing to pay higher wages), it may agree on wage floors and other components that are not sustainable for smaller and less productive firms. Finally, delayed extensions that require the payment of sizeable pay arrears can also severely affect the labour market during a period of liquidity constraints for firms – see Hijzen and Martins (2016[57]) for the case of Portugal.
In order to partly alleviate these concerns, extensions may be issued when the “collective agreement already covers a number of the employers and workers concerned which is, in the opinion of the competent authority, sufficiently representative”, as stated in the ILO Recommendation on collective agreements (No. 91). In several OECD countries administrative extensions are subject to threshold representativeness criteria (more details in the detailed tables available online25): collective agreements can only be extended if they are signed by employer organisations representing a minimal share of workers (most often the majority). A few countries also request that signing unions represent a majority of workers. However, while these criteria may be important, a more important concern is to ensure that signing employer organisations do not only represent a few selected firms. In most countries these thresholds are checked only at the moment of signing the agreement or issuing the extension. An exception is in Switzerland, where they must hold for the entire duration of the agreement; therefore if coverage drops below the 50% threshold, the extension must expire (Visser, 2018[50]). Introducing representativeness criteria in countries where they do not exist is not straightforward. As the 2012 Portuguese reform shows, it is not easy to define criteria that are sufficiently strict to be meaningful, while easy to be fulfilled hence allowing an effective role for extensions. Hijzen et al. (2019[58]) suggest opting for a gradual increase of the thresholds over time to ensure that non-representative extensions are eliminated and give time to employer associations to increase their membership levels, especially amongst smaller firms.
Having reliable and up-to-date statistics on trade unions’ and employer organisations’ membership is in all cases a necessary condition in order to have meaningful representativeness criteria. Portugal was able to swiftly introduce representativeness criteria in 2012 (then removed in 2017) thanks to the detailed information on firms’ membership of an employer organisation contained in the Quadros de Pessoal. However, this is rather an exception across OECD countries. Membership figures of both trade unions and employers, as well as other indicators such as, for instance, the votes obtained at social elections, can be used as an indicator of the relative bargaining power of social partners and influence government actions. Bargaining parties may thus have an incentive to inflate statistics in search of influence power, in particular since official, detailed and up-to-date statistics on unions, employer organisations and collective bargaining are not widespread. Therefore, enhancing the reliability and accessibility of such data would help inform and improve the policy debate on collective bargaining.
Representativeness criteria based on thresholds may prove too rigid and unhelpful when the stability of the collective bargaining system or of common funds is at stake. Partly for these reasons, the threshold of 50% in Germany have been dropped. Alternatively, a possibility to derogate from the representativeness criteria could be left open in certain circumstances. In Switzerland, for instance, when unions can prove to public authorities that in a specific sector it is particularly complicated to organise workers (for instance, because of a high presence of foreigners or because of security issues that restrain the possibility to reach and organise workers on their workplace) there is a possibility to derogate from the criterion requiring that signing unions represent a majority of workers.
OECD countries could also submit the extension of collective agreements to a test of public interest, by which extensions could be denied if the social and economic circumstances do not warrant extending the terms beyond the signatory parties or, on the opposite, issued to safeguard the public interest (for instance to stabilise the collective bargaining system or avoid free-riding in common funds such as for training). As argued in OECD (2017[45]), while the exact definition can vary, it is important that the criteria of public interest are announced well in advance by the government so that social partners can take them into account during the negotiation. Hijzen et al. (2019[58]) report that in the Netherlands, political actors frequently call upon public interest concerns to limit extensions, but do not use it so much in practice, being reluctant to interfere in the bargaining process.26 In Norway, extensions are granted if it is proven that foreign workers work or could work under employment conditions that are worse than those set by national agreements for the trade or industry in question or what is common for the place and occupation. In France, the 2017 labour market reform introduced the possibility to block otherwise semi-automatic extensions out of public interest considerations, notably the risk of negative effects on competition. Public interest criteria could help introducing some degree of qualitative evaluation in the decision of granting or not an extension, above and beyond strictly threshold representativeness criteria, but may be more difficult to action and be more subject to partisan considerations. So far they are not used to any major extent in any of the OECD countries.
While representativeness criteria (and, if used, public interest clauses) aim to reflect as much as possible the situation of a wide set of firms, they cannot account for their full diversity. Few countries, therefore, also allow for exemptions from extensions. In the Netherlands clearly pre-defined criteria for exemptions are even a condition for extension. Moreover, firms can request an ad hoc exemption from the ministry if they can justify dispensation.27 Hijzen et al. (2019[58]) report that, between 2007 and 2015, 191 requests of ad hoc exemptions were presented by Dutch firms, but only 58 were accepted. In Switzerland, although there are no formal rules for exemptions, in one case in 2012 firms with an annual turnover lower than 1.2 million Swiss francs (around EUR 1.2 million) were exempted (Visser, 2018[50]). Another option to better reflect the heterogeneity of firms and avoid the “one-size-fit-all” limit of extensions would be to encourage a differentiation within agreements as is done in the Dutch metal industry where, in practice, two agreements are signed, and extended, one for firms with 35 and more employees and one for firms with less than 35 employees. The French 2017 reform also conditioned the extension of a sectoral collective agreement to a differentiation of its content between large and small companies.28
Finally, existing statistics on collective bargaining coverage may underestimate the real extent of coverage, with or without extensions, due to “orientation”, e.g. the possibility for firms to follow the terms set by the collective agreement of their reference sector while not being formally bound to it or to formally “opt-in”, to reduce transaction costs and reduce the risks of conflicts. Opt-in is even sometimes suggested as a better alternative than allowing firms to “opt-out” from collective agreements. This option would hold if the main and sole rationale for issuing extensions would be a reduction of transaction costs; however several other reasons motivate in practice the use of extensions (such as levelling the playing field) and, therefore, opting-in cannot be considered a perfect functional equivalent. Moreover, even in countries where opt-in is relatively common, such as Germany, it does not appear to be a brake to declining coverage of collective agreements.
Based on establishment data,29 Addison et al. (2016[44]) show that half of the German establishments which are not covered by a sectoral agreement still orient themselves to it. This partly cushions the effects of a declining coverage of sectoral agreements: between 2000 and 2013, while coverage decreased by 10.7 percentage points, from 60% to 49.3% of establishments, orientation increased by 4.1 percentage points, from 16% of establishments to 20.1%. Orientation, however, is a weak policy tool as firms can withdraw from the terms set in the agreement at any time or just pick-and-choose the elements of the agreement they like (a formal opt-in is a stronger tool as firms cannot withdraw easily, but as a consequence it is also potentially less appealing for firms). Addison et al. (2016[44]) find that wages in establishments not covered by sectoral agreements are indeed lower than those in covered firms. Orienting establishments pay better than non-orienting (and therefore fully uncovered) ones, but still not as much as covered establishments. Hence, orientation (or opt-in) fills some of the gaps left by a decreasing coverage but far from completely.
2.4.3. Duration, ultra-activity and retroactivity
The length of collective agreements, their validity beyond termination date (the so-called “ultra-activity”) or before their entry into force in case of delays (the so-called “retroactivity”) also influence bargaining coverage as noted earlier. In some OECD countries, collective agreements do not expire until they get replaced by new ones. This ensures the continuity of the system and prevents voids when collective agreements expire. In countries where the law leaves large, or total, room to collective bargaining (for instance in countries with no statutory minimum wage), expiration without any replacement or ultra-activity effects would leave workers totally uncovered. Clearly, a long, and even indefinite, duration of agreements strengthens workers’ bargaining power by keeping them covered, even when employers are unwilling to negotiate new terms, and is ultimately contributing to increase stability and social peace. On the other hand, indefinite, or long, duration of agreements can make it more difficult for employers to renegotiate the terms of the agreement in times of crisis or deflation with potentially a negative effect on employment. Or they may lock workers in an outdated agreement (as pointed in the discussion on the estimation of the bargaining coverage in Portugal, Box 2.3), especially in times of higher inflation. Without co-ordinated and swift actions, indefinite duration of collective agreements may thus ultimately reduce the resilience of the labour market to unexpected shocks.
Table 2.3 shows where the maximum duration is specified in the law, fixed by social partners or not specified. Collective agreements of indefinite duration are typically negotiated in France, but they are also common in Belgium (and before the economic crisis of 2008, agreements had an indefinite duration or long ultra-activity in Greece and Spain as well). Countries which set a maximum duration by law, typically limit it to 36 months. Table 2.3 also shows that most OECD countries do not specify a maximum duration for the ultra-activity of an expired agreement, but leave it for negotiation between social partners. Among OECD countries, Luxembourg, New Zealand, the Slovak Republic, Slovenia and Spain (unless agreed otherwise) limit ultra-activity to 12 months. Limits to the duration of agreements beyond their termination date also exist in Greece. In addition, collective agreements can be terminated unilaterally by one of the signatory parties, in some countries such as Chile, Estonia, Poland or Switzerland. In most other countries, the union or the employer can ask for the termination of an agreement within a predefined notice period and the agreement has to be renegotiated while the terms of the former agreement remain valid. Across OECD countries, collective agreements are renewed on average every 12-24 months, or three years in Australia,30 Chile, and Sweden. Canada and Portugal are outstanding exceptions with an average duration exceeding 40 months (see detailed tables available online31).32
Finally, Table 2.3 also shows that collective agreements can be applied retrospectively, i.e. before their signature date, in order to ensure the continuation of rights and obligations in case of late renewal. Most OECD countries leave the decision on the payment of arrears to social partners. In some cases, retroactivity applies to all firms and workers, including those covered by administrative extensions (or their functional equivalent). For instance, this happens, to different extents, in Belgium, Italy and Spain. Including in the retroactivity of the agreement also firms subject to the extensions contributes to levelling the playing field (and this is consistent with the spirit of sectoral bargaining and the logic behind extensions as argued by Hijzen, Martins and Parlevliet (2019[58]). Retroactivity is unlikely to have a significant economic effect in normal times as far as extensions can be anticipated. However, it may become a major burden for firms in case of liquidity constraints, by constraining them to pay sizeable arrears in a relatively short period of time. Hijzen and Martins (2016[57]) suggest that the negative effects on employment of extensions in Portugal before the 2012 reform was probably driven by the burden posed by the payment of arrears by cash-strapped firms.
copy the linklink copied!2.5. Unpacking the complex machinery of collective bargaining
2.5.1. Centralised and decentralised bargaining systems
Levels of bargaining and favourability principle
The predominant level of bargaining as a proxy of the degree of centralisation occupied most of the attention of early studies on collective bargaining and macroeconomic performance. According to the corporatist view which dominated in the 1980s, performance would increase with centralisation, as centralised regimes would be able to internalise the potentially adverse effects of wage increases on unemployment and competitiveness (Cameron, 1984[59]). The centralisation argument was however challenged by the “hump-shape” or “U-shape” thesis of Calmfors and Driffill (1988[1]), which was very influential in the 1990s and early 2000s and argued that both centralisation and decentralisation could actually perform well in providing either aggregate flexibility or micro flexibility, since decentralisation would allow wages to adjust to productivity across firms. In any cases, sectoral bargaining was found to deliver the worst outcomes. Empirical studies have not provided much backing for this simplistic view, and showed that even seemingly similar bargaining structures work differently while the degree of co-ordination seems a more important variable in explaining different labour market outcomes across countries (OECD, 2004[60]; OECD, 2012[61]). This suggests that a comprehensive discussion of centralised versus decentralised systems needs to go beyond the bargaining level as the sole variable of interest, and instead address the full complexity of bargaining structures.
Since the late 1980s, several reforms promoted the decentralisation of collective bargaining in many OECD countries, i.e. gave more space to negotiations at the level of the company, the establishment or the workplace. Decentralisation typically occurred in two ways: either directly through a replacement of national/sectoral agreements by enterprise agreements, or through a process of articulation/devolution within the national/sectoral agreements (Visser, 2016[47]) allowing firm-level agreements to negotiate wage and working conditions within a general framework negotiated at higher level. Traxler (1995[62]) first coined these configurations as respectively “disorganised decentralisation” and “organised decentralisation”.
Organised decentralisation (or controlled form of decentralised collective bargaining) takes two main forms in European countries (Ibsen and Keune, 2018[63]). In a first case, national or sectoral agreements define the broad framework but leave large scope for bargaining at the firm/establishment level (notably in Scandinavian countries or the Netherlands): sectors can either set minimum or standard terms of employment which employers can complement or deviate from at firm level; or allow workers and employers to choose “à la carte” and trade-off, if they want, wages against working conditions. A second form of organised decentralisation is the one where national or sector agreements allow and define the conditions for deviations at lower levels via the so-called opening or opt-out clauses (Germany is probably the most notable example). However in other countries, formal regulatory changes in the bargaining structure have not resulted in a real shift of power33 to the firm level but rather in two-tier bargaining structures (Boeri, 2014[64]): in this case higher-level agreements still dominate, leaving to firm-level bargaining only the possibility to improve the standards set in national or sectoral level (“in melius”) agreements, firm-level agreements being subject to the “favourability principle” which states that a lower-level agreement can only take precedence over a higher-level agreement if it improves the terms of employment for workers.
Figure 2.13 provides a first suggestive overview of bargaining levels across OECD countries. Sector or industry level bargaining continues to dominate in most continental Western European countries, while in Canada, Chile, Ireland, Japan, Korea, Mexico, Turkey, New Zealand, the United Kingdom, the United States, most Central and Eastern European countries, as well as the three OECD accession countries, bargaining predominantly takes place at firm or enterprise level. In Belgium, Finland (until 2015) and Norway, national unions and employer organisations engage predominantly in cross-sectoral bargaining at central level but, even if not always well reflected in the data, also at sectoral and company level. Finally, Israel, Luxembourg and the Slovak Republic are mixed cases with an almost equal combination of sectoral and firm-level negotiations.34
While the predominant level of bargaining allows for a rapid characterisation of collective bargaining systems across OECD countries, it also risks conveying an overly simplistic picture. Figure 2.13 clearly shows that countries with the same predominant level of bargaining differ substantially in terms of their actual structure: even in countries where sectoral bargaining is the predominant level, firm level bargaining can have a very significant role and vice versa.

Note: Countries are ordered by ascending order of the proportion of employees covered by agreement taking place at the company level and company and higher level for each predominant level of collective bargaining. Collective agreements are only at company level in Chile, Colombia, Costa Rica, Japan, Korea, Mexico and the United States.
← 1. Statistics based on the Structure of Earnings Survey (Norway and Switzerland) refer to the type of pay agreement covering at least 50% of the employees. This could be explained why data reported for Norway do not reflect the two-tiered bargaining system based on a hierarchical system (i.e. basic agreement covering several industries/sectors sector agreement and company level agreement). Statistics based on the third European Company Survey (all other European countries) refer to employees in firms with at least ten employees.
← 2. Data for Australia include employees of the public sector and relates to the federal enterprise agreement system only.
← 3. 2014 for Norway and Switzerland; June 2014 for Chile; 2015 for Australia; and 2015-16 for New Zealand.
4. Greece, Spain and Portugal undertook deep reforms of their collective bargaining systems around the year of observation of the data (see Box 2.4). The figures may therefore reflect a mix of the legacy of the previous system and the early effects of the new one.
5. Ten percent of private sector collective agreements in 2016 were multi-employer collective agreements. While such agreements are not sectoral or industry collectives, they do represent agreements that are with more than one company.
Source: OECD calculations based on the third Eurofound European Company Survey (ECS 2013) for all European countries except Norway and Switzerland, the Structure of Earnings Survey 2014 (SES 2014) for Norway and Switzerland, the Workplace Agreements Database for Australia, administrative data from the Labour Department of the Ministry of Labour for Chile and Bargaining Trends & Employment Law Update 2015/2016 for New Zealand and OECD questionnaires for Colombia, Costa Rica, Japan, Korea, Mexico and the United States.
A critical element which defines the hierarchy between bargaining levels and the difference among systems is the existence of the so-called “favourability principle” which states that lower-level agreements can only improve the standards set in higher level agreements.35 In most continental European countries (e.g. Austria, Belgium, Germany, Italy, etc.), the favourability principle has traditionally applied and in practice continues to be the rule (Table 2.4 and detailed tables available online36).37 In the Scandinavian countries, Hungary, Korea, Latvia and the Netherlands, it is left to the negotiating parties which are then free to set lower standards if necessary. The 2012 reform in Spain, and to a lesser extent with a series of reforms starting in the 1980s in France, particularly in 2004 and 2008, the favourability principle has been inverted, i.e. giving precedence to firm-level agreements (in France, this is limited to specific topics as working time). In Greece, the favourability principle was abolished in 2012 following the adjustment programme that reversed the hierarchy of agreements (since, it has been reintroduced in September 2018). In all other countries with single-level bargaining, it does not apply (e.g. Australia,38 Canada,39 Chile, Colombia, Costa Rica, Japan and the United States).
Derogations and opt-out clauses
A second key element which can differentiate countries with the same predominant level of agreement is the use of deviations practices. Controlled forms of derogations have been one of the main factors in the shift of collective bargaining away from centralisation towards an “organised decentralisation” in some European countries over the last two decades. Temporary opening clauses have become rather popular during the crisis (Eurofound, 2015[65]; Visser, 2016[47]), following the German practice which allowed firms, together with other tools such as short-time working schemes, to better adapt to the deep crisis of 2008-09 (Dustmann et al., 2014[66]).
As shown in Table 2.5, in most European countries agreements at firm level can deviate from the terms set in the collective agreements. In a third of OECD countries, agreements can also deviate from the standards set in law, most often to make variations to working-time arrangements (when comparing countries, however, one should consider that in some countries there is hardly any law from which to deviate, for instance where most of labour regulations are fixed by collective agreements, while in other countries the labour code is very detailed). Deviations from higher-level agreements can be distinguished in general opening clauses40 and temporary opt-out clauses (also called hardship clauses, or inability-to-pay clauses). General opening clauses allow firm-level agreements to deviate from the minima or the standards set in higher-level agreements (for instance to decrease collectively-agreed wage floors, increase working time or change work organisation). Temporary opt-out clauses allow the suspension (or renegotiation) of the terms of agreements (even firm-level agreements) in cases of economic difficulties. In most countries general opening clauses and temporary opt-out clauses are subject to the rules and procedures specified in higher-level agreements by social partners themselves and to an agreement at firm level. Finally, in some cases (e.g. Spain) derogations can be obtained without union involvement if no agreement is reached with worker representatives by referring the matter to an external tripartite body.
The use and relevance of permanent or temporary derogations from higher-level agreements is closely linked to the presence of a clear and strict hierarchy between levels of negotiations (as noted in the discussion on the favourability principle) and the use of administrative extensions. Indeed, in countries where there is no favourability principle (or is up to negotiators) and no administrative extensions, such as in Northern European countries, there is no need of derogations since unions and firms are free to negotiate agreements that set lower standards than the sectoral agreement. In Denmark, for instance, nothing limits the possibility of temporarily lowering standards.
Opening clauses are among the main adjustment tools of collective bargaining systems where the hierarchy of agreements is subject to the favourability principle and extensions are used. Indeed, opening clauses – and particularly, temporary hardship clauses – are often referred to as “safety valve” (Visser, 2016[47]) to avoid the “one-size-fit-all” sectoral agreements, notably to adapt to local or specific permanent conditions, or to respond swiftly to an unexpected shock and keep high the support for wide-reaching collective bargaining systems.41 However, if not regulated, they can result in a downward competition between firms and even undermine the regulatory capacity of collective agreements. Moreover, if derogations and opt-outs are used only, or mainly, by large firms which have the resources to conclude firm-level agreements and/or to process the paperwork required to request the opt-out and which are often also the most productive, they risk losing their role of “safety valve”. Small firms, which may be those most in need of some derogations from the terms set by collective agreements they have not negotiated, most often are not able to make use of derogations and opt-out clauses because they lack the capacity and/or worker representation. In a possibly extreme, but not totally unlikely scenario, large firms may even use opt-outs as an anti-competitive tool by negotiating first relatively generous conditions in sectoral agreements and then opt-out to improve the terms in their favour, leaving competitors bear the brunt of the generous terms they have negotiated.
Opening clauses in higher level agreements were introduced in Germany as a temporary solution,42 limited first to working time, then from 1995 extended to wages (Brändle, Heinbach and Maier, 2011[67]). Initially only unions could agree to revise the terms of the agreement, but quickly collective agreements also allowed “Pacts for employment and competitiveness” (PECs) with the works councils (with or without formal involvement of a union). These have become increasingly widespread and began being used independently of the specific economic situation (Seifert and Massa-Wirth, 2005[68]). Kohaut and Schnabel (2006[69]), based on data from the IAB Establishment Panel, also report that, in 2005, 13% of establishments and 29% of employees in Germany were covered by a collective agreement with scope for an opening clause. Around half of the involved/concerned establishments (53% in the West, 50% in the East) had made use of such a clause, mostly to modify working-time arrangements, and only one third to change basic pay or annual bonuses. Data from the WSI Works Council Survey (Schulten and Bispinck, 2014[70]) and from the IAB Establishment Panel (Addison, 2016[71]) do not show yet any particular trend over the last ten years, except an uptake during the crisis.
As mentioned before, the 2012 Spanish labour market reform made it easier for firms to opt-out from higher-level agreements and extended the possibility for employers to unilaterally modify wages, working hours and work schedules referring the matter, if disagreement persists, to arbitration by a public tripartite body. In the years until 2015, estimates of the Spanish Labour Ministry show that less than 5% of firms, mainly large ones, have opted-out. Data collected by the Wage Dynamics Network Survey and reported by Izquierdo and Jimeno (2015[72]) show that in 2013, 3.7% of firms opted-out from a sectoral agreement and 1.9% from their own firm-level agreement. Opt-outs were mainly used by large firms opting out from a sectoral agreement (5.9% of firms with more than 200 employees) and even more from their own firm-level agreement (16.6% of firms with more than 200 employees). As SMEs constitute the bulk of the Spanish economy, the use of opt-outs in Spain remains therefore limited. Moreover, since the Spanish reform also facilitated internal flexibility, firms have other adjustment options beyond opting-out from collective agreements. The German experience, moreover, shows that it takes time before firms learn how to make full use of these instruments.
Spain, Portugal, Greece and France passed encompassing labour market reforms during or following the crisis that also changed the way collective bargaining works. All reforms were aimed at strengthening firm-level bargaining and giving more flexibility to employers in case of economic shocks but were, in some cases, partly reverted in the recent years.
In Greece – see ILO (2014[73]) and OECD (2018[74]) for more details – the collective bargaining was completely overhauled during the crisis. The favourability principle was suspended giving priority to firm-level agreements. Moreover, new provisions allowed “associations of persons” (i.e. association of workers, not necessarily affiliated to a union) to sign firm-level agreements on top of trade unions. Extensions of collective agreements to non-signatory firms were also suspended and limits to the duration and the ultra-activity of collective agreements were introduced. Finally, the system of unilateral recourse to arbitration was abolished. Since Greece exited the European Stability Mechanism stability support programme (i.e. the financial support programme set up during the crisis) in September 2018, the favourability principle and the possibility of extending sectoral collective agreements signed by representative parties have been re-introduced. Since September 2018, 12 sectoral or local collective agreements have been extended, covering in total more than 200 000 workers (European Commission, 2019[75]). The unilateral recourse to arbitration has also been re-instated by a Council of State ruling in 2014 but some incentives for a consensual solution have been introduced. The new Greek Government elected in June 2019 has expressed the intention to again limit unilateral appeals to arbitration and the use of extensions as well as to introduce opt-out mechanisms from sectoral agreements.
In Spain – see OECD (2014[76]) for more details and a preliminary review – the 2012 reform inverted the favourability principle giving priority to firm-level agreements over those at sectoral or regional level. The reform also made it easier for firms to opt-out from higher-level agreements or firm-level agreements either upon an agreement with worker representatives or by unilaterally referring the matter to arbitration by a public tripartite body. For the time being, Spanish firms do not appear to have made a significant use of these new provisions.
In Portugal – see OECD (2017[45]) for more details and a preliminary review – successive reforms between 2011 and 2015 initially froze extensions of collective agreements and then granted them only if the signing employer organisations met certain criteria. The duration and ultra-activity of collective agreements was reduced. Works councils in firms with at least 150 employees (down from 500) were allowed to negotiate firm-level agreements upon a mandate from unions and a possibility was introduced for employers to temporarily suspend a collective agreement in case of crisis. Since 2015, these reforms have been partly reversed: in 2017 a tripartite pact removed the representativeness criteria for extensions and set a limit of 35 days for their issuance to avoid the usual and long pre-reform delays. Limits to ultra-activity were suspended for 18 months between 2017 and 2018 to create stability for negotiating a tripartite agreement to amend the Labour Code. Sectoral bargaining has now resumed. By contrast, despite the new provisions that are still valid, there has been a very limited take-up on the possibility to negotiate at company level.
In France – see Carcillo et al. (2019[77]) for more details and a preliminary review – two main reforms took place in the recent years. In 2016, the Labour Law (Loi El Khomri) strengthened the role of firm-level agreements in defining working time, leave and rest period. It also increased the threshold to define which trade unions are representative and allowed to sign firm-level agreements and introduced the possibility of approving the agreements via an internal referendum. Opt-out clauses in case of economic difficulties, with the objective of safeguarding employment have also been introduced (but not on wages). In 2018 the Law ratifying the September 2017 Ordonnances went further to promote firm-level bargaining by allowing negotiations even in the absence of a union in firms with less than 50 employees. Moreover, in companies with less than 20 employees the employer can submit a proposal of agreement directly to an internal referendum. The reform also sought to make extensions of sectoral agreements less automatic by conditioning them to the presence of different provisions by firm size and by introducing the possibility to block them out of public interest considerations (in particular, if an agreement is used as an anticompetitive tool against non-signatory companies) based on the evaluation of an ad hoc experts group. Two years after the Ordonnances, however, no request of extension has been refused and no agreement has included different provisions for large and small firms. The Ordonnances reform also merged and streamlined different firm-level workers’ representation bodies into a single one with the goal to simplify dialogue at firm level.
2.5.2. Co-ordination, enforceability and the quality of labour relations
Co-ordination
Co-ordination is the other key pillar of collective bargaining systems. Co-ordination refers to the “degree to which minor players deliberately follow what major players decide” (Kenworthy, 2001[78]; Visser, 2016[47]). Co-ordination can happen between bargaining units at different levels (for instance when sectoral or firm-level agreements follow the guidelines fixed by peak-level organisations or by a social pact) or between units at the same level (for instance when some sectors or companies follow the standards set in another sector/company).
Many studies have found in different co-ordination practices a main factor behind wage developments and macro flexibility, namely the ability of the economy to adjust to macroeconomic shocks (Soskice, 1990[79]; Nickell, 1997[80]; OECD, 1997[81]; OECD, 2004[60]; OECD, 2012[61]; Blanchard and Wolfers, 2000[82]). While conceptually different, co-ordination and centralisation can be thought of as two different ways to reach the same objective, and strong co-ordination has been found to be a functional equivalent of centralisation in some cases (Soskice, 1990[79]; Traxler, 1995[62]; Teulings and Hartog, 2009[83]). However, co-ordination can also ensure that either organised, but also disorganised decentralisation does not result in totally independent and atomised negotiations and allow for a certain degree of synchronisation of different bargaining units when setting their strategy and targets. Co-ordination can play a particularly important role at the macroeconomic level as a critical tool to strengthen the resilience of labour markets by increasing the responsiveness of real wages to changes in macroeconomic conditions (OECD, 2012[84]; IMF, 2016[85]; OECD, 2017[86]). But co-ordination can be a key instrument in pushing up wages when needed. Co-ordination is also important to ensure that the competitiveness of the export sector in a country is not endangered by what is negotiated in the non-tradable sector which does not suffer from international competition but is often a critical input for the tradable sector.
Wage co-ordination takes different forms across OECD countries. Table 2.6 presents the degree and mode of co-ordination among OECD countries. It follows Kenworthy (2001[78]) and Visser (2016[47]) by distinguishing between the mode of co-ordination (state-imposed, pattern bargaining, etc.) and the degree of co-ordination (whether pervasive and binding or not). Co-ordination is strongest when it is based on strict statutory controls (this is called state-imposed co-ordination, and it occurs via indexation rules, binding minimum wages and/or rules for maximum uprates). Currently only Belgium falls in this category: wages are indexed to increases in living costs but capped by a “wage norm” which takes into account (weighted) wage developments in France, Germany and the Netherlands on top of a statutory minimum wage negotiated between social partners. Until 2015, Finland was the country closest to Belgium since central agreements played an important role in guiding what lower-level agreements could negotiate (state-induced co-ordination). In France, the relatively high minimum wage also severely restricts the room of manoeuvre of social partners and renders many wage floors irrelevant (Fougère, Gautier and Roux, 2018[87]). In Nordic countries, as well as in Austria, Germany and the Netherlands co-ordination takes the form of the so-called pattern bargaining where a sector sets the targets first (usually the manufacturing sector exposed to international trade) and others (or at least some of them) follow. Pattern bargaining also takes place in Japan where collective agreements are negotiated only at company level (see Box 2.5 for more details). Finally, co-ordination can also take the form of inter- or intra-associational guidelines where peak level organisations either set some norms or define an intra-associational objective that should be followed when bargaining at lower levels. This takes place more or less formally in several countries but it is usually binding only in countries where peak level trade unions or employer organisations are relatively strong and centralised (typically Nordic countries and to a significantly lower extent France and Italy). In most Central and Eastern European countries, OECD accession countries and other decentralised systems, bargaining systems are uncoordinated.
Collective bargaining in Japan is highly decentralised: most of the bargaining takes place at the company level without national or sectoral agreements. Yet, a co-ordination mechanism for wage bargaining is launched every spring by the peak unions to supplement the limitations of bargaining power of firm-levels unions. This co-ordination system, called Shunto (the trade unions’ nation-wide Spring Offensive), is entirely left to the social partners.
Introduced in 1955 by one of the major national trade unions in a context of weak, fragmented and highly politicised unions, over time Shunto became the quintessential example of integration and synchronisation in wage bargaining in combining pragmatism, flexibility and efficiency. Annual negotiations for wage increases on a national scale are given a precise framework through separate internal co-ordination by both unions and employer organisation (Togaki, 1986[88]; Shirai, 1987[89]). The co-ordination mechanism takes place both within and across sectors. Typically, the negotiations with large companies start in winter, when Rengo, the national Japanese trade union confederation, sets the intra-associational guidelines with wage increase target to be further specified by each sectoral level trade union federations. Taking this minimum wage increase as a benchmark, firm-level unions negotiate over wages, bonuses and working conditions. Parallel efforts to co-ordinate the bargaining policy of employers are also made by employer organisations and the major enterprises, ensuring a large convergence with unions’ requests.
The importance of information sharing for a co-operative relationship between unions and employers and efficient negotiation process was pointed out by Morishima (1991[90]) as a critical ingredient of success of the Shunto system over time. For instance, following the 1973 oil crisis, the national trade union centre changed strategy drastically after heated management-labour discussions, and decided to self-restrain wage increases to prevent causing hyperinflation. A similar pragmatism was observed in 2001, after the ICT bubble crisis in Japan, as national-level social partners jointly declared that unions would restrain their requests to allow employers to preserve jobs. More recently, unions compromised on the wage increases with employers in exchange for employment protections (2% wage increases in 2016). Some observers have argued however that this wage moderation policy may have led to a weakening of unions’ bargaining power during the Lost Decades. Moreover, Kato (2016[91]) suggests that in recent decades wages started to fall behind productivity growth and Shunto has become less relevant, losing in part its efficacy in synchronising wage negotiations.
Source: This box was prepared in collaboration with Yoshie Shigiya.
Enforcement of collective agreements and the quality of labour relations
The ability of the employer organisations and trade unions to control the behaviour of their constituency at lower levels is key for ensuring that decisions taken at higher levels are actually reflected at lower levels and effectively implemented. Co-ordination and centralisation without compliance and enforcement are simply ineffective (Nickell and Layard, 1999[92]; Traxler, 2003[93]). The evidence discussed in Box 2.6 shows that, for countries where estimates are available, even compliance to the lowest levels of the negotiated wage floors is far from perfect.
Primarily a legal issue, the actual level of enforcement of the standards set by collective agreements is critical to judge the effectiveness of the bargaining systems, notably in terms of fairness for workers and level-playing field for firms. However, available empirical evidence on compliance to labour market regulations is quite scarce and almost inexistent for collective bargaining. In fact, measuring the extent of non-compliance is very difficult to do in a practical way, given data limitations and measurement error. Garnero, Kampelmann and Rycx (2015[94]) provide a first estimate of non-compliance to wage floors fixed by collective agreements in seven European countries. They find that on average in 2007-09, the share of workers paid less than the negotiated wage floors was 13% in Italy, 8% in Germany, 4% in Austria and Belgium, and around 2% in Finland and Denmark.
More recent estimates on the incidence and depth of non-compliance to minimum wages fixed by collective agreements in Italy between 2008 and 2015 using a range of survey and administrative data are provided by Garnero (2018[95]). He finds that non-compliance is indeed non-negligible: on average, using Labour Force Survey data, around 10% of workers in the country are paid one fifth less than the reference hourly wage floor (7% using data declared by employers themselves in the Structure of Earnings Survey which however excludes micro firms and the agriculture sector; and 2.7% using social security data which however are unlikely to report non-compliance as they are based on official company records and limited to monthly wages, therefore not considering extra unpaid time, and to full-time full-month employees only). Not surprisingly, all data sources show that non-compliance is particularly high in the south of Italy and in micro and small firms and it affects especially women and temporary workers. Moreover, all data sources show that wages in the bottom of the distribution in Italy appear to be largely unaffected by wage floor increases. The exact estimates vary according to the data used but all show that non-compliance significant and pervasive.
In addition to more effective labour inspections, Garnero (2018[95]) suggests a series of relatively cost-free tools for improving compliance to negotiated wage floors, and to the terms of collective agreements more in general. In countries where the number of collective agreements is very high, a smaller number of collective agreements and minimum wages would make the system more transparent for both employers and workers. Where it is not the case, ensuring that agreements are signed by representative unions and employer organisations is key to avoid that complacent, poorly representative social partners or “yellow” unions (unions dominated or heavily influenced by an employer) undermine existing standards.
Making the text of collective agreements and a summary of its main elements publicly and easily available is an essential precondition to ensure that workers and employers are well informed about their rights and duties. In most countries it is difficult to get access to the text of collective agreements. Finally, awareness and “name and shame” campaigns have been proven quite effective in increasing compliance with the statutory minimum wage in Costa Rica (Gindling, Mossaad and Trejos, 2015[96]) and the United Kingdom (Benassi, 2011[97]) and could be used as a relatively cost-effective tool also in the case of collective agreements.
There are no comparable indicators on the level of enforcement across countries. However, the capacity of enforcement of each system – sometimes also referred to as “governability” – see Traxler (2003[93]); and OECD (2004[60])43 – is likely to be related to the functioning of collective bargaining, historical developments and overall trust among social partners (Table 2.7). The “enforceability” of agreements can also be fostered by regulating industrial actions with “peace clauses” ruling that unions which have signed an agreement, and their members, cannot lawfully strike on issues regulated in the agreement). In some countries peace clauses are not or rarely used (for instance, Belgium and France, Mexico, Chile) on the grounds that a peace obligation would interfere with the right to strike. In other countries (e.g. Italy and Spain), peace clauses are common but given that the strike is an individual right, workers can always strike as the agreement is binding only for the collective signatory parties. Therefore, even a small group of workers is enough to limit the enforcement of the agreement undermining the governability of the system. In other countries (typically the Nordic countries) peace clauses are used and enforced thanks to the strong role of unions and relatively high level of trust between and in social partners.
Mediation and arbitration procedures can also play a significant role in smoothing conflicts and helping finding an agreement within the framework of collective bargaining and therefore contribute to strengthen the overall governability of the system. Mediation and arbitration procedures in sectoral and firm-level agreements are present in about half of OECD countries and in around two-thirds of the cases a mediation procedure is compulsory. In other countries, for instance in Norway, mediation mechanisms exist outside the agreements. The Norwegian National Mediator mediates in conflicts of interests between employer and employee organisations, i.e. when the negotiations on renewal or establishment of an agreement have broken down. The purpose of mediation is to avoid work conflict which, in fact, cannot legally be started before mediation has been tried. The Labour Court of Norway is a special court for resolving labour disputes concerning the interpretation, validity and existence of collective agreements, cases of breach of collective agreements and the peace obligation and cases of claims for damages arising from such breaches and unlawful industrial action.
Figure 2.14 shows the trends in industrial disputes (strikes and lock-outs) across OECD countries. Data should be interpreted however with caution as the number of strikes is likely to be affected by how they are regulated at national level and may thus not reflect the actual level of strife in the workplace. Furthermore, existing statistics are plagued by considerable differences in definitions and measurement which severely limit the comparability of the data (see note under Figure 2.14 and, for further details, see detailed tables available online44). Notwithstanding these caveats, Figure 2.14 shows that industrial disputes as well as the degree of variation across countries have gone down considerably since the 1990s (a notable exception is Belgium where days lost because of strikes have steadily increased since the 1990s).

Note: International comparability of data on strikes is affected by differences in definitions and measurement. Many countries exclude from their official records small work stoppages, and use different thresholds relating to the number of workers involved and/or the number of days lost. Strikes statistics in some countries may also exclude stoppages in particular industries, such as the public sector (as in Austria, Belgium, France, Germany, Latvia, Portugal and Turkey) or of a particular type, such as political and unauthorised strikes (as in Chile, Costa Rica, Estonia, Hungary, Israel, Korea, Latvia, Lithuania, Mexico, Turkey, the United Kingdom and the United States). Conversely, some countries may include workers indirectly involved (i.e. those who are unable to work because others at their workplace are on strike) as in Costa Rica, Denmark, Estonia, Finland, France, Hungary, Ireland, Lithuania, the Netherlands, New Zealand, Poland, the Slovak Republic, Switzerland, Turkey, the United Kingdom and the United States or work stoppages caused by the shortage of materials supplied by firms involved in strike. In general, forms of industrial action that do not involve full-work stoppages, such as “go-slows”, silent and other protests in the workplace are not included. For further details, see online annex at http://www.oecd.org/employment/collective-bargaining.htm.
2008-18 refers to 2008 only for Italy (this indicator is no longer available for this country), 2012 only for Slovenia, 2008-15 for Turkey, 2008-17 for Chile, Costa Rica, France, New Zealand, Portugal and the Slovak Republic.
1. The statistics concern strikes at establishments and enterprises covered by federal jurisdiction. As a result, strikes at enterprises under local jurisdiction are not included.
2. The ratio reached 581 and 697 work days lost per 1 000 salaried employees in the 1990's and in 2000-07, respectively.
3. Average in 2008-18 is mainly driven by a strike in 2014 taking place in the Ministry of Education and involving 75 000 workers during 29 days. The annual average set at 34 days lost per 1 000 employees otherwise.
4. The following branches of economic activity or sectors are excluded: life or property saving, funeral and mortuary, production, refining and distribution of city water, electricity, natural gas and petroleum as well as petrochemical works, production of which starts from naphtha or natural gas; banking services; in workplaces operated directly by the Ministry of National Defence, General Command of Gendarmerie and Coast Guard Command, firefighting and urban public transportation services carried out by public institutions and in hospitals.
5. Due to a major break in series, data prior to 2005 are not reported in this Chart.
Source: ILOSTAT and national statistical offices for working days not worked and OECD Annual Labour Force Statistics Database and national statistical offices for total number of employees.
Since Blanchard and Philippon (2004[98]) tried to establish a link between conflictual labour relations and high unemployment, there has been an increasing focus on the quality of labour relations and trust among social partners. Blanchard et al. (2004[98]) argued that “trust appears to be just as important in bringing macro flexibility as the structure of collective bargaining” as the effectiveness of co-ordination, in particular, is likely to be closely linked to relatively peaceful and co-operative industrial relations. IMF (2016[85]) shows that unemployment rose less following the global financial crisis in those countries where trust was high.
Panel A in Figure 2.15 2.15 shows the degree of co-operation in labour relations as assessed by senior business executives in a survey published by the World Economic Forum. Among OECD countries, managers consider labour relations most co-operative in Switzerland and least co-operative in Korea. The degree of perceived co-operation appears to have been largely unaffected by the crisis: if anything, labour relations have slightly deteriorated in countries where they were already relatively poorer.
The trust that citizens have in unions also varies considerably across countries (data on trust in employer organisations are not available) and is correlated with the national level of trust in institutions more generally. In 2010 on average, 40% of respondents across OECD countries declare that they trust trade unions, but the share of people trusting unions varies from 65% in Finland and Denmark to 25% in the United States, Slovenia and Mexico. Between 2000 and 2010 trust in unions has increased markedly in Central and Eastern European countries where it was initially very low while it has decreased quite significantly in countries that have been deeply hit by the crisis, Greece, Ireland and Spain.
The quality of labour relations as assessed by senior executives and the degree of trust in trade unions by the general population are positively, yet not perfectly, correlated. In some countries, such as France, executives report a low quality of labour relations, but trust in unions is higher than average (a similar gap is found also in Korea, ranked among the lowest by executives and close to the OECD average by people). The opposite case is found in the United States, where executives consider labour relations well above the OECD average, while only 25% people declare that they trust unions.
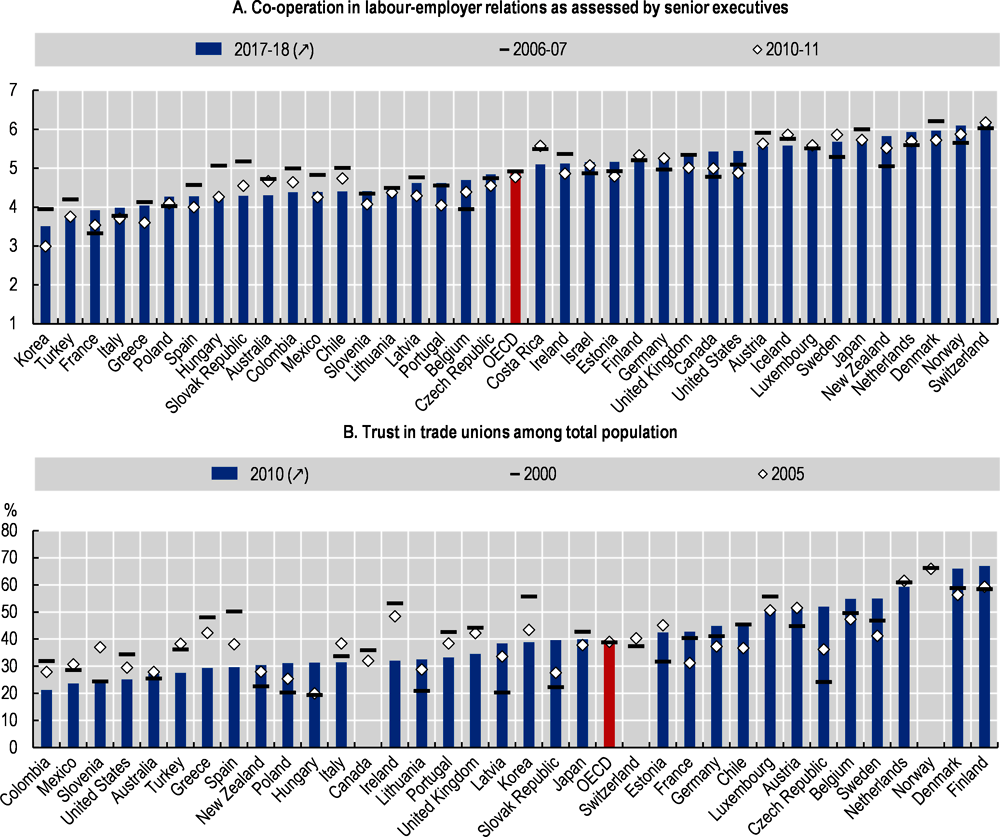
Note: Statistics shown in Panel A refer to the average weighted national score based on a scale from one (“generally confrontational”) to seven (“generally co-operative”) to the following question: “In your country, how would you characterise labour-employer relations?” In Panel B, the statistics refer to the share of persons tending to trust trade unions for the European countries (not including Norway and Switzerland) and the share of persons who are greatly or quit a lot confident in trade unions for all other countries (including Norway and Switzerland). OECD is the unweighted average of OECD countries shown (not including Canada, Colombia, Iceland, Israel, Norway and Switzerland in Panel B).
Source: Panel A: The Global Competitiveness Index Historical Dataset © 2005-2014 and © 2007-2017 World Economic Forum. Panel B: Eurobarometer for all European countries (not including Norway and Switzerland) and World Value Survey (http://www.worldvaluessurvey.org/WVSOnline.jsp) for all other countries (including Norway and Switzerland).
The quality of labour relations and trust in unions, in line with the findings by Blanchard and Philippon (2004[98]), are found to be negatively correlated with the unemployment rate and with earnings inequality: on average across OECD countries, higher trust goes hand in hand (but the direction of the causality is not clear) with lower unemployment and lower earnings inequality45 – see Annex Table 4.A1.1 in OECD (2017[7]).
The level of co-operation and trust is the result of decades of history and is deeply rooted into broader societal and cultural factors. The evidence on the issue is very limited-see Addison (2016[71]) for a summary, but some of the features of collective bargaining systems themselves can help promoting more co-operative relations. Fragmented and poorly representative social partners are likely to be less inclusive and increase the level of strife. Therefore promoting co-operation between social partners (or at least not incentivising excessive competition) could have a positive effect on the quality of labour relations. More in general co-operation in a range of areas, involvement in committees, reforms, and institutions at higher levels, together with employee involvement and co-operation at the firm level can help building trust and a common understanding of challenges, solutions, and positions. Moreover, objective criteria, in particular with respect to opt out and extension requests, the availability of accurate information on the representativeness of social partners and the presence of an independent body to mediate and settle disagreements, can also contribute to improve labour relations. Hijzen et al. (2019[58]) also suggest that incentives for regular renegotiation might enhance trust (unless they force the conclusion of an agreement when there is no shared willingness to reach it). Mechanisms that ensure the actual enforcement of the terms of collective agreements (see Box 2.6) are also likely to strengthen the accountability of social partners and therefore reciprocal trust. Finally, institutional stability usually helps social partners by creating shared and mutual expectations (Brandl and Ibsen, 2016[99]). Repeated piecemeal reforms are likely to increase adaptation costs and shorten the outlook over which social partners plan their negotiation strategies. Generally, ensuring the autonomy of social partners is likely to enhance trust between them.
copy the linklink copied!2.6. Workers’ voice at workplace and company level
Beyond collective bargaining, countries also vary when it comes to the presence and role of various forms of workers’ voice arrangements organising the collective expression of workers’ interests at workplace or company level. Voice is made of the various institutionalised forms of communication between workers and managers that offer an alternative to exit (i.e. dissatisfied employees quitting) in addressing collective problems. Voice provides employees with an opportunity to solve issues emerging in the workplace through communication with management (Willman, Gomez and Bryson, 2009[100]). The need for workers’ voice is described as inherent to working life (Gomez, Bryson and Willman, 2010[101]). Box 2.7 delves into the influence of various workers’ voice arrangements on the “voice vs. exit” behaviour of workers, comparing the cases of France and the United Kingdom.
Voice is often mediated through representative institutions (in this report referred to as “representative voice”), such as local trade union representatives (either appointed by the trade union or elected by the employees), works councils (established bodies elected or appointed by all employees in a firm, irrespective of their membership of a trade union),46 or workers representatives (either union members or independent). The prerogatives of the representative entities differ largely across OECD countries, ranging from information, to consultation and co-determination (De Spiegelaere et al., 2019[102]). This variation in the rights granted to structure of representative voice means that apparently similar institutions are likely to yield different results in different legal contexts.47
In most OECD countries, several representative institutions can cohabit in one workplace. This often depends on the firm’s size and related legal thresholds above which representation is mandatory. In several OECD countries bodies/councils dedicated to occupational health and safety issues are also present in the workplace. Until a 2017 reform, firms with more than 50 employees in France combined a works council (comité d’entreprise), union representatives (délégué syndical and/or représentant de la section syndicale), worker representatives (délégué du personnel) and a relatively powerful health and safety committee – see Askenazy and Breda (2019[103]) for more details. The 2017 reform (Ordonnances) merged these bodies in a single one, the Comité Social et Économique. Table 2.9 shows the diversity of situations across OECD countries. In Austria, Germany, Luxembourg, the Netherlands and Switzerland, works councils are the sole eligible employee representative structure; this does not however prevent unions from playing any role, as they often have reserved seats in the works councils. In Canada, the United States, Sweden or Turkey trade unions are the sole representative body.
Workers, when not satisfied with their working conditions, have essentially two main options: exit (i.e. quit their job); or, voice their concerns (Hirschman, 1972[104]). Freeman and Medoff (1984[105]) brought some evidence that unions, by giving employees the opportunity to express their concerns and improve their situation, contribute to reduce voluntary quits, ultimately reducing labour turnover – even if the process of reaching resolutions may be conflictual and disruptive. This may thus benefit not only workers, but also firms, as lower turnover and longer tenure can reduce hiring and training costs and increase productivity.
Amossé and Forth (2016[106]) have recently tested the “exit-voice” dichotomy using comparable establishment surveys for France (REPONSE) and Great Britain (WERS). They assess if Britain is an “exit” country and France a “voice” one, given their respective historical differences in the degree of regulation and influence of the unions (while trade union density is lower in France, union representatives at the workplace level are much more prevalent). They also test if the presence of a union representatives in the workplace or arrangements for direct voice reduce quits and contribute to an increase in collective disputes.
The results by Amossé and Forth (2016[106]) in Table 2.8 show that, as expected, voluntary quits are on average more frequent in Britain than in France. In both countries the presence of a union representative in the workplace is associated with a lower quit rate, as already found by Bryson and Forth (2010[107]) and Bryson et al. (2013[108]) for Britain. The effect is robust also when controlling for other factors.
This result suggests that unions or worker representatives on site reduce exit by offering stronger collective voice. On the contrary, direct voice arrangements (regular departmental meetings, employee attitude surveys, suggestion schemes) have no statistically significant association with the quit rate in France, while they are positively correlated with quits in Britain. Whilst Freeman and Medoff (1984[105]) suggested that voice may reduce exits, they also recognised that the articulation of voice (typically in the form of complaints) would be likely to lead to a degree of overt conflict in the workplace, whilst issues were being discussed and resolved.
The establishment data from WERS and REPONSE indicate that disputes in the workplace are much more common in France and that union presence is strongly and positively associated with a more frequent occurrence of collective disputes in both countries (this is also confirmed by managers’ subjective rating of the social climate in the workplace as reported in the establishment surveys). Overall thus, the recent analysis by Amossé and Forth (2016[106]) confirms that, at least in the case of France and Great Britain, the presence of a union representative effectively contributes to reduce turnover as suggested by Hirschman (1972[104]) and Freeman and Medoff (1984[105]), but also increases collective disputes.
Representative voice can also materialise at company level, through employees’ and/or trade unions’ presence in supervisory and management boards (Gold, 2011[109]; Kleinknecht, 2015[110]).48 Board-level employee representation is a form of workers’ voice that also tends to strengthen workers’ bargaining power and potentially enhance co-operative attitudes by allowing workers to engage in the strategic choices of the company (De Spiegelaere et al., 2019[102]).49 Employees’ right to be represented on the board depends on the nature of the company ownership, its size, and its legal status. Again, beyond the presence of workers’ representatives on the board, the latter are also granted varying degrees of rights and prerogatives, which is likely to influence their impact (Conchon, 2011[111]). Among OECD countries (for more details see detailed tables available online50), Austria, Denmark, Finland, France, Germany, Hungary, Luxembourg, Netherlands, Norway, Poland, the Slovak Republic, Slovenia, and Sweden have such provisions, allowing worker representatives to sit on the boards of private companies in firms above a certain size.51 In Chile, Greece, Ireland, Israel, Poland, Portugal and Spain worker representatives can sit on the boards of state-owned enterprises only. Supervisory boards are a particularly essential feature of workers’ voice in Germany, and an important arena where the quality of the working environment is influenced (Scholz and Vitols, 2019[112]) (see Chapter 4).
Figure 2.16 displays the share of employees covered by any form of worker representation as reported in the European Working Conditions Survey. The results show that on average, at least for European countries, the coverage of firm-level representation is not particularly higher in countries where firm-level bargaining dominates, although institutions of workers representation are indispensable pillars of collective bargaining in single-employer systems. Representation tends to be relatively high in multi-employer bargaining systems, with complementary effects between the two levels (notably in the Nordic countries, Germany or the Netherlands). On the other hand, the coverage of employees’ representation is low in countries where firm-level bargaining is very limited, like in Greece or Portugal even after the recent reforms.

Source: OECD calculations based on the 6th European Working Conditions Survey 2015 (EWCS 2015).
In practice, beyond representation, voice also materialises at the workplace through the organisation of direct exchanges between workers and managers (e.g. via regular town hall meetings and/or direct consultations, in this report referred to as “direct voice”).52 A key difference between direct and representative forms of voice is the legal protections and rights attached to the status of workers’ representatives, notably the protection against retaliation and firing, and information and consultation rights. Therefore, direct and representative forms of voice are not substitutes. However, this distinction is useful in capturing the different ways in which communication between workers and managers de facto materialises (or fails to) across OECD countries.53
Finally, in “mixed” systems of voice, both direct and representative arrangements for workers’ voice cohabit. According to data from the European Working Conditions Survey, these systems are the most common: in 2015, about 37% of European workers had access to both representative and direct voice arrangements, while 18% had access to voice arrangements of the “direct type”54 only and 14% had access to solely representative voice arrangements.
The proportion of workers who have access to mixed-voice arrangements is higher in well-coordinated bargaining systems; by contrast, the proportion of workers in firms with no workplace voice arrangements at all is highest in decentralised and weakly coordinated bargaining systems. Access to these different forms of workers’ voice arrangements also varies based on workers’ characteristics. According to the same data, while 46% of highly educated workers in Europe had access to mixed systems of voice in 2015, this was the case for only 26% of low-skilled workers. Moreover, 44% of low-skilled workers had access to no voice arrangements at all, compared with 19% of high-skilled workers. Data by type of contracts and firm size display significant differences as well, with 43% of workers on temporary contracts, against 27% of those on permanent contracts without access to any form of voice. 53% of workers in small firms (less than 10 employees) do not have access to any form of voice, while 40% of those in firms above 10 employees have access to both direct and representative forms of voice.55
While in a number of countries, voice historically developed in its representative version, with unions playing a prominent role, systems of direct voice have become more prominent in recent decades (Bryson and Green, 2015[113]). Willman, Gomez and Bryson show that the “collapse of union voice” in the United Kingdom coincided with the expansion of direct voice mechanisms often initiated by employers (Willman, Gomez and Bryson, 2009[100]). However, as explained above, these two mechanisms are not substitutes, since many of the legal guarantees accompanying workers’ representation are absent in direct voice arrangements. The rise of direct forms of voice in the United Kingdom has been associated with more collaborative relationships with managers and with more consultation, but also with less actual negotiation and with a weakening of representation itself, as workers’ representatives act more as managerial assistants than as independent and influential stakeholders (Charlwood and Forth, 2009[114]).
copy the linklink copied!2.7. How do national collective bargaining systems compare?
The previous sections have detailed the scope, building blocks and adjustment devices characteristic of national bargaining systems across OECD countries, in order to capture as much as possible their granularity, complexity and diversity. However, national collective bargaining systems should not be considered as just a sum of different elements but as a system with complex interactions between the different components. In this context it is useful to “zoom-out” so as to obtain an overarching view of each bargaining system.
Table 2.10 provides a summary of all the key features identified in Figure 2.1, a sort of dashboard of the different national collective bargaining systems. It clearly shows that collective bargaining coverage is high (above 50%) only in countries which have at least some forms of sectoral bargaining. In these countries high coverage either results from high employer organisation density or from a widespread use of administrative extensions. However, Table 2.10 emphasises that there is no single model of sectoral bargaining. Indeed, countries under this broad group differ greatly in terms of the degree of co-ordination and the room left to lower-level agreements to change the terms of employment. In particular:
-
In Belgium (and Finland until 2015 and in other countries in the 1980s and 1990s), a rather centralised and co-ordinated country, sectoral agreements play an important role, while leaving some room for lower-level agreements to change the standards set in higher-level agreements. The specific feature of this system is the strong form of state imposed (or induced) co-ordination.
-
In rather centralised and uncoordinated countries such as France, Iceland, Italy, Portugal and Slovenia, sectoral agreements play a strong role, extensions are used extensively and there is rather limited room for lower-level agreements to derogate from higher-level ones. Moreover, in these countries co-ordination tend to be generally weak.
-
Spain and Switzerland are in many respects similar to the previous group but in Spain the recent reform has made it somewhat easier for lower-level agreements to derogate from higher-level agreements (but derogations are only rarely used for the time being) while in Switzerland co-ordination still plays a non-minor role.
-
Austria, Denmark, Finland (after 2015), Germany, the Netherlands, Norway and Sweden have an organised decentralised and co-ordinated bargaining system: in these countries sectoral agreements, even in the case of extensions, leave significant room for lower-level agreements to set the terms of employment by leaving up to bargaining parties the design of the hierarchy of agreements (Denmark, Finland, the Netherlands, Norway and Sweden) or by allowing for the possibility to opt-out (Germany and Austria). In these countries co-ordination is relatively strong (at least in certain sectors), and usually takes the form of pattern bargaining.
In countries where bargaining takes place predominantly at company level, collective bargaining coverage is typically below 20% (the Czech Republic and Ireland are the only exceptions). In these countries coverage tends to go hand in hand with trade union membership since having a trade union or worker representation in the workplace is a necessary condition to be able to negotiate a collective agreement. Higher-level agreements (or similar regulation mechanisms such as “Modern Awards” in Australia or “Sectoral Employment Orders” in Ireland) can set some general minimum wage and work organisation standards and thus limit coverage erosion to some extent. Finally, among countries with dominant firm-level bargaining Japan stands out due to the significant and unique degree of co-ordination (Shunto).
Finally, in all countries where co-ordination is strong, trust is medium/high. Trust is indeed a key precondition for co-ordination to be effective. By contrast, the quality of labour relations is not systematically related to level of collective bargaining, with very high quality labour relations observed among both decentralised and centralised systems.
copy the linklink copied!Conclusions
This chapter has documented the granularity, diversity and complexity of national collective bargaining systems in OECD countries. The analysis confirms the need to go beyond standard macroeconomic indicators of collective bargaining: indeed, standard indicators of coverage, trade union density, or centralisation hide a wide variation in collective bargaining systems.
Capturing that variation implies accounting in a more precise way for the institutional set-ups and practices characterising collective bargaining systems. In particular, beyond considering the representativeness of social partners and the coverage of collective agreements (including by considering the role of extension mechanisms), the chapter identified four different building blocks into which collective bargaining systems can be decomposed. Those are the actual degree of centralisation (taking into account both the predominant level of bargaining but also the institutional flexibility for lower-level agreements to derogate from higher-level agreements), the degree of co-ordination between bargaining units, the overall quality of labour relations as well as the level of enforcement of collective agreements.
This granular approach allows re-thinking old debates such as the one concerned with the optimal degree of bargaining centralisation. While full centralisation can ensure high coverage and inclusiveness at the expense, however, of flexibility, at the opposite extreme full decentralisation while leaving flexibility to individual firms, can result in low coverage and has clear limits in terms of inclusiveness. The chapter suggests that the articulation between sectoral and firm-level bargaining, the content of collective agreements at sectoral level, the use of extensions and of “escape valves” such as opening clauses and exemptions from extensions, are some of the key tools to find the right balance between flexibility and inclusiveness. Co-ordination mechanisms across sectors and firms are also key elements for ensuring inclusiveness and flexibility.
Grasping the full complexities of bargaining systems also allows distinguishing between systems which are only apparently similar, but which in fact largely vary in practice, and are therefore likely to yield contrasted outcomes. The next chapters build on this exercise, to assess whether and how collective bargaining can promote a high level of employment, labour market inclusion and labour market resilience (Chapter 3), as well as whether it has any bearing on the non-monetary aspects of job quality (Chapter 4).
Priorities for further research also emerge from this chapter. First, future work should focus more on understanding the increasing heterogeneity of collective bargaining systems within countries. The functioning of collective bargaining can vary significantly within the same country across sectors, yet the extent, drivers and effects of this divergence have not been studied in details so far. Second, while this chapter highlights the importance of co-ordination, formulating clear policy measures to effectively promote co-ordination remain difficult since the latter largely relies on traditions, unwritten practices and personal relationships where trust is fundamental. This is an important topic for future study.
References
[71] Addison, J. (2016), “Collective bargaining systems and macroeconomic and microeconomic flexibility: the quest for appropriate institutional forms in advanced economies”, IZA Journal of Labor Policy, Vol. 5/19, https://doi.org/10.1186/s40173-016-0075-8.
[44] Addison, J. et al. (2016), “Is the Erosion Thesis Overblown? Alignment from Without in Germany”, Industrial Relations, Vol. 55/3, pp. 415-443, https://doi.org/10.1111/irel.12144.
[106] Amossé, T. and J. Forth (2016), “Employee Expression and Representation at Work: Voice or Exit?”, in Comparative Workplace Employment Relations, Palgrave Macmillan UK, London, https://doi.org/10.1057/978-1-137-57419-0_3.
[103] Askenazy, P. and T. Breda (2019), Electoral Democracy at Work, Paris School of Economics.
[37] Australian Bureau of Statistics (2000), Australian Social Trends 2000, http://www.abs.gov.au/AUSSTATS/[email protected]/mediareleasesbytitle/46658007B1BC3062CA25690C002A24F0?OpenDocument (accessed on 21 February 2019).
[6] Autor, D. (2003), “Outsourcing at Will: The Contribution of Unjust Dismissal Doctrine to the Growth of Employment Outsourcing”, Journal of Labor Economics, Vol. 21/1, pp. 1-42, https://doi.org/10.1086/344122.
[97] Benassi, C. (2011), The Implementation of Minimum Wage: Challenges and Creative Solutions, https://kclpure.kcl.ac.uk/portal/en/publications/the-implementation-of-minimum-wage-challenges-and-creative-solutions(791d8f7c-355b-47f8-8ed2-e2d319742a77).html (accessed on 27 September 2019).
[2] Benassi, C. and T. Vlandas (2016), “Union inclusiveness and temporary agency workers: The role of power resources and union ideology”, European Journal of Industrial Relations, Vol. 22/1, pp. 5-22, https://doi.org/10.1177/0959680115589485.
[28] Bennett, J. and B. Kaufman (2002), The future of private sector unionism in the United States, M.E. Sharpe.
[30] Berry, C. and S. Mcdaniel (2018), Young people and trade unionism in the hourglass economy, Unions 21, http://www.unions21.org.uk (accessed on 6 November 2018).
[52] Blanchard, O., F. Jaumotte and P. Loungani (2014), “Labor market policies and IMF advice in advanced economies during the Great Recession”, IZA Journal of Labor Policy, Vol. 3/1, p. 2, https://doi.org/10.1186/2193-9004-3-2.
[98] Blanchard, O. and T. Philippon (2004), The Quality of Labor Relations and Unemployment, National Bureau of Economic Research, Cambridge, MA, https://doi.org/10.3386/w10590.
[82] Blanchard, O. and J. Wolfers (2000), “The Role of Shocks and Institutions in the Rise of European Unemployment: the Aggregate Evidence”, The Economic Journal, Vol. 110/462, pp. C1-C33, https://doi.org/10.1111/1468-0297.00518.
[13] Blanchflower, D. (2007), “International Patterns of Union Membership”, British Journal of Industrial Relations, Vol. 45, https://www.dartmouth.edu/~blnchflr/papers/bjirdgb.pdf (accessed on 19 October 2018).
[39] Böckerman, P. and R. Uusitalo (2006), Erosion of the Ghent System and Union Membership Decline: Lessons from Finland, http://citeseerx.ist.psu.edu/viewdoc/download?doi=10.1.1.500.3957&rep=rep1&type=pdf (accessed on 21 February 2019).
[64] Boeri, T. (2014), “Two-Tier Bargaining”, IZA Discussion Paper, No. 8358, http://ftp.iza.org/dp8358.pdf (accessed on 10 January 2018).
[99] Brandl, B. and C. Ibsen (2016), “Instability and Change in Collective Bargaining: An Analysis of the Effects of Changing Institutional Structures”, British Journal of Industrial Relations, Vol. 55/3, pp. 527-550, https://doi.org/10.1111/bjir.12207.
[8] Brandl, B. and A. Lehr (2016), “The strange non-death of employer and business associations: An analysis of their representativeness and activities in Western European countries”, Economic and Industrial Democracy, pp. 1-22, https://doi.org/10.1177/0143831X16669842.
[67] Brändle, T., W. Heinbach and M. Maier (2011), “Tarifliche Öffnung in Deutschland: Ausmaß, Determinanten, Auswirkungen”, Journal for Labour Market Research, Vol. 44/1-2, pp. 163–172, https://doi.org/10.1007/s12651-011-0069-3.
[27] Bronfenbrenner, K. (2009), No Holds Barred - The Intensification of Employer Opposition to Organizing, Economic Policy Institute, https://www.epi.org/publication/bp235/ (accessed on 14 May 2019).
[114] Brown, W. et al. (eds.) (2009), Employee representation, Cambridge University Press.
[14] Bryson, A. and R. Davies (2018), “Family, Place and the Intergenerational Transmission of Union Membership”, British Journal of Industrial Relations, https://doi.org/10.1111/bjir.12435.
[107] Bryson, A. and J. Forth (2010), Union Organisation and the Quality of Employment Relations, National Institute for Economic and Social Research, https://www.researchgate.net/publication/228894446_Union_Organisation_and_the_Quality_of_Employment_Relations (accessed on 27 September 2019).
[16] Bryson, A. and R. Gomez (2005), “Why Have Workers Stopped Joining Unions? The Rise in Never-Membership in Britain”, British Journal of Industrial Relations, Vol. 43/1, pp. 67-92, https://doi.org/10.1111/j.1467-8543.2005.00345.x.
[32] Bryson, A. et al. (2005), “Youth-adult differences in the demand for unionization: Are American, British, and Canadian workers all that different?”, Journal of Labor Research, Vol. 26/1, pp. 155-167, https://doi.org/10.1007/BF02812227.
[108] Bryson, A. et al. (2013), “The Comparative Advantage of Non-Union Voice in Britain, 1980-2004”, Industrial Relations: A Journal of Economy and Society, Vol. 52, pp. 194-220, https://doi.org/10.1111/irel.12001.
[1] Calmfors, L. et al. (1988), “Bargaining Structure, Corporatism and Macroeconomic Performance”, Economic Policy, Vol. 3/6, p. 13, https://doi.org/10.2307/1344503.
[59] Cameron, D. (1984), “Social Democracy, Corporatism, Labour Quiescence and the Representation of Economic Interest in Advanced Capitalist Societies”, in Goldthorpe, J. (ed.), Order and Conflict in Contemporary Capitalism, Oxford University Press, Oxford.
[77] Carcillo, S. et al. (2019), “Assessing recent reforms and policy directions in France: Implementing the OECD Jobs Strategy”, OECD Social, Employment and Migration Working Papers, No. 227, OECD Publishing, Paris, https://dx.doi.org/10.1787/657a0b54-en.
[41] Checchi, D. and C. Lucifora (2002), “Unions and labour market institutions in Europe”, Departmental Working Papers, No. 16, Department of Economics, Management and Quantitative Methods at Università degli Studi di Milano, https://ideas.repec.org/p/mil/wpdepa/2002-16.html (accessed on 14 May 2019).
[38] Cohen, Y., Y. Haberfeld and G. Mundlak (2007), “The State of Organized Labor in Israel”, Journal of labour research, Vol. 28/2, pp. 255-73, https://pdfs.semanticscholar.org/7917/d39fd327036e79beeb3396d53df848a5f168.pdf (accessed on 14 May 2019).
[111] Conchon, A. (2011), Board-level employee representation rights in Europe : facts and trends, ETUI, European Trade Union Institute.
[53] De Ridder, M. and R. Euwals (2016), “What are the wage effects of extending collective labour agreements? Evidence from the Netherlands CPB Background Document”, CPB Background Document.
[102] De Spiegelaere, S. et al. (2019), “Democracy at work”, in Benchmarking Working Europe 2019, European Trade Union Institute (ETUI), Brussels, https://www.etui.org/Publications2/Books/Benchmarking-Working-Europe-2019 (accessed on 8 October 2019).
[116] Duran, J. and A. Corral (2016), Employee involvement and participation at work: Recent research and policy developments revisited, Eurofound, https://www.eurofound.europa.eu/publications/report/2016/eu-member-states/employee-involvement-and-participation-at-work-recent-research-and-policy-developments-revisited (accessed on 11 October 2019).
[66] Dustmann, C. et al. (2014), “From Sick Man of Europe to Economic Superstar: Germany’s Resurgent Economy”, Journal of Economic Perspectives, Vol. 28/1, pp. 167-188, https://doi.org/10.1257/jep.28.1.167.
[24] Ebbinghaus, B., C. Göbel and S. Koos (2011), “Social capital, ‘Ghent’ and workplace contexts matter: Comparing union membership in Europe”, European Journal of Industrial Relations, Vol. 17/2, pp. 107-124, https://doi.org/10.1177/0959680111400894.
[65] Eurofound (2015), Collective bargaining in Europe in the 21st century, Publication Office of the European Union, Luxembourg.
[75] European Commission, D. (2019), “Enhanced Surveillance Report”, Institutional Paper, No. 103, European Commission, https://ec.europa.eu/info/sites/info/files/economy-finance/ip103_en.pdf (accessed on 27 September 2019).
[18] Farber, H. and A. Krueger (1992), “Union Membership in the United States: The Decline Continues”, NBER Working Paper, No. 4216, National Bureau of Economic Research, Cambridge, MA, https://doi.org/10.3386/w4216.
[113] Felstead, A., D. Gallie and G. Francis (eds.) (2015), Unions and Job Quality, Oxford University Press.
[25] Fitzenberger, B., K. Kohn and Q. Wang (2011), “The erosion of union membership in Germany: determinants, densities, decompositions”, Journal of Population Economics, Vol. 24/1, pp. 141-165, https://doi.org/10.1007/s00148-009-0299-7.
[42] Flanagan, R. (2005), “Has management strangled U.S. unions?”, Journal of Labor Research, Vol. 26/1, pp. 33-63, https://doi.org/10.1007/BF02812223.
[48] Fougere, D., E. Gautier and S. Roux (2016), “The Impact of the National Minimum Wage on Industry-Level Wage Bargaining in France”, Sciences Po publications, No. 587, https://ideas.repec.org/p/spo/wpmain/infohdl2441-3mjt8d63i195voq228mf1sr91q.html (accessed on 27 September 2019).
[87] Fougère, D., E. Gautier and S. Roux (2018), “Wage floor rigidity in industry-level agreements: Evidence from France”, Labour Economics, Vol. 55, pp. 72-97, https://doi.org/10.1016/j.labeco.2018.09.001.
[105] Freeman, R. and J. Medoff (1984), What do unions do?, Basic Books.
[117] Gallie, D. and Y. Zhou (2013), Work organisation and employee involvement in Europe, Eurofound, https://www.eurofound.europa.eu/publications/report/2013/working-conditions/work-organisation-and-employee-involvement-in-europe (accessed on 11 October 2019).
[95] Garnero, A. (2018), “The dog that barks doesn’t bite: coverage and compliance of sectoral minimum wages in Italy”, IZA Journal of Labor Policy, Vol. 7/1, https://doi.org/10.1186/s40173-018-0096-6.
[94] Garnero, A., S. Kampelmann and F. Rycx (2015), “Sharp Teeth or Empty Mouths? European Institutional Diversity and the Sector-Level Minimum Wage Bite”, British Journal of Industrial Relations, Vol. 53/4, pp. 760-788, https://doi.org/10.1111/bjir.12104.
[17] Gilfillan, G. and C. McGann (2018), Trends in union membership in Australia, Parliament of Australia, https://www.aph.gov.au/About_Parliament/Parliamentary_Departments/Parliamentary_Library/pubs/rp/rp1819/UnionMembership (accessed on 21 February 2019).
[96] Gindling, T., N. Mossaad and J. Trejos (2015), “The Consequences of Increased Enforcement of Legal Minimum Wages in a Developing Country”, ILR Review, Vol. 68/3, pp. 666-707, https://doi.org/10.1177/0019793915575703.
[33] Givan, R. and A. Hipp (2012), “Public Perceptions of Union Efficacy”, Labor Studies Journal, Vol. 37/1, pp. 7-32, https://doi.org/10.1177/0160449X11429264.
[109] Gold, M. (2011), “‘Taken on board’: An evaluation of the influence of employee board-level representatives on company decision-making across Europe”, European Journal of Industrial Relations, Vol. 17/1, pp. 41-56, https://doi.org/10.1177/0959680110392276.
[3] Gomez, R. and D. Lamb (2016), “Unions and Traditionally Disadvantaged Workers: Evidence from Union Wage Premiums in Canada 2000 to 2012”, E-Journal of International and Comparative Labour Studies, Vol. 5/3, http://ejcls.adapt.it/index.php/ejcls_adapt/article/view/201 (accessed on 15 October 2019).
[115] Gould, E. and A. Hijzen (2016), “Growing Apart, Losing Trust? The Impact of Inequality on Social Capital”, IMF Working Paper, No. 176, International Monetary Fund, Washington, DC.
[5] Gramm, C. and J. Schnell (2001), “The use of flexible staffing arrangements in core production jobs”, Industrial and Labor Relations Review, Vol. 54/2, pp. 245-258, http://journals.sagepub.com/doi/pdf/10.1177/001979390105400203 (accessed on 21 February 2018).
[54] Haucap, J., U. Pauly and C. Wey (2001), “Collective wage setting when wages are generally binding. An antitrust perspective”, International Review of Law and Economics, Vol. 21/3, pp. 287-307, https://doi.org/10.1016/S0144-8188(01)00061-8.
[51] Hayter, S. and J. Visser (2018), Collective Agreements: Extending Labour Protection, International Labour Organization, Geneva.
[57] Hijzen, A. and P. Martins (2016), “No Extension without Representation? Evidence from a Natural Experiment in Collective Bargaining”, IMF Working Papers, No. 16/143, International Monetary Fund.
[58] Hijzen, A., P. Martins and J. Parlevliet (2019), “Frontal assault versus incremental change: A comparison of collective bargaining in Portugal and the Netherlands”, IZA Journal of Labor Policy, Vol. 9/1, https://doi.org/10.2478/izajolp-2019-0008.
[104] Hirschman, A. (1972), Exit, voice, and loyalty : responses to decline in firms, organizations, and states, Harvard University Press.
[40] Høgedahl, L. and K. Kongshøj (2017), “New trajectories of unionization in the Nordic Ghent countries: Changing labour market and welfare institutions”, European Journal of Industrial Relations, Vol. 23/4, pp. 365-380, https://doi.org/10.1177/0959680116687666.
[63] Ibsen, C. and M. Keune (2018), “Organised Decentralisation of Collective Bargaining : Case studies of Germany, Netherlands and Denmark”, OECD Social, Employment and Migration Working Papers, No. 217, OECD Publishing, Paris, https://dx.doi.org/10.1787/f0394ef5-en.
[43] ILO (2014), Portugal : tackling the jobs crisis in Portugal, International Labour Office, https://ideas.repec.org/b/ilo/ilosge/994853263402676.html (accessed on 27 September 2019).
[85] IMF (2016), “Time for a Supply-Side Boost? Macroeconomic Effects of Labor and Product Market Reforms in Advanced Economies”, in World Economic Outlook, April 2016 : Too Slow for Too Long., International Monetary Fund, Washington, DC.
[31] Inglehart, R. (1997), Modernization and postmodernization : cultural, economic, and political change in 43 societies, Princeton University Press, https://press.princeton.edu/titles/5981.html (accessed on 19 November 2018).
[73] International Labour Office, R. (2014), “Greece: Productive jobs for Greece”, Studies on growth with equity, International Labour Organisation, https://www.ilo.org/wcmsp5/groups/public/---dgreports/---dcomm/---publ/documents/publication/wcms_319755.pdf (accessed on 27 September 2019).
[72] Izquierdo, M. and J. Jimeno (2015), “Employment, wage and price reactions to the crisis in Spain: firm-level evidence from the WDN Survey”, Documentos Ocasionales, No. 1503, Banco de Espana.
[91] Kato, T. (2016), “Productivity, wages and unions in Japan”, Conditions of Work and Employment, No. 73, International Labour Office, Geneva, https://www.ilo.org/wcmsp5/groups/public/---ed_protect/---protrav/---travail/documents/publication/wcms_465070.pdf (accessed on 27 September 2019).
[78] Kenworthy, L. (2001), “Wage-Setting Measures: A Survey and Assessment”, World Politics, Vol. 54/1, pp. 57-98, https://doi.org/10.1353/wp.2001.0023.
[34] Keune, M. (2015), Trade unions and young workers in seven EU countries, ADAPT-Association for International and Comparative Studies in Labour Law and Industrial Relations, http://www.adapt.it/younion/ (accessed on 13 November 2018).
[36] Kjellberg, A. (2011), “The Decline in Swedish Union Density since 2007”, Nordic Journal of Working Life Studies, Vol. 1/1, pp. 67-93, http://portal.research.lu.se/ws/files/3462138/2064087.pdf (accessed on 21 February 2019).
[110] Kleinknecht, R. (2015), “Employee participation in corporate governance: Implications for company resilience”, European Journal of Industrial Relations, Vol. 21/1, pp. 57-72, https://doi.org/10.1177/0959680114523820.
[26] Legree, S., T. Schirle and M. Skuterud (2014), “The Effect of Labour Relations Laws on Union Density Rates: Evidence from Canadian Provinces”, LCERPA Working Papers, https://ideas.repec.org/p/wlu/lcerpa/0078.html (accessed on 21 February 2019).
[23] Lesch, H. (2004), “Trade Union Density in International Comparison”, CESifo Forum, Vol. 5/4, pp. 12-18, https://econpapers.repec.org/article/cesifofor/v_3a5_3ay_3a2004_3ai_3a4_3ap_3a12-18.htm (accessed on 14 May 2019).
[55] Magruder, J. (2012), “High Unemployment Yet Few Small Firms: The Role of Centralized Bargaining in South Africa”, American Economic Journal: Applied Economics, Vol. 4/3, pp. 138-166, https://doi.org/10.1257/app.4.3.138.
[56] Martins, P. (2014), “30,000 Minimum Wages: The Economic Effects of Collective Bargaining Extensions”, IZA Discussion Papers, No. 8540.
[46] Ministério do Trabalho, S. (2016), Livro Verde sobre as Relações Laborais, Ministério do Trabalho, Solidariedade e Segurança Social, http://cite.gov.pt/pt/destaques/noticia613.html (accessed on 27 September 2019).
[12] Morisette, R., G. Schellenberg and A. Johnson (2005), “Diverging trends in unionization”, Perspectives on Labour and Income, Vol. 6/4, https://www.researchgate.net/publication/237242624_Diverging_trends_in_unionization (accessed on 30 September 2019).
[90] Morishima, M. (1991), “Information Sharing and Collective Bargaining in Japan: Effects on Wage Negotiation”, Industrial and Labor Relations Review, Vol. 44/3, p. 469, https://doi.org/10.2307/2524156.
[49] Naumannn, R. (2018), “Reregulating the extension of collective agreements in Portugal: A case study”, in Susan Hayter and Jelle Visser (ed.), Collective Agreements: Extending Labour Protection, International Labour Organisation.
[80] Nickell, S. (1997), “Unemployment and Labor Market Rigidities: Europe versus North America”, Journal of Economic Perspectives, Vol. 11/3, pp. 55-74, https://doi.org/10.1257/jep.11.3.55.
[92] Nickell, S. and R. Layard (1999), “Labor market institutions and economic performance”, in Handbook of Labor Economics, Elsevier, https://doi.org/10.1016/S1573-4463(99)30037-7.
[74] OECD (2018), OECD Economic Surveys: Greece 2018, OECD Publishing, Paris, https://dx.doi.org/10.1787/eco_surveys-grc-2018-en.
[7] OECD (2017), “Collective bargaining in a changing world of work”, in OECD Employment Outlook 2017, OECD Publishing, Paris, https://dx.doi.org/10.1787/empl_outlook-2017-8-en.
[45] OECD (2017), Labour Market Reforms in Portugal 2011-15: A Preliminary Assessment, OECD Publishing, Paris, https://dx.doi.org/10.1787/9789264269576-en.
[86] OECD (2017), “Labour market resilience: The role of structural and macroeconomic policies”, in OECD Employment Outlook 2017, OECD Publishing, Paris, https://dx.doi.org/10.1787/empl_outlook-2017-6-en.
[76] OECD (2014), The 2012 Labour Market Reform in Spain: A Preliminary Assessment, OECD Publishing, Paris, https://dx.doi.org/10.1787/9789264213586-en.
[61] OECD (2012), OECD Employment Outlook 2012, OECD Publishing, Paris, https://dx.doi.org/10.1787/empl_outlook-2012-en.
[84] OECD (2012), “What Makes Labour Markets Resilient During Recessions?”, in OECD Employment Outlook 2012, OECD Publishing, Paris, https://dx.doi.org/10.1787/empl_outlook-2012-3-en.
[60] OECD (2004), OECD Employment Outlook 2004, OECD Publishing, Paris, https://dx.doi.org/10.1787/empl_outlook-2004-en.
[81] OECD (1997), OECD Employment Outlook 1997: July, OECD Publishing, Paris, https://dx.doi.org/10.1787/empl_outlook-1997-en.
[22] OECD (1991), “Trends in trade union membership”, in OECD Employment Outlook, http://www.oecd.org/els/emp/4358365.pdf (accessed on 13 September 2019).
[20] Peetz, D. (1990), “Declining Union Density”, Journal of Industrial Relations, Vol. 32/2, pp. 197-223, https://doi.org/10.1177/002218569003200202.
[4] Salvatori, A. (2009), “What Do Unions Do to Temporary Employment?”, IZA Discussion Paper, No. 4554, http://ftp.iza.org/dp4554.pdf (accessed on 26 January 2018).
[21] Schnabel, C. (2013), “Union membership and density: Some (not so) stylized facts and challenges”, European Journal of Industrial Relations, Vol. 19/3, pp. 255-272, https://doi.org/10.1177/0959680113493373.
[11] Schnabel, C. and J. Wagner (2007), “The Aging of the Unions in West Germany 1980-2006”, IWQW Discussion Paper, No. 04/2008, IWQW, https://www.econstor.eu/bitstream/10419/29565/1/612462811.pdf (accessed on 19 October 2018).
[69] Schnabel, C., S. Zagelmeyer and S. Kohaut (2006), “Collective Bargaining Structure and its Determinants: An Empirical Analysis with British and German Establishment Data”, European Journal of Industrial Relations, Vol. 12/2, pp. 165-188, https://doi.org/10.1177/0959680106065036.
[112] Scholz, R. and S. Vitols (2019), “Board-level codetermination: A driving force for corporate social responsibility in German companies?”, European Journal of Industrial Relations, Vol. 25/3, pp. 233-246, https://doi.org/10.1177/0959680119830566.
[70] Schulten, T. and R. Bispinck (2014), “Wages, Collective Bargaining and Economic Development in Germany. Towards a more expansive and solidaristic development?”, WSI-Diskussionspapier, No. 191, Hans-Böckler-Stiftung, Wirtschafts- und Sozialwissenschaftliches Institut (WSI), http://www.wsi.de.
[68] Seifert, H. and H. Massa-Wirth (2005), “Pacts for employment and competitiveness in Germany”, Industrial Relations Journal, Vol. 36/3, pp. 217-240, https://doi.org/10.1111/j.1468-2338.2005.00355.x.
[89] Shirai, T. (1987), “Japan”, in Windmuller, J. (ed.), Collective bargaining in industrialised market economies : a reappraisal, International Labour Office, Geneva, https://books.google.fr/books/about/Collective_bargaining_in_industrialised.html?id=l8yxAAAAIAAJ&redir_esc=y (accessed on 27 September 2019).
[79] Soskice, D. (1990), “Wage determination: The changing role of institutions in advanced industrialized countries”, Oxford Review of Economic Policy, https://doi.org/10.1093/oxrep/6.4.36.
[83] Teulings, C. and J. Hartog (2009), Corporatism or competition?, https://doi.org/10.1017/cbo9780511599330.
[88] Togaki, I. (1986), “Determination of Wages in Japan”, in Bergmann, J.; Tokunaga, S. (ed.), Economic and Social Aspects of Industrial Relations, Campus, Frankfurt-New York.
[93] Traxler, F. (2003), Coordinated bargaining: a stocktaking of its preconditions, practices and performance.
[62] Traxler, F. (1995), “Farewell to Labour Market Associations? Organized versus Disorganized Decentralization as a Map for Industrial Relations”, in Crouch, C. and F. Traxler (eds.), Organized Industrial Relations in Europe: What Future?, Aldershot, Avebury.
[9] Vachon, T. and M. Wallace (2013), “Globalization, Labor Market Transformation, and Union Decline in U.S. Metropolitan Areas”, Labor Studies Journal, Vol. 38/3, pp. 229-255, https://doi.org/10.1177/0160449X13511539.
[35] Vandaele, K. (2012), “Youth representatives’ opinions on recruiting and representing young workers: A twofold unsatisfied demand?”, European Journal of Industrial Relations, Vol. 18/3, pp. 203-218, https://doi.org/10.1177/0959680112452692.
[50] Visser, J. (2018), “Extension policies compared: How the extension of collective agreements works in the Netherlands, Switzerland, Finland and Norway”, in Hayter, S. and J. Visser (eds.), Collective agreements: extending labour protection, International Labour Organization, Geneva.
[47] Visser, J. (2016), “What happened to collective bargaining during the great recession?”, IZA Journal of Labor Policy, Vol. 5/1, https://doi.org/10.1186/s40173-016-0061-1.
[10] Visser, J. (2006), “Union Membership Statistics in 24 Countries”, Federal Publications, https://digitalcommons.ilr.cornell.edu/key_workplace/273 (accessed on 9 October 2018).
[15] Visser, J. (2002), “Why Fewer Workers Join Unions in Europe: A Social Custom Explanation of Membership Trends”, British Journal of Industrial Relations, Vol. 40/3, pp. 403-430, https://doi.org/10.1111/1467-8543.00241.
[19] Visser, J. (forthcoming), “Can Unions revitalize?”, International Journal of Labour Research.
[101] Wilkinson, A. et al. (eds.) (2010), Voice in the Wilderness? The Shift From Union to Non‐Union Voice in Britain, Oxford University Press, https://doi.org/10.1093/oxfordhb/9780199207268.003.0016.
[100] Willman, P., R. Gomez and A. Bryson (2009), “Voice at the workplace: where do we find it, why is it there, and where is it going?”, in Brown, W. (ed.), The evolution of the modern workplace, Cambridge University Press, https://www.researchgate.net/publication/43220301_Voice_at_the_workplace_where_do_we_find_it_why_is_it_there_and_where_is_it_going (accessed on 17 September 2019).
[29] Wooden, M. (1999), “Union Amalgamations and the Decline in Union Density”, Journal of Industrial Relations, Vol. 41/1, pp. 35-52, https://doi.org/10.1177/002218569904100102.
In order to analyse the role of employment composition effects on the evolution of trade union density a nonlinear multivariate decomposition method is conducted on individual microdata on union membership This technique uses the output from probit regression model to partition the components of year differences in a statistic, such as a mean or proportion, into a component attributable to the employment composition changes and a component attributable to differences in unionisation by employment characteristics.
For each year t, the probability of employee i to be unionised is regressed on four vectors accounting for employment composition:
(1)
Where F is the probit function defined as the cumulative normal distribution function , and the employment composition vector grouped as follows: demographics (sex, age groups and educational attainment), job characteristics (industry, occupation, public/private/sector and firm size), atypical employment (temporary/ permanent contract, part-time/full-time job and job tenure) and other factors (migration status and quintile of the hourly earnings).
Then, the mean difference in union density between two years (indices T for the last year and 0 for the base year) is decomposed as:
(2)
+ (3)
The first component of equation (E) refers to the part of the differential attributable to changes in employment composition and the second component (C) refers to the part of the differential attributable to differences in unionisation by group.
The contribution of each employment characteristics to the employment composition effect (E) can be decomposed by the mean of weighting factors derived from as:
, where
Thus, the composition weights reflect the contribution of the kth covariate to the linearization of E as determined by the magnitude of the group difference in means weighted by the reference group’s effect.
The analysis of employment composition effects on trade union density has been conducted on 16 countries based on 18 data surveys (two for Mexico and the United Kingdom, respectively) for which question on trade union affiliation and a sufficient number of employment characteristics was available (see Annex Table 2.B.1).
Labour force surveys, that are official national sources to estimate trade union density, have been used for Canada, Ireland, Mexico (2005-18), the United Kingdom (2007-17) and the United States. In the case of Mexico, the panel data survey (ENIGH) and the labour force survey (ENOE) are not recognised as an official source to estimate the degree of unionisation among employees. However, in the absence of alternative data source, estimates based on these two survey are integrated into the OECD/ICTWSS Database on trade unions. It is worth to note that for international comparison purpose, the incorporated self-employed for Canada and the United States are included in the OECD/ICTWSS database what is not the case in this analysis.
Panel data surveys for Australia (HILDA), Germany (SOEP), Korea (KLIPS) and the United Kingdom (BHPS in 1994-2007).and data from the European social survey (ESS) for some European countries (Austria, Belgium, Denmark, Finland, Israel, the Netherlands, Norway and Sweden) complete this analysis. For the latter, the results for these countries should be interpreted with cautious due to the relative small sample sizes of this survey and the restriction applied as a consequence of small sample sizes for some categories (agriculture and persons aged 65 or more has been excluded).
As indicated in Annex 2.A, the analysis includes the main dimensions of employment that potentially drive the change in trade union density. However, all of these dimensions are not always available in the survey or are only available for a limited number of years. While almost all countries include the demographic variables, migration status (based on country of birth), temporary employment, job tenure, public sector, firm size and the quintiles of the hourly wage are frequently absent (Annex Table 2.B.1 and Annex Table 2.B.2). For the purposes of the analysis and to take into account as many dimensions as possible, the period covered for some countries has been restricted: this is the case for Germany and Korea to integrate temporary employment, reducing the analysis to the period 1998-2015 instead of 1985-2015 and to the period 2002-16 instead of 1998-2016, respectively.
Another issue relates to the comparability of some variables over time due to a change in classification as for educational attainment, industry or occupation. The data for the United States are clearly affected by this problem given the long period covered by the CPS-MORG (1983-2018). In particular, both industry and occupation classifications changed at the turn of the century: in this case, a simple mapping based on years 2000-02 (for these years, variables are double coded into both classifications) has been applied to maintain the comparability over time. The same problem arise with the countries covered by the European Social Survey (industry classification changed in 2008 from NACE Rev. 1.1 to NACE Rev. 2 and occupation in 2012 for ISCO-88 to ISCO-08). Nevertheless, as the number of observations is too small to conduct the analysis on detailed categories of industry and occupation, both variables have been recoded into broad categories that limits the effects of breaks in series.
The decomposition analysis for Mexico and the United Kingdom are conducted on two sub periods based on two different surveys. While, the regressions are based on the same number of controls for the United Kingdom in both surveys, the analysis in Mexico for the period 1992-2002 (ENIGH) is based on a reduced number of controls. A simple comparison of the employment composition effects using the same number of controls based on the ENOE shows that the conclusion remains the same except that the demographic factors (gender, age and education) play a more significant and positive role (Annex Figure 2.B.1). In the case of the United States, the inclusion of migrant workers in the analysis for the period 1994-2018 does not really change the results (Annex Figure 2.B.2).
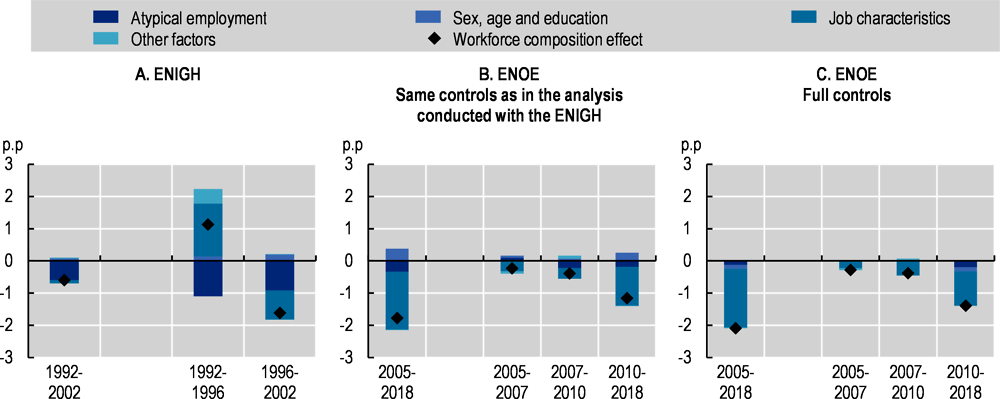
Note: Multivariate decompositions analysis based on probit regressions including control for sex (female), age groups, education, type of contract (part-time), contract duration (temporary jobs), occupation, industry, quintiles of the hourly earnings and sector (public sector) for ENIGH and migrant workers, job tenure and firm size for the ENOE. See Annex 2.A for further details on the methodology and Annex 2.B for details on definitions and variables included in the analysis.
Source: OECD Estimates based on the Encuesta Nacional de Ingresos y Gastos de los Hogares (ENIGH) in 1992-2002 and the Encuesta Nacional de Ocupación y Empleo (ENOE) in 2005-18.

Note: Multivariate decompositions analysis based on probit regressions including control for sex (female), age groups, education, type of contract (part-time), occupation, industry, quintiles of the hourly earnings and sector (public sector). See Annex 2.A for further details on the methodology and Annex 2.B for details on definitions and variables included in the analysis.
Source: OECD Estimates based on the Current Population Survey Merged Outgoing Rotation Groups (CPS MORG).
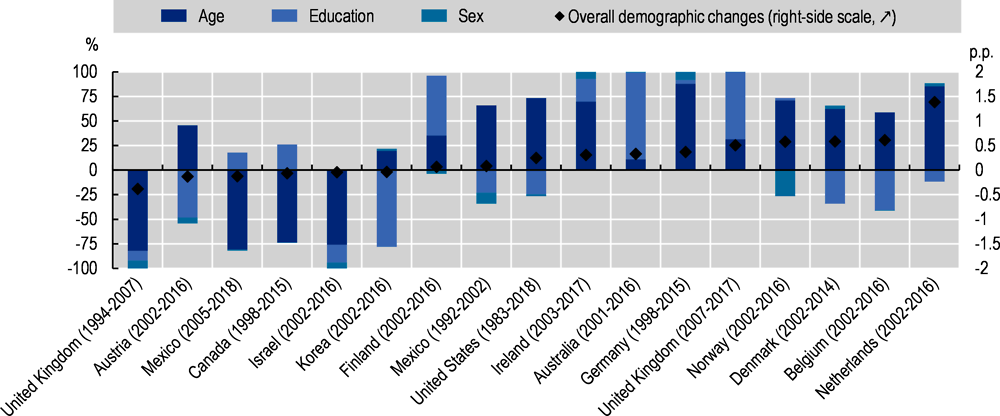
Note: Multivariate decompositions analysis based on probit regressions including control for sex (female), age groups, education, migrant workers, job tenure, type of contract (part-time), contract duration (temporary jobs), occupation, industry, quintiles of the hourly earnings, sector (public sector) and firm size. See Annex 2.A for further details on the methodology and Annex 2.B for details on definitions and variables included in the analysis. Diamonds represent the contribution of overall demographic change to the change in union density (“between effect”’). This overall contribution is decomposed in the relative effect of changes in sex, age and education (bars).
Source: See Annex Table 2.B.1.
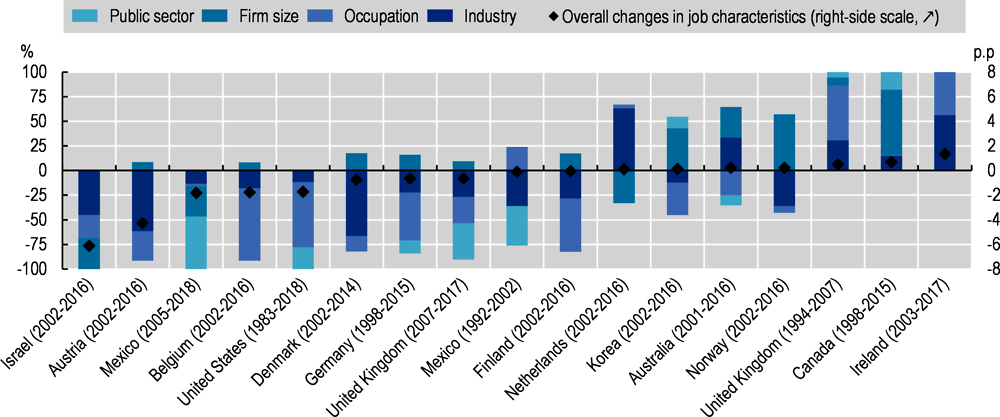
Note: Multivariate decompositions analysis based on probit regressions including control for sex (female), age groups, education, migrant workers, job tenure, type of contract (part-time), contract duration (temporary jobs), occupation, industry, quintiles of the hourly earnings, sector (public sector) and firm size. See Annex 2.A for further details on the methodology and Annex 2.B for details on definitions and variables included in the analysis. Diamonds represent the contribution of changes in job characteristics to the change in union density (“between effect”’). This overall contribution is decomposed in the relative effect of changes in public sector, firm size, occupation and industry (bars).
Source: See Annex Table 2.B.1.
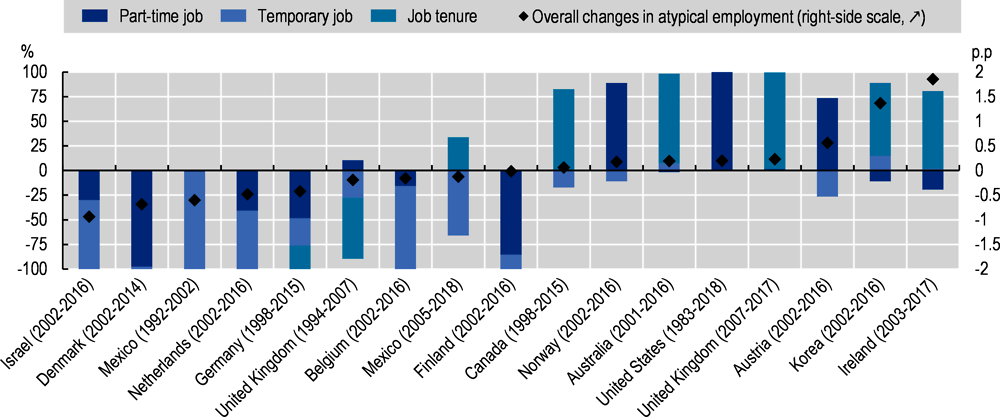
Note: Multivariate decompositions analysis based on probit regressions including control for sex (female), age groups, education, migrant workers, job tenure, type of contract (part-time), contract duration (temporary jobs), occupation, industry, quintiles of the hourly earnings, sector (public sector) and firm size. See Annex 2.A for further details on the methodology and Annex 2.B for details on definitions and variables included in the analysis. Diamonds represent the contribution of changes in atypical employment to the change in union density (“between effect”’). This overall contribution is decomposed in the relative effect of changes in part-time jobs, temporary jobs and job tenure (bars).
Source: See Annex Table 2.B.1.

Note: The adjusted ratio for individual characteristics is based on the marginal effect of youth (aged 20-34) relatively to adults (aged 35-54) from a probit regression controlling for temporary job (excepted for the United States), sex, educational levels, industry, public vs private sector (except for Austria, Belgium, Ireland, Norway and Sweden), occupation, firm size (except for the United States) and full-time vs. part-time employment. Youth in education have been excluded in the different samples used in the regressions (although this was not possible for Finland, the United States, and countries with estimates based on the European Social Survey as a source). Countries are ordered by ascending order of the actual ratio for the latest year available.
Source: OECD estimates based on the Household, Income and Labour Dynamics in Australia (HILDA) for Australia, the labour force survey (LFS) for Canada, the Encuesta de Caracterización Socioeconómica Nacional (CASEN) for Chile, the Finnish Working Life Barometer (FWLB) for Finland, the Enquête statistique sur les ressources et conditions de vie (SRCV) for France, the German Socio-Economic Panel (SOEP) for Germany, the Quarterly National Household Survey (QNHS) for Ireland, the Korean Labor and Income Panel Study (KLIPS) for Korea, the Encuesta Nacional de Ocupación y Empleo (ENOE) for Mexico, the Labour Force Survey (LFS) for the United Kingdom, the Current Population Survey (CPS), May Supplement for the United States and the European Social Survey (ESS) for Austria, Belgium, Denmark, Norway and Sweden.
Statistics shown in Figure 2.6 Panels A and B are based on the occurrence of “individual freedom” and “solidarity and support for others” taken from the list of the three most important personal values of youth aged 20-34 and adults aged 35-54. The Question is labelled as follows in the Eurobarometer: “In the following list, which are the three most important values for you personally?”
Statistics reported in Figure 2.6 Panels C and D are calculated as the proportion of youth aged 20-34 and adults aged 35-54 who declared either that they engaged in the past / in the recent past / or that they would in the future engage in the following actions: attending a demonstration, donating money or raising funds for a particular social or political cause. The question in the ISSP 2014, Citizen Module II is labelled as follows: “Here are some different forms of political and social action that people can take. Please indicate, for each one, whether you have done any of these things in the past year, whether you have done it in the more distant past, whether you have not done it but might do it or have not done it and would never, under any circumstances, do it”. For the two following forms or political and political actions: “Took part in a demonstration (any kind of demonstration)” and “Donated money or raised funds for a social or political activity”.
Figures on perceived necessity of trade unions (Figure 2.7, Panel B) refer to the share of persons who consider that “workers needs strong trade unions to protect their interest”. For the United States, this corresponds to the percentage of persons feeling that the decline in union representation over the last 20 years has been mostly bad for working people (“As you may know, over the past twenty years there has been a large reduction in the percentage of workers who are represented by unions. Do you think this reduction in union representation has been mostly good for working people or mostly bad for working people?”). Age groups correspond to persons aged 20-34 for youth and aged 35-54 for the adults, except for Denmark (26-35 and 36-55, respectively). Belgium refers to Flanders only.
copy the linklink copied!Trust and perceived necessity of trade unions
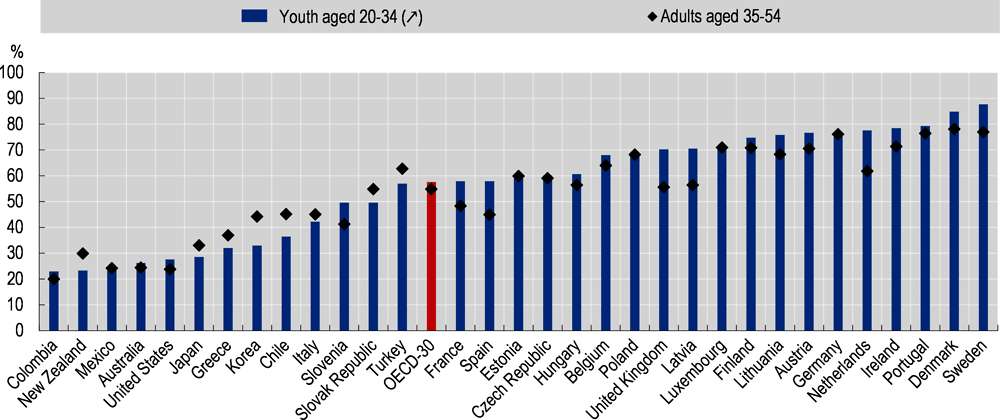
Note: For further details, see Annex Table 2.D.1. OECD-30 is the unweighted average of countries shown (not including Canada, Colombia, Iceland, Israel, Norway and Switzerland).
Source: OECD calculations based on the Australian Election Study (AES) for Australia, Eurobarometer 89.1, March 2018 for the European countries, and the World Value Survey (WVS) for all other countries.
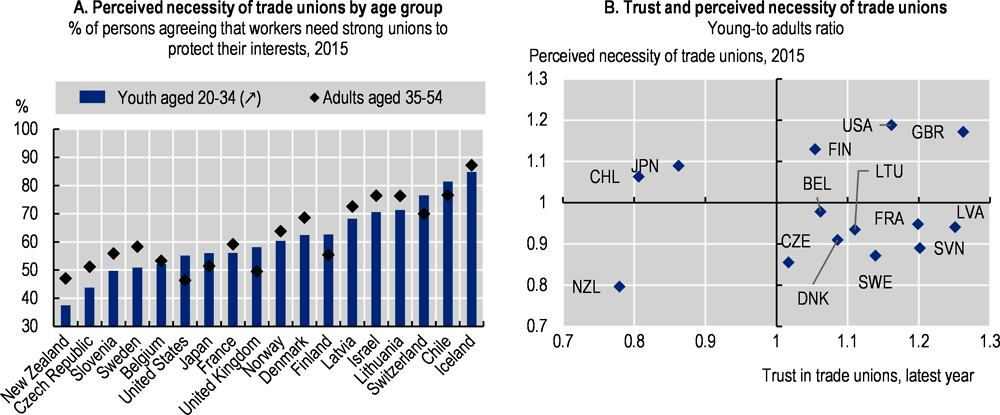
Note: Youth refers to persons aged 20-34 and adults to those aged 35-54, except for Denmark (26-35 and 36-55, respectively). Belgium refers only to Flanders. For further details on trust in trade unions, see Annex Table 5.B.1.
Source: OECD calculations based on the International Social Survey Programme (ISSP) 2015, Work orientation module IV and the Pew Research Center, March 2015 Political Survey for the United States.
Notes
← 1. Estimate based on collective bargaining coverage rate and total number of employees from OECD ALFS.
← 2. In this report, “firm” and “company” are used interchangeably.
← 3. Social dialogue comprises collective bargaining, workers’ voice, as well as social partners’ lobbying and engagement in tripartite negotiation/ consultation surrounding national legislation. The last one is not a focus of this report.
← 4. This is adapted from Visser (2016[47]).
← 5. In this report, “plant”, “establishment” and “workplace” are used interchangeably.
← 6. Another important country variation comes from the comparison of trends in union membership and union density. In some countries, the decline in density is only relative: the share of unionised workers in the total working population is falling, while union membership is stable or even increasing in absolute terms. These cases might stem from employment growth outpacing unionisation; or density might increase following a recession if mostly non-unionised jobs disappear. For instance, the increase in trade union density in Spain during the early phase of the financial crisis is likely to amount to a composition effect. The destruction of jobs in 2008-10 was mainly in temporary employment, where union density is lower. The destruction of these less unionised jobs could explain the increase in overall union density over the period. In other cases, the trends in union density and union membership align downwards: there, the fall in density might indeed correspond to a decrease in union membership.
← 7. The dramatic trends observed in Central and Eastern European countries must be understood in the context of the fall of central planning.
← 8. Already in 1991, research by the OECD concluded, based on shift-share analyses covering the 1970s and 1980s, that “the change in aggregate unionisation rates resulting from changes in the structure of employment (…) only accounts for a small part of the decline” (OECD, 1991[22]). These results are consistent with results presented in this chapter, covering the 1990s and 2000s (see Section 2.3). However, the notion that structural shifts and in particular industrial composition is a major driver of union density decline is a die-hard one: despite mounting evidence to the contrary, it remains strongly engrained in public opinion and keeps infusing policy discussion of the issue.
← 9. Examples of union-managed insurance funds include e.g. the “Ghent” unemployment systems in countries like Denmark, Finland, Iceland, Sweden, Norway and Belgium - which has a quasi-Ghent system since the government also plays a role in administering unemployment insurance, or the health insurance system in Israel before 1995.
← 10. Although available data on trade union density goes back to the 1960s, data limitations for other macro-level covariates significantly reduce the maximum period of analysis. At best, a macro-level regression analysis covers the 1985-2013 period. This is reduced to 1993-2013 when including control variables for education and occupation. The number of years covered by the macro-level regression is thus very limited for some countries.
← 11. Despite data limitations highlighted in endnote 10, an exploratory macro-level analysis was conducted, testing for several specifications. Only a very small number of results were robust to basic changes in specification (adding controls or using different variable definitions). In addition, to test the possibility that independent variables had differentiated effects for different groups of countries, interactions between independent variables and dummies for particular country groupings were introduced. Results were not robust to the introduction of these interactions. In other words, this exploratory macro-level analysis produced only volatile and unreliable results.
← 12. The period of analysis varies from 1983 to 2018 for the United States, to 2002-2016 for some European countries.
← 13. In the terminology of shift-share analyses, this is the “within groups” effect.
← 14. The share of high-skilled workers increased by 8.6, 9.8, 7, 7.2, 21.3, 11.9, 15 and 23% for those countries, respectively.
← 15. The share of youth employed (aged 15-24) decreased by 1.1, 3.4, 4.3 and 1.6%, respectively, while the share of older workers (aged 55-64) increased by 7.7, 4.8, 2.2 and 3.3%, respectively during the same periods.
← 16. The share of small firms increased by 8% in Israel, the share of large firms increased by 0.2% in Mexico and the share of medium-sized firms by 2.5% in the Netherlands.
← 17. The fall in the share of public sector employment was relatively modest in Australia (-0.3%), Germany (-1.7%) and the United States (-1.6%) but relatively sizeable in, the United Kingdom (-3.2%) between 2007 and 2017. In Mexico public sector employment decreased by 0.08%between 1992 and 2002 and by 0.97% between 2007 and 2018.
← 18. Between 1985 and 2015, the share of part-time workers has been rising in most OECD countries for which data are available. The increase was particularly sizable in some contexts, such as Austria (13%), Belgium (16.1%), Germany (15.2%), Ireland (16.4%), Italy (13.3%), Japan (10.9%), Luxembourg (11.6%), and the Netherlands (26.2%). The rise of part-time employment was more modest, but still important in Finland (7.3%), France (7.9%), the United Kingdom (5.5%), Greece (4.2%) and Korea (8.1%). The share of part-time workers only decreased in two of the countries for which data are available, namely Sweden and Norway.
← 19. In average in OECD countries, the share of temporary workers increased from 9.2% in 1980 to 11.7% in 2018.
← 20. Workers “socialised” in the 1970s are those who were in their 20s in the 1970s, and who therefore had their first formative experience in the labour market then. These experiences are likely to have influenced their opinions about labour market institutions.
← 21. Collective bargaining coverage is usually computed as the number of employees covered by the collective agreement, divided by the total number of wage and salary-earners.
← 22. In Germany, in order to prevent membership losses the German employer associations have created a special form of membership whereby companies are not bound by collective agreements (so called OT (Ohne Tarifbindung)-Mitgliedschaft), see Schulten and Bispinck (2014[70]).
← 23. Functional equivalent to extensions are legal provisions that make agreements valid for all firms and workers (such as in Iceland, Italy and Spain) but, in a way, also compulsory membership to an employer association as in Austria.
← 24. The increasing fuzziness around the definition of “employer”, “employee” and “place of work” is a challenge for the capacity of extensions to be an effective tool to guarantee fairness and a level-playing field.
← 25. Available at the following link http://www.oecd.org/employment/collective-bargaining.htm.
← 26. Visser (2018[50]) reports that it was used only once in 2004 but the government had to back down under pressure.
← 27. The exemption is subject to have concluded a firm-level agreement with a union.
← 28. In practice, two years after the reform, nothing has changed and extensions are still de facto automatic. No extension has been refused and no agreement has included different provisions for large and small firms.
← 29. The IAB Establishment Panel data allow identifying firms engaging in multi- or single-employer collective bargaining and firms simply orienting themselves to a sectoral agreement.
← 30. In Australia a collective agreement continues to apply until it is terminated or replaced.
← 31. Available at the following link http://www.oecd.org/employment/collective-bargaining.htm
← 32. But this may be driven by some outliers, i.e. few agreements not renewed since many years.
← 33. As a result of unions’ opposition to full decentralisation and employer associations (dominated by large firms) resistance to more competition in wage setting. And also because of lack of capacity and worker representation to negotiate firm-level agreements.
← 34. Occupational and regional (state, provincial) bargaining level play more minor role and are a variant of sectoral bargaining: regional level is relevant in Austria, Germany, Spain and France, but adds little to decentralisation in these countries, since bargained wage rates tend to be harmonised across regions in the same sector. There has been also recently a move towards integration of blue-and white collar agreements.
← 35. The hierarchy between standards principle states that: i) legislation and regulations take precedence over collective agreements; ii) national, cross-sectoral agreements take precedence over sectoral agreements, and sectoral over firm-level agreements.
← 36. Available at the following link http://www.oecd.org/employment/collective-bargaining.htm
← 37. In the case of Italy there is a tension between the rules set by social partners autonomously, which define a hierarchical relationship between bargaining levels, and jurisprudence, according to which a firm-level agreement can always depart from sectoral agreements.
← 38. Australia’s enterprise level agreement arrangements are underpinned by a safety net of minimum employment entitlements and condition.
← 39. Except for Quebec where it always applies and is established in Labour Law.
← 40. The term “opening clause” comes from the German term Öffnungsklausel where, since the 1990s they have been increasingly used.
← 41. In the Netherlands, for instance, derogations are used with the stated aim of not undermining the currently favourable support for the extensions of sectoral agreements.
← 42. And are still, under the German Law, only allowed when the bargaining partners explicitly make provisions for them.
← 43. Traxler (2003[93]) developed the “contingency thesis of collective bargaining” which states that the performance of a collective bargaining system critically hinges on the ability to enforce the terms of agreements.
← 44. Available at the following link http://www.oecd.org/employment/collective-bargaining.htm
← 45. Gould and Hijzen (2016[115]) provide evidence for the United States and European Union countries that increasing inequality undermines trust.
← 46. Moreover, in the European Union, European Works Councils can be established, upon the initiative of the employer or the employees, in multinationals operating in more than two countries of the European Economic Area if they employ at least 1 000 employees in the EEA and at least 150 employees in two member states.
← 47. Ideally, analyses of the effect of various forms of workers’ voice should take account of this variation in the rights granted to representative institutions, to arrive at nuanced and precise assessments. Unfortunately, comparative data with this level of precision are largely missing. Further data collection efforts on this dimension are needed.
← 48. Ideally, analyses of the effect of representative voice should take account of structures existing at the workplace and at the company level. However, data on this issue at the firm and worker level are not available for a large number of countries. Further work in this area, both in terms of data collection and analysis, would be welcome.
← 49. An extensive review of the literature by Conchon (2011[111]) of the impact of board-level employee representation on company performance (mainly based on studies in Germany) shows that there is no clear correlation (nor causal evidence) between the presence of board-level employee representatives and better or worse company performance.
← 50. Available at the following link http://www.oecd.org/employment/collective-bargaining.htm
← 51. For instance in Germany, in firms with more than 500 employees, more than 300 employees in Austria, more than 35 employees in Denmark, more than 30 employees in Norway and more than 25 employees in Sweden.
← 52. The adjective “regular” is of importance here: “direct voice”, as conceptualised in this report, should not be confused with freedom of speech at the workplace. Rather, it corresponds to cases where workers’ voice takes the form of institutionalised, regular meetings between employers and workers, which purpose is that workers express their concerns. The contrast with representative forms of voice comes from the presence or absence of a representative intermediary between workers and managers. The distinction between direct and representative forms of voice is a regular feature in the literature – see e.g. Duran and Corral (2016[116]), Gallie and Zhou (2013[117]), Bryson et al. (2013[108]).
← 53. Beyond this descriptive interest, it also provides analytical leverage in trying to measure the effect of workers’ voice arrangements on a variety of outcomes in a fine-grained manner.
← 54. Therefore, the average of 52% of European workers with access to representative voice depicted in Figure 2.16 corresponds to the total of 37% of workers with access to “mixed voice” and 18% with access to solely representative voice.
← 55. Data from the European Working Condition Survey for 2010 and 2015. Proportions are calculated over the pooled data for both years, excluding non-OECD countries from the list of countries covered in EWCS, and using individual weights
Metadata, Legal and Rights
https://doi.org/10.1787/1fd2da34-en
© OECD 2019
The use of this work, whether digital or print, is governed by the Terms and Conditions to be found at http://www.oecd.org/termsandconditions.