copy the linklink copied!Vaccinations
Vaccines are an effective and cost-effective tool for protecting against infectious diseases. The WHO estimates that vaccines prevent between 2 million and 3 million deaths each year worldwide through direct protection of those vaccinated and prevention of the spread of disease to those unvaccinated.
Figure 6.38 shows vaccination coverage for diphtheria, tetanus and pertussis (DTP), measles and hepatitis B at 1 year of age. Across OECD countries, vaccination levels are high, with around 95% of children receiving the recommended DTP or measles vaccinations and 91% receiving the recommended hepatitis B vaccination.
Despite high overall rates, however, nearly half of countries fall short of attaining the minimum immunisation levels recommended by the WHO to prevent the spread of measles (95%) and nearly 15% of countries fail to meet this target for DTP (90%). Furthermore, high national coverage rates may not be sufficient to stop disease spread, as low coverage in local populations can lead to outbreaks. In the United States, 1 123 individual cases of measles were reported for the period 1 January to 11 July 2019 – the highest number since 1992. Between March 2018 and February 2019 OECD countries in Europe reported 10 564 cases of measles. (CDC, 2019[1]; ECDC, 2019[2]).
Over the last decade, rates of vaccination across OECD have increased by six percentage points for hepatitis B and by half a percentage point for measles, but have decreased by one percentage point for DTP. Some countries, however, have experienced important reductions. Coverage for DTP has decreased by four or more percentage points in Mexico, Iceland, Lithuania, Poland, Slovenia and Spain, while rates have dropped at least three percentage points for measles coverage in Estonia, Lithuania, Poland, Canada, Chile, Iceland, the Netherlands, the Slovak Republic and Slovenia.
Figure 6.39 shows trends of vaccination from 2008 to 2018 by country and vaccine type. Countries listed in green boxes increased vaccination rates over the time period while countries in red boxes had declining rates. Roughly one-third of countries had declining levels for each vaccine.
Eroding public confidence in the safety and efficacy of vaccination, despite the lack of scientific evidence to support this, may play a role in declining coverage in some countries. In North America, only 72% of the population agreed that vaccines are safe; this number was only 59% in western Europe. In France, one in three people disagree that vaccines are safe (Gallup, 2019[3]).
Influenza is a common infectious disease responsible for 3-5 million severe cases worldwide, along with up to 650 000 deaths, including 72 000 in the WHO Europe Region (WHO, 2019[4]). The WHO recommends that 75% of elderly people be vaccinated against seasonal influenza.
Figure 6.40 shows vaccination rates among adults over 65 for 2007 and 2017. Over this period, the average vaccination rate against influenza among the elderly population decreased among OECD countries from 49% to 42%. Large decreases can be seen in Germany, Slovenia and Italy. Some countries did show increased vaccination over this period, including Mexico, Israel, the United States, Portugal, Denmark, Greece and New Zealand. Only Korea attained the 75% target, with coverage of 83%.
Vaccination rates reflect the percentage of people that receive the respective vaccination in the recommended timeframe. The age of complete immunisation differs across countries due to different immunisation schedules. For those countries recommending the first dose of a vaccine after 1 year of age, the indicator is calculated as the proportion of children less than 2 years of age who have received that vaccine. Thus, these indicators are based on the actual policy in a given country.
Some countries administer combination vaccines (e.g. DTP), while others administer the vaccinations separately. Some countries ascertain whether a vaccination has been received based on surveys and others based on encounter data, which may influence the results. In Canada, only four provinces and three territories include vaccination against hepatitis B in their infant immunisation programmes. Other Canadian jurisdictions do this at school age.
Influenza vaccination rates refer to the number of people aged 65 and over who have received an annual influenza vaccination, divided by the total number of people over 65. In some countries, the data are for people over 60. The main limitation in terms of data comparability arises from the use of different data sources, whether survey or programme, which are susceptible to different types of errors and biases. For example, data from population surveys may reflect some variation due to recall errors and irregularity of administration.
References
[1] CDC (2019), Measles Cases and Outbreaks.
[2] ECDC (2019), Monthly measles and rubella monitoring report - April 2019,.
[3] Gallup (2019), Wellcome Global Monitor – First Wave Findings.
[4] WHO (2019), Seasonal influenza.
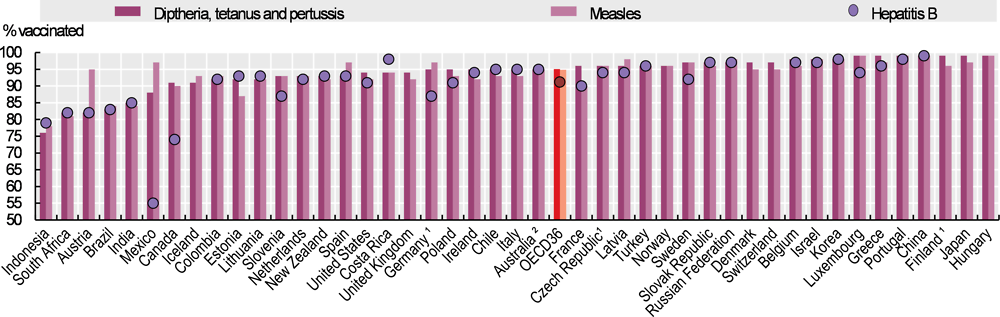
1. DTP data are estimated. 2. Measles data are estimated.
Source: OECD Health Statistics 2019.
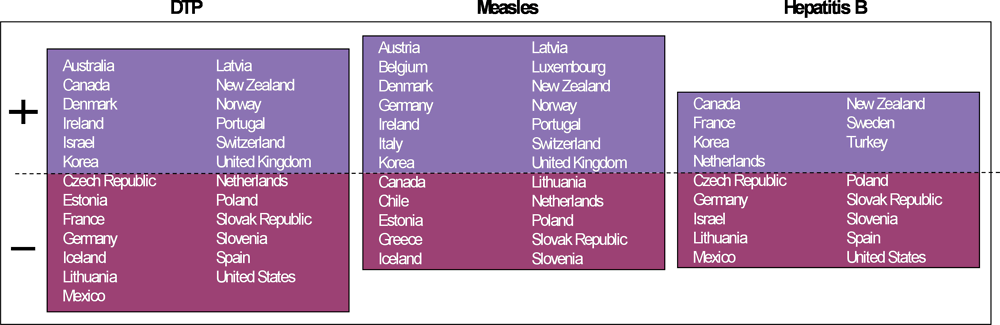
Note: Countries above the dashed line have increased and those below have decreased vaccination coverage by at least two percentage points over the last decade.

1. 2017 data are estimated.
Source: OECD Health Statistics 2019.
Metadata, Legal and Rights
https://doi.org/10.1787/4dd50c09-en
© OECD 2019
The use of this work, whether digital or print, is governed by the Terms and Conditions to be found at http://www.oecd.org/termsandconditions.